Afghan vs Egyptian Disability Age 5 to 17
COMPARE
Afghan
Egyptian
Disability Age 5 to 17
Disability Age 5 to 17 Comparison
Afghans
Egyptians
5.2%
DISABILITY AGE 5 TO 17
99.6/ 100
METRIC RATING
79th/ 347
METRIC RANK
5.0%
DISABILITY AGE 5 TO 17
100.0/ 100
METRIC RATING
44th/ 347
METRIC RANK
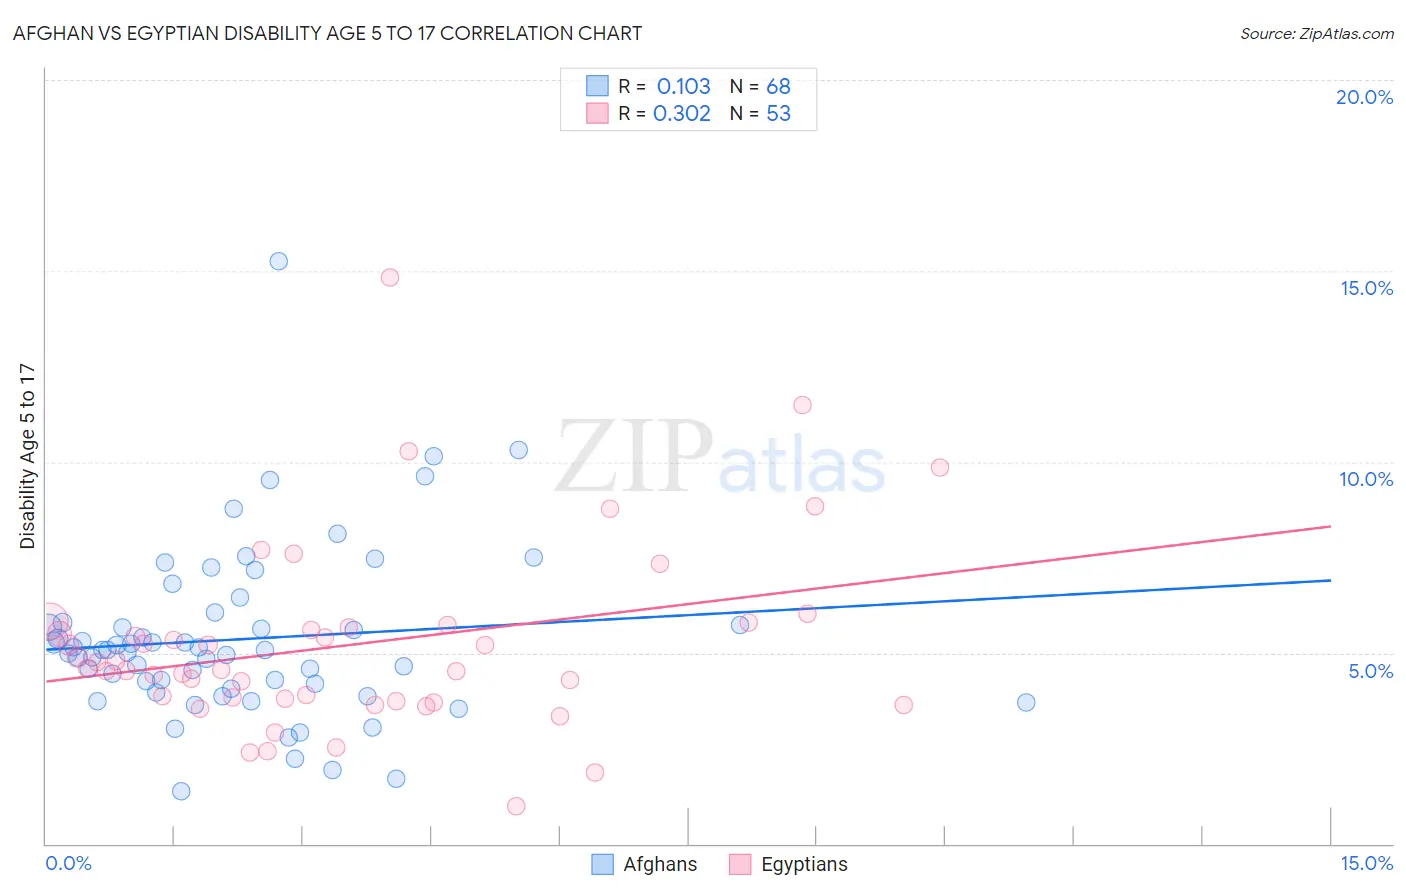
Afghan vs Egyptian Disability Age 5 to 17 Correlation Chart
The statistical analysis conducted on geographies consisting of 148,469,527 people shows a poor positive correlation between the proportion of Afghans and percentage of population with a disability between the ages 5 and 17 in the United States with a correlation coefficient (R) of 0.103 and weighted average of 5.2%. Similarly, the statistical analysis conducted on geographies consisting of 275,465,028 people shows a mild positive correlation between the proportion of Egyptians and percentage of population with a disability between the ages 5 and 17 in the United States with a correlation coefficient (R) of 0.302 and weighted average of 5.0%, a difference of 3.6%.
Disability Age 5 to 17 Correlation Summary
| Measurement | Afghan | Egyptian |
| Minimum | 1.4% | 0.99% |
| Maximum | 15.2% | 14.8% |
| Range | 13.9% | 13.8% |
| Mean | 5.4% | 5.2% |
| Median | 5.1% | 4.6% |
| Interquartile 25% (IQ1) | 4.1% | 3.8% |
| Interquartile 75% (IQ3) | 5.8% | 5.7% |
| Interquartile Range (IQR) | 1.6% | 1.9% |
| Standard Deviation (Sample) | 2.2% | 2.5% |
| Standard Deviation (Population) | 2.2% | 2.4% |
Similar Demographics by Disability Age 5 to 17
Demographics Similar to Afghans by Disability Age 5 to 17
In terms of disability age 5 to 17, the demographic groups most similar to Afghans are Sri Lankan (5.2%, a difference of 0.020%), Immigrants from Cuba (5.2%, a difference of 0.040%), Immigrants from Kazakhstan (5.2%, a difference of 0.050%), Immigrants from Guyana (5.2%, a difference of 0.070%), and Native Hawaiian (5.2%, a difference of 0.070%).
| Demographics | Rating | Rank | Disability Age 5 to 17 |
| Immigrants | Vietnam | 99.7 /100 | #72 | Exceptional 5.2% |
| Immigrants | Czechoslovakia | 99.7 /100 | #73 | Exceptional 5.2% |
| Immigrants | Romania | 99.7 /100 | #74 | Exceptional 5.2% |
| Immigrants | Moldova | 99.6 /100 | #75 | Exceptional 5.2% |
| Immigrants | Guyana | 99.6 /100 | #76 | Exceptional 5.2% |
| Immigrants | Kazakhstan | 99.6 /100 | #77 | Exceptional 5.2% |
| Immigrants | Cuba | 99.6 /100 | #78 | Exceptional 5.2% |
| Afghans | 99.6 /100 | #79 | Exceptional 5.2% |
| Sri Lankans | 99.6 /100 | #80 | Exceptional 5.2% |
| Native Hawaiians | 99.6 /100 | #81 | Exceptional 5.2% |
| Immigrants | Sweden | 99.5 /100 | #82 | Exceptional 5.2% |
| Immigrants | France | 99.5 /100 | #83 | Exceptional 5.2% |
| Immigrants | Nicaragua | 99.5 /100 | #84 | Exceptional 5.2% |
| Bulgarians | 99.4 /100 | #85 | Exceptional 5.2% |
| Immigrants | St. Vincent and the Grenadines | 99.4 /100 | #86 | Exceptional 5.2% |
Demographics Similar to Egyptians by Disability Age 5 to 17
In terms of disability age 5 to 17, the demographic groups most similar to Egyptians are Immigrants from Russia (5.0%, a difference of 0.040%), Tongan (5.0%, a difference of 0.070%), Assyrian/Chaldean/Syriac (5.0%, a difference of 0.14%), Vietnamese (5.1%, a difference of 0.27%), and Immigrants from Sri Lanka (5.0%, a difference of 0.42%).
| Demographics | Rating | Rank | Disability Age 5 to 17 |
| Immigrants | Belarus | 100.0 /100 | #37 | Exceptional 5.0% |
| Immigrants | Philippines | 100.0 /100 | #38 | Exceptional 5.0% |
| Immigrants | Argentina | 100.0 /100 | #39 | Exceptional 5.0% |
| Okinawans | 100.0 /100 | #40 | Exceptional 5.0% |
| Immigrants | Australia | 100.0 /100 | #41 | Exceptional 5.0% |
| Immigrants | Sri Lanka | 100.0 /100 | #42 | Exceptional 5.0% |
| Immigrants | Russia | 100.0 /100 | #43 | Exceptional 5.0% |
| Egyptians | 100.0 /100 | #44 | Exceptional 5.0% |
| Tongans | 100.0 /100 | #45 | Exceptional 5.0% |
| Assyrians/Chaldeans/Syriacs | 100.0 /100 | #46 | Exceptional 5.0% |
| Vietnamese | 100.0 /100 | #47 | Exceptional 5.1% |
| Koreans | 100.0 /100 | #48 | Exceptional 5.1% |
| Immigrants | Western Asia | 100.0 /100 | #49 | Exceptional 5.1% |
| Argentineans | 99.9 /100 | #50 | Exceptional 5.1% |
| Turks | 99.9 /100 | #51 | Exceptional 5.1% |