Afghan vs Immigrants from Latvia Disability Age 5 to 17
COMPARE
Afghan
Immigrants from Latvia
Disability Age 5 to 17
Disability Age 5 to 17 Comparison
Afghans
Immigrants from Latvia
5.2%
DISABILITY AGE 5 TO 17
99.6/ 100
METRIC RATING
79th/ 347
METRIC RANK
5.3%
DISABILITY AGE 5 TO 17
97.9/ 100
METRIC RATING
112th/ 347
METRIC RANK
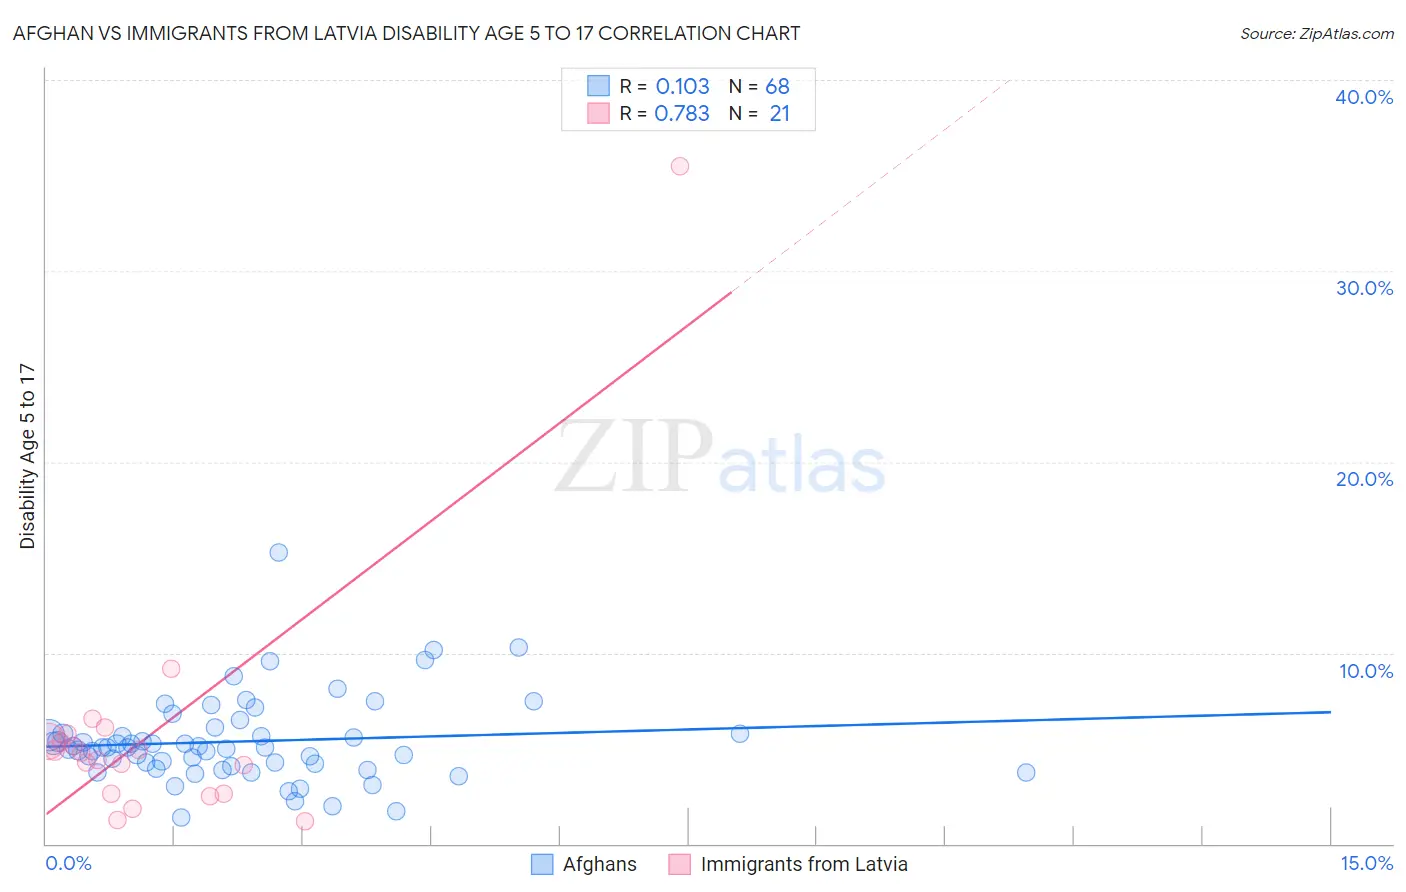
Afghan vs Immigrants from Latvia Disability Age 5 to 17 Correlation Chart
The statistical analysis conducted on geographies consisting of 148,469,527 people shows a poor positive correlation between the proportion of Afghans and percentage of population with a disability between the ages 5 and 17 in the United States with a correlation coefficient (R) of 0.103 and weighted average of 5.2%. Similarly, the statistical analysis conducted on geographies consisting of 113,351,045 people shows a strong positive correlation between the proportion of Immigrants from Latvia and percentage of population with a disability between the ages 5 and 17 in the United States with a correlation coefficient (R) of 0.783 and weighted average of 5.3%, a difference of 2.1%.
Disability Age 5 to 17 Correlation Summary
| Measurement | Afghan | Immigrants from Latvia |
| Minimum | 1.4% | 1.2% |
| Maximum | 15.2% | 35.5% |
| Range | 13.9% | 34.4% |
| Mean | 5.4% | 5.8% |
| Median | 5.1% | 4.8% |
| Interquartile 25% (IQ1) | 4.1% | 2.6% |
| Interquartile 75% (IQ3) | 5.8% | 5.6% |
| Interquartile Range (IQR) | 1.6% | 2.9% |
| Standard Deviation (Sample) | 2.2% | 7.1% |
| Standard Deviation (Population) | 2.2% | 6.9% |
Similar Demographics by Disability Age 5 to 17
Demographics Similar to Afghans by Disability Age 5 to 17
In terms of disability age 5 to 17, the demographic groups most similar to Afghans are Sri Lankan (5.2%, a difference of 0.020%), Immigrants from Cuba (5.2%, a difference of 0.040%), Immigrants from Kazakhstan (5.2%, a difference of 0.050%), Immigrants from Guyana (5.2%, a difference of 0.070%), and Native Hawaiian (5.2%, a difference of 0.070%).
| Demographics | Rating | Rank | Disability Age 5 to 17 |
| Immigrants | Vietnam | 99.7 /100 | #72 | Exceptional 5.2% |
| Immigrants | Czechoslovakia | 99.7 /100 | #73 | Exceptional 5.2% |
| Immigrants | Romania | 99.7 /100 | #74 | Exceptional 5.2% |
| Immigrants | Moldova | 99.6 /100 | #75 | Exceptional 5.2% |
| Immigrants | Guyana | 99.6 /100 | #76 | Exceptional 5.2% |
| Immigrants | Kazakhstan | 99.6 /100 | #77 | Exceptional 5.2% |
| Immigrants | Cuba | 99.6 /100 | #78 | Exceptional 5.2% |
| Afghans | 99.6 /100 | #79 | Exceptional 5.2% |
| Sri Lankans | 99.6 /100 | #80 | Exceptional 5.2% |
| Native Hawaiians | 99.6 /100 | #81 | Exceptional 5.2% |
| Immigrants | Sweden | 99.5 /100 | #82 | Exceptional 5.2% |
| Immigrants | France | 99.5 /100 | #83 | Exceptional 5.2% |
| Immigrants | Nicaragua | 99.5 /100 | #84 | Exceptional 5.2% |
| Bulgarians | 99.4 /100 | #85 | Exceptional 5.2% |
| Immigrants | St. Vincent and the Grenadines | 99.4 /100 | #86 | Exceptional 5.2% |
Demographics Similar to Immigrants from Latvia by Disability Age 5 to 17
In terms of disability age 5 to 17, the demographic groups most similar to Immigrants from Latvia are Ethiopian (5.3%, a difference of 0.020%), Aleut (5.3%, a difference of 0.040%), Immigrants from Eritrea (5.3%, a difference of 0.050%), Immigrants from Northern Europe (5.3%, a difference of 0.070%), and Cuban (5.3%, a difference of 0.080%).
| Demographics | Rating | Rank | Disability Age 5 to 17 |
| Immigrants | Italy | 98.4 /100 | #105 | Exceptional 5.3% |
| Immigrants | Yemen | 98.2 /100 | #106 | Exceptional 5.3% |
| Russians | 98.2 /100 | #107 | Exceptional 5.3% |
| Immigrants | South Africa | 98.1 /100 | #108 | Exceptional 5.3% |
| Immigrants | Northern Africa | 98.1 /100 | #109 | Exceptional 5.3% |
| Immigrants | Eritrea | 98.0 /100 | #110 | Exceptional 5.3% |
| Ethiopians | 97.9 /100 | #111 | Exceptional 5.3% |
| Immigrants | Latvia | 97.9 /100 | #112 | Exceptional 5.3% |
| Aleuts | 97.8 /100 | #113 | Exceptional 5.3% |
| Immigrants | Northern Europe | 97.8 /100 | #114 | Exceptional 5.3% |
| Cubans | 97.8 /100 | #115 | Exceptional 5.3% |
| Cypriots | 97.7 /100 | #116 | Exceptional 5.3% |
| Immigrants | Afghanistan | 97.4 /100 | #117 | Exceptional 5.3% |
| South Americans | 97.1 /100 | #118 | Exceptional 5.4% |
| Immigrants | South America | 97.1 /100 | #119 | Exceptional 5.4% |