Afghan vs Japanese Disability Age 5 to 17
COMPARE
Afghan
Japanese
Disability Age 5 to 17
Disability Age 5 to 17 Comparison
Afghans
Japanese
5.2%
DISABILITY AGE 5 TO 17
99.6/ 100
METRIC RATING
79th/ 347
METRIC RANK
6.1%
DISABILITY AGE 5 TO 17
0.1/ 100
METRIC RATING
276th/ 347
METRIC RANK
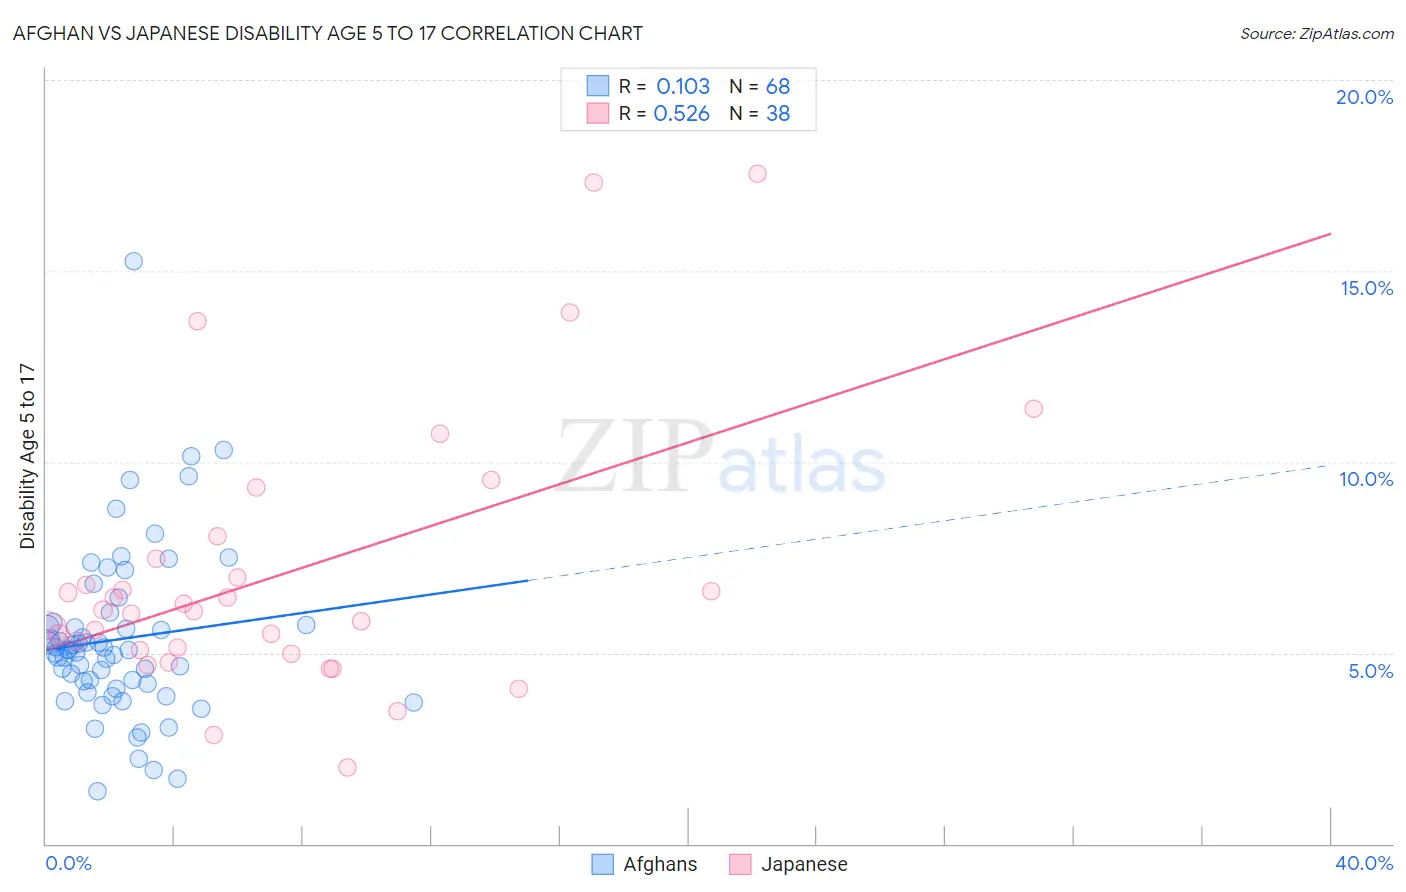
Afghan vs Japanese Disability Age 5 to 17 Correlation Chart
The statistical analysis conducted on geographies consisting of 148,469,527 people shows a poor positive correlation between the proportion of Afghans and percentage of population with a disability between the ages 5 and 17 in the United States with a correlation coefficient (R) of 0.103 and weighted average of 5.2%. Similarly, the statistical analysis conducted on geographies consisting of 248,392,506 people shows a substantial positive correlation between the proportion of Japanese and percentage of population with a disability between the ages 5 and 17 in the United States with a correlation coefficient (R) of 0.526 and weighted average of 6.1%, a difference of 15.9%.
Disability Age 5 to 17 Correlation Summary
| Measurement | Afghan | Japanese |
| Minimum | 1.4% | 2.0% |
| Maximum | 15.2% | 17.6% |
| Range | 13.9% | 15.6% |
| Mean | 5.4% | 7.1% |
| Median | 5.1% | 6.1% |
| Interquartile 25% (IQ1) | 4.1% | 5.1% |
| Interquartile 75% (IQ3) | 5.8% | 7.5% |
| Interquartile Range (IQR) | 1.6% | 2.4% |
| Standard Deviation (Sample) | 2.2% | 3.6% |
| Standard Deviation (Population) | 2.2% | 3.5% |
Similar Demographics by Disability Age 5 to 17
Demographics Similar to Afghans by Disability Age 5 to 17
In terms of disability age 5 to 17, the demographic groups most similar to Afghans are Sri Lankan (5.2%, a difference of 0.020%), Immigrants from Cuba (5.2%, a difference of 0.040%), Immigrants from Kazakhstan (5.2%, a difference of 0.050%), Immigrants from Guyana (5.2%, a difference of 0.070%), and Native Hawaiian (5.2%, a difference of 0.070%).
| Demographics | Rating | Rank | Disability Age 5 to 17 |
| Immigrants | Vietnam | 99.7 /100 | #72 | Exceptional 5.2% |
| Immigrants | Czechoslovakia | 99.7 /100 | #73 | Exceptional 5.2% |
| Immigrants | Romania | 99.7 /100 | #74 | Exceptional 5.2% |
| Immigrants | Moldova | 99.6 /100 | #75 | Exceptional 5.2% |
| Immigrants | Guyana | 99.6 /100 | #76 | Exceptional 5.2% |
| Immigrants | Kazakhstan | 99.6 /100 | #77 | Exceptional 5.2% |
| Immigrants | Cuba | 99.6 /100 | #78 | Exceptional 5.2% |
| Afghans | 99.6 /100 | #79 | Exceptional 5.2% |
| Sri Lankans | 99.6 /100 | #80 | Exceptional 5.2% |
| Native Hawaiians | 99.6 /100 | #81 | Exceptional 5.2% |
| Immigrants | Sweden | 99.5 /100 | #82 | Exceptional 5.2% |
| Immigrants | France | 99.5 /100 | #83 | Exceptional 5.2% |
| Immigrants | Nicaragua | 99.5 /100 | #84 | Exceptional 5.2% |
| Bulgarians | 99.4 /100 | #85 | Exceptional 5.2% |
| Immigrants | St. Vincent and the Grenadines | 99.4 /100 | #86 | Exceptional 5.2% |
Demographics Similar to Japanese by Disability Age 5 to 17
In terms of disability age 5 to 17, the demographic groups most similar to Japanese are Dutch (6.0%, a difference of 0.11%), Cheyenne (6.0%, a difference of 0.21%), Alaska Native (6.0%, a difference of 0.33%), Finnish (6.0%, a difference of 0.38%), and Immigrants from Zaire (6.0%, a difference of 0.40%).
| Demographics | Rating | Rank | Disability Age 5 to 17 |
| Liberians | 0.4 /100 | #269 | Tragic 6.0% |
| Immigrants | Somalia | 0.4 /100 | #270 | Tragic 6.0% |
| Immigrants | Zaire | 0.2 /100 | #271 | Tragic 6.0% |
| Finns | 0.2 /100 | #272 | Tragic 6.0% |
| Alaska Natives | 0.2 /100 | #273 | Tragic 6.0% |
| Cheyenne | 0.2 /100 | #274 | Tragic 6.0% |
| Dutch | 0.2 /100 | #275 | Tragic 6.0% |
| Japanese | 0.1 /100 | #276 | Tragic 6.1% |
| Puget Sound Salish | 0.1 /100 | #277 | Tragic 6.1% |
| Immigrants | Liberia | 0.1 /100 | #278 | Tragic 6.1% |
| Immigrants | Jamaica | 0.1 /100 | #279 | Tragic 6.1% |
| Portuguese | 0.1 /100 | #280 | Tragic 6.1% |
| Scottish | 0.0 /100 | #281 | Tragic 6.1% |
| Germans | 0.0 /100 | #282 | Tragic 6.1% |
| Ugandans | 0.0 /100 | #283 | Tragic 6.2% |