Zip Codes with the Highest Percentage of Scotch-Irish Population in Delaware

RELATED REPORTS & OPTIONS

Scotch-Irish
Population
Families and Households
Female Fertility
Female Fertility (Unmarried)
Race (Community Size)
Race (Percentage)
Ancestry (Community Size)
AfghanAfricanAlaska NativeAlaskan AthabascanAlbanianAleutAlsatianAmericanApacheArabArapahoArgentineanArmenianAssyrian / Chaldean / SyriacAustralianAustrianBahamianBangladeshiBarbadianBasqueBelgianBelizeanBermudanBhutaneseBlackfeetBolivianBrazilianBritishBritish West IndianBulgarianBurmeseCajunCambodianCanadianCape VerdeanCarpatho RusynCelticCentral AmericanCentral American IndianCherokeeCheyenneChickasawChileanChineseChippewaChoctawColombianColvilleComancheCosta RicanCreeCreekCroatianCrowCubanCypriotCzechCzechoslovakianDanishDelawareDominicanDutchDutch West IndianEastern EuropeanEcuadorianEgyptianEnglishEstonianEthiopianEuropeanFijianFilipinoFinnishFrenchFrench American IndianFrench CanadianGermanGerman RussianGhanaianGreekGuamanian / ChamorroGuatemalanGuyaneseHaitianHmongHonduranHopiHoumaHungarianIcelanderIndian (Asian)IndonesianInupiatIranianIraqiIrishIroquoisIsraeliItalianJamaicanJapaneseJordanianKenyanKiowaKoreanLaotianLatvianLebaneseLiberianLithuanianLumbeeLuxembourgerMacedonianMalaysianMalteseMarshalleseMenomineeMexicanMexican American IndianMongolianMoroccanNative HawaiianNavajoNepaleseNew ZealanderNicaraguanNigerianNorthern EuropeanNorwegianOkinawanOsageOttawaPaiutePakistaniPalestinianPanamanianParaguayanPennsylvania GermanPeruvianPimaPolishPortuguesePotawatomiPuebloPuerto RicanPuget Sound SalishRomanianRussianSalvadoranSamoanScandinavianScotch-IrishScottishSeminoleSenegaleseSerbianShoshoneSierra LeoneanSiouxSlavicSlovakSloveneSomaliSouth AfricanSouth AmericanSouth American IndianSoviet UnionSpaniardSpanishSpanish AmericanSpanish American IndianSri LankanSubsaharan AfricanSudaneseSwedishSwissSyrianTaiwaneseThaiTlingit-HaidaTohono O'OdhamTonganTrinidadian and TobagonianTsimshianTurkishU.S. Virgin IslanderUgandanUkrainianUruguayanUteVenezuelanVietnameseWelshWest IndianYakamaYaquiYugoslavianYumanYup'ikZimbabwean
Ancestry (Percentage)
AfghanAfricanAlaska NativeAlaskan AthabascanAlbanianAleutAlsatianAmericanApacheArabArapahoArgentineanArmenianAssyrian / Chaldean / SyriacAustralianAustrianBahamianBangladeshiBarbadianBasqueBelgianBelizeanBermudanBhutaneseBlackfeetBolivianBrazilianBritishBritish West IndianBulgarianBurmeseCajunCambodianCanadianCape VerdeanCarpatho RusynCelticCentral AmericanCentral American IndianCherokeeCheyenneChickasawChileanChineseChippewaChoctawColombianColvilleComancheCosta RicanCreeCreekCroatianCrowCubanCypriotCzechCzechoslovakianDanishDelawareDominicanDutchDutch West IndianEastern EuropeanEcuadorianEgyptianEnglishEstonianEthiopianEuropeanFijianFilipinoFinnishFrenchFrench American IndianFrench CanadianGermanGerman RussianGhanaianGreekGuamanian / ChamorroGuatemalanGuyaneseHaitianHmongHonduranHopiHoumaHungarianIcelanderIndian (Asian)IndonesianInupiatIranianIraqiIrishIroquoisIsraeliItalianJamaicanJapaneseJordanianKenyanKiowaKoreanLaotianLatvianLebaneseLiberianLithuanianLumbeeLuxembourgerMacedonianMalaysianMalteseMarshalleseMenomineeMexicanMexican American IndianMongolianMoroccanNative HawaiianNavajoNepaleseNew ZealanderNicaraguanNigerianNorthern EuropeanNorwegianOkinawanOsageOttawaPaiutePakistaniPalestinianPanamanianParaguayanPennsylvania GermanPeruvianPimaPolishPortuguesePotawatomiPuebloPuerto RicanPuget Sound SalishRomanianRussianSalvadoranSamoanScandinavianScotch-IrishScottishSeminoleSenegaleseSerbianShoshoneSierra LeoneanSiouxSlavicSlovakSloveneSomaliSouth AfricanSouth AmericanSouth American IndianSoviet UnionSpaniardSpanishSpanish AmericanSpanish American IndianSri LankanSubsaharan AfricanSudaneseSwedishSwissSyrianTaiwaneseThaiTlingit-HaidaTohono O'OdhamTonganTrinidadian and TobagonianTsimshianTurkishU.S. Virgin IslanderUgandanUkrainianUruguayanUteVenezuelanVietnameseWelshWest IndianYakamaYaquiYugoslavianYumanYup'ikZimbabwean
Immigrant Origin (Total)
AfghanistanAfricaAlbaniaArgentinaArmeniaAsiaAustraliaAustriaAzoresBahamasBangladeshBarbadosBelarusBelgiumBelizeBoliviaBosnia and HerzegovinaBrazilBulgariaBurma / MyanmarCabo VerdeCambodiaCameroonCanadaCaribbeanCentral AmericaChileChinaColombiaCongoCosta RicaCroatiaCubaCzechoslovakiaDenmarkDominicaDominican RepublicEastern AfricaEastern AsiaEastern EuropeEcuadorEgyptEl SalvadorEnglandEritreaEthiopiaEuropeFijiFranceGermanyGhanaGreeceGrenadaGuatemalaGuyanaHaitiHondurasHong KongHungaryIndiaIndonesiaIranIraqIrelandIsraelItalyJamaicaJapanJordanKazakhstanKenyaKoreaKuwaitLaosLatin AmericaLatviaLebanonLiberiaLithuaniaMalaysiaMexicoMicronesiaMiddle AfricaMoldovaMoroccoNepalNetherlandsNicaraguaNigeriaNorth MacedoniaNorthern AfricaNorthern EuropeNorwayOceaniaPakistanPanamaPeruPhilippinesPolandPortugalRomaniaRussiaSaudi ArabiaScotlandSenegalSerbiaSierra LeoneSingaporeSomaliaSouth AfricaSouth AmericaSouth Central AsiaSouth Eastern AsiaSouthern EuropeSpainSri LankaSt. Vincent and the GrenadinesSudanSwedenSwitzerlandSyriaTaiwanThailandTrinidad and TobagoTurkeyUgandaUkraineUruguayUzbekistanVenezuelaVietnamWest IndiesWestern AfricaWestern AsiaWestern EuropeYemenZaireZimbabwe
Immigrant Origin (Percentage)
AfghanistanAfricaAlbaniaArgentinaArmeniaAsiaAustraliaAustriaAzoresBahamasBangladeshBarbadosBelarusBelgiumBelizeBoliviaBosnia and HerzegovinaBrazilBulgariaBurma / MyanmarCabo VerdeCambodiaCameroonCanadaCaribbeanCentral AmericaChileChinaColombiaCongoCosta RicaCroatiaCubaCzechoslovakiaDenmarkDominicaDominican RepublicEastern AfricaEastern AsiaEastern EuropeEcuadorEgyptEl SalvadorEnglandEritreaEthiopiaEuropeFijiFranceGermanyGhanaGreeceGrenadaGuatemalaGuyanaHaitiHondurasHong KongHungaryIndiaIndonesiaIranIraqIrelandIsraelItalyJamaicaJapanJordanKazakhstanKenyaKoreaKuwaitLaosLatin AmericaLatviaLebanonLiberiaLithuaniaMalaysiaMexicoMicronesiaMiddle AfricaMoldovaMoroccoNepalNetherlandsNicaraguaNigeriaNorth MacedoniaNorthern AfricaNorthern EuropeNorwayOceaniaPakistanPanamaPeruPhilippinesPolandPortugalRomaniaRussiaSaudi ArabiaScotlandSenegalSerbiaSierra LeoneSingaporeSomaliaSouth AfricaSouth AmericaSouth Central AsiaSouth Eastern AsiaSouthern EuropeSpainSri LankaSt. Vincent and the GrenadinesSudanSwedenSwitzerlandSyriaTaiwanThailandTrinidad and TobagoTurkeyUgandaUkraineUruguayUzbekistanVenezuelaVietnamWest IndiesWestern AfricaWestern AsiaWestern EuropeYemenZaireZimbabwe
Income
Income (Families)
Income (Households)
Poverty
Poverty (Families)
Unemployment
Employment Occupations
Employment Industries
Employer Class
Commute Time
Commute Means
School Enrollment
Education by Degree Field
Occupancy
Finances
Physical Characteristics
Delaware
Compare Zip Codes
Comparison Subject

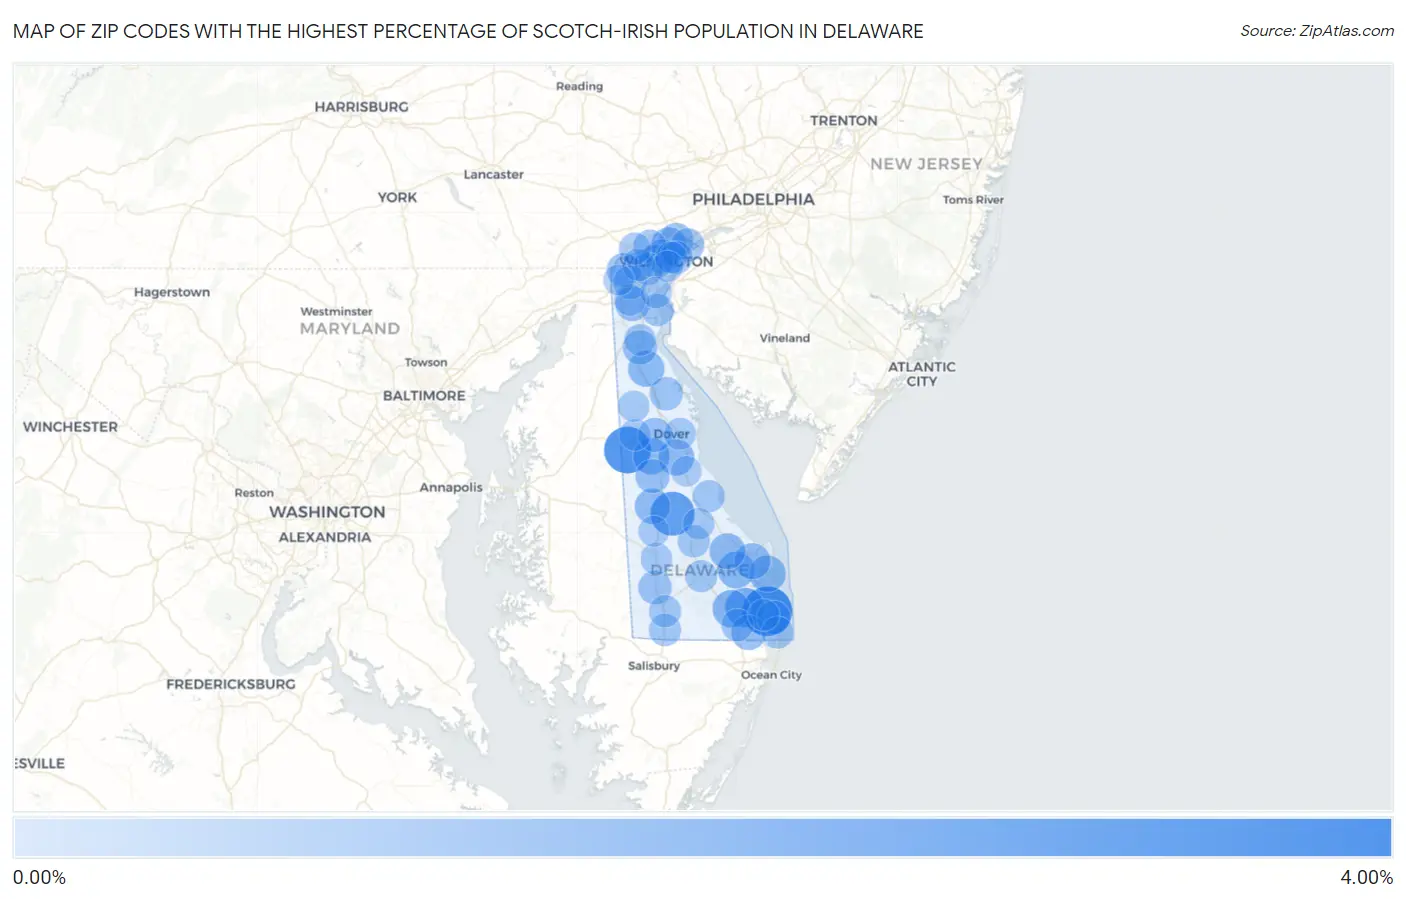
Map of Zip Codes with the Highest Percentage of Scotch-Irish Population in Delaware

0.00%
4.00%
Zip Codes with the Highest Percentage of Scotch-Irish Population in Delaware Map

Zip Codes with the Highest Percentage of Scotch-Irish Population in Delaware

Zip Code Scotch-Irish vs State vs National
1.199703.59%0.58%(+3.01)#10.82%(+2.77)#1,383
2.199643.06%0.58%(+2.48)#20.82%(+2.25)#1,876
3.199542.55%0.58%(+1.97)#30.82%(+1.73)#2,592
4.199391.68%0.58%(+1.10)#40.82%(+0.864)#4,992
5.199661.31%0.58%(+0.729)#50.82%(+0.492)#7,135
6.199511.20%0.58%(+0.615)#60.82%(+0.379)#7,938
7.199711.14%0.58%(+0.555)#70.82%(+0.319)#8,433
8.199341.12%0.58%(+0.538)#80.82%(+0.301)#8,589
9.197341.08%0.58%(+0.502)#90.82%(+0.266)#8,888
10.199581.06%0.58%(+0.479)#100.82%(+0.243)#9,115
11.199621.06%0.58%(+0.477)#110.82%(+0.241)#9,128
12.199681.02%0.58%(+0.437)#120.82%(+0.200)#9,557
13.199520.94%0.58%(+0.362)#130.82%(+0.125)#10,344
14.198030.90%0.58%(+0.324)#140.82%(+0.087)#10,776
15.199750.88%0.58%(+0.296)#150.82%(+0.059)#11,094
16.197010.75%0.58%(+0.171)#160.82%(-0.066)#12,679
17.197300.72%0.58%(+0.135)#170.82%(-0.101)#13,180
18.199040.70%0.58%(+0.119)#180.82%(-0.117)#13,390
19.198100.70%0.58%(+0.115)#190.82%(-0.122)#13,457
20.198060.68%0.58%(+0.100)#200.82%(-0.136)#13,666
21.199430.67%0.58%(+0.093)#210.82%(-0.143)#13,766
22.197110.66%0.58%(+0.080)#220.82%(-0.156)#13,960
23.199730.61%0.58%(+0.032)#230.82%(-0.204)#14,625
24.198050.61%0.58%(+0.025)#240.82%(-0.212)#14,752
25.199300.59%0.58%(+0.009)#250.82%(-0.227)#14,984
26.197130.56%0.58%(-0.017)#260.82%(-0.254)#15,390
27.199770.56%0.58%(-0.020)#270.82%(-0.257)#15,436
28.197030.56%0.58%(-0.026)#280.82%(-0.262)#15,515
29.198070.50%0.58%(-0.084)#290.82%(-0.321)#16,480
30.198090.47%0.58%(-0.111)#300.82%(-0.348)#16,899
31.198040.38%0.58%(-0.198)#310.82%(-0.434)#18,339
32.198080.38%0.58%(-0.201)#320.82%(-0.437)#18,399
33.199630.36%0.58%(-0.226)#330.82%(-0.463)#18,803
34.199410.35%0.58%(-0.228)#340.82%(-0.464)#18,825
35.197060.35%0.58%(-0.229)#350.82%(-0.465)#18,840
36.199400.35%0.58%(-0.229)#360.82%(-0.466)#18,857
37.199440.34%0.58%(-0.238)#370.82%(-0.474)#19,000
38.199450.34%0.58%(-0.241)#380.82%(-0.477)#19,060
39.197070.33%0.58%(-0.252)#390.82%(-0.489)#19,243
40.199470.33%0.58%(-0.253)#400.82%(-0.490)#19,266
41.199560.31%0.58%(-0.272)#410.82%(-0.508)#19,576
42.199010.28%0.58%(-0.300)#420.82%(-0.537)#20,036
43.199330.26%0.58%(-0.317)#430.82%(-0.554)#20,343
44.197090.25%0.58%(-0.328)#440.82%(-0.565)#20,527
45.198020.25%0.58%(-0.328)#450.82%(-0.565)#20,530
46.199670.24%0.58%(-0.337)#460.82%(-0.574)#20,688
47.199600.23%0.58%(-0.348)#470.82%(-0.585)#20,857
48.197200.20%0.58%(-0.380)#480.82%(-0.616)#21,430
49.199530.20%0.58%(-0.380)#490.82%(-0.617)#21,441
50.197020.20%0.58%(-0.383)#500.82%(-0.620)#21,509
51.199380.17%0.58%(-0.408)#510.82%(-0.645)#21,891
52.198010.13%0.58%(-0.448)#520.82%(-0.685)#22,550
53.199500.11%0.58%(-0.475)#530.82%(-0.712)#22,965
54.197170.082%0.58%(-0.500)#540.82%(-0.736)#23,282
55.199460.036%0.58%(-0.545)#550.82%(-0.781)#23,784

Common Questions

What are the Top 10 Zip Codes with the Highest Percentage of Scotch-Irish Population in Delaware?
Top 10 Zip Codes with the Highest Percentage of Scotch-Irish Population in Delaware are:
#1
3.59%
#2
3.06%
#3
2.55%
#4
1.68%
#5
1.31%
#6
1.20%
#7
1.14%
#8
1.12%
#9
1.08%
#10
1.06%
What zip code has the Highest Percentage of Scotch-Irish Population in Delaware?
19970 has the Highest Percentage of Scotch-Irish Population in Delaware with 3.59%.
What is the Percentage of Scotch-Irish Population in the State of Delaware?
Percentage of Scotch-Irish Population in Delaware is 0.58%.
What is the Percentage of Scotch-Irish Population in the United States?
Percentage of Scotch-Irish Population in the United States is 0.82%.