Zip Codes with the Highest Percentage of Not-for-profit Organizations in San Antonio, TX
RELATED REPORTS & OPTIONS
Not-for-profit Organizations
San Antonio
Compare Zip Codes
Map of Zip Codes with the Highest Percentage of Not-for-profit Organizations in San Antonio
2.4%
15.0%
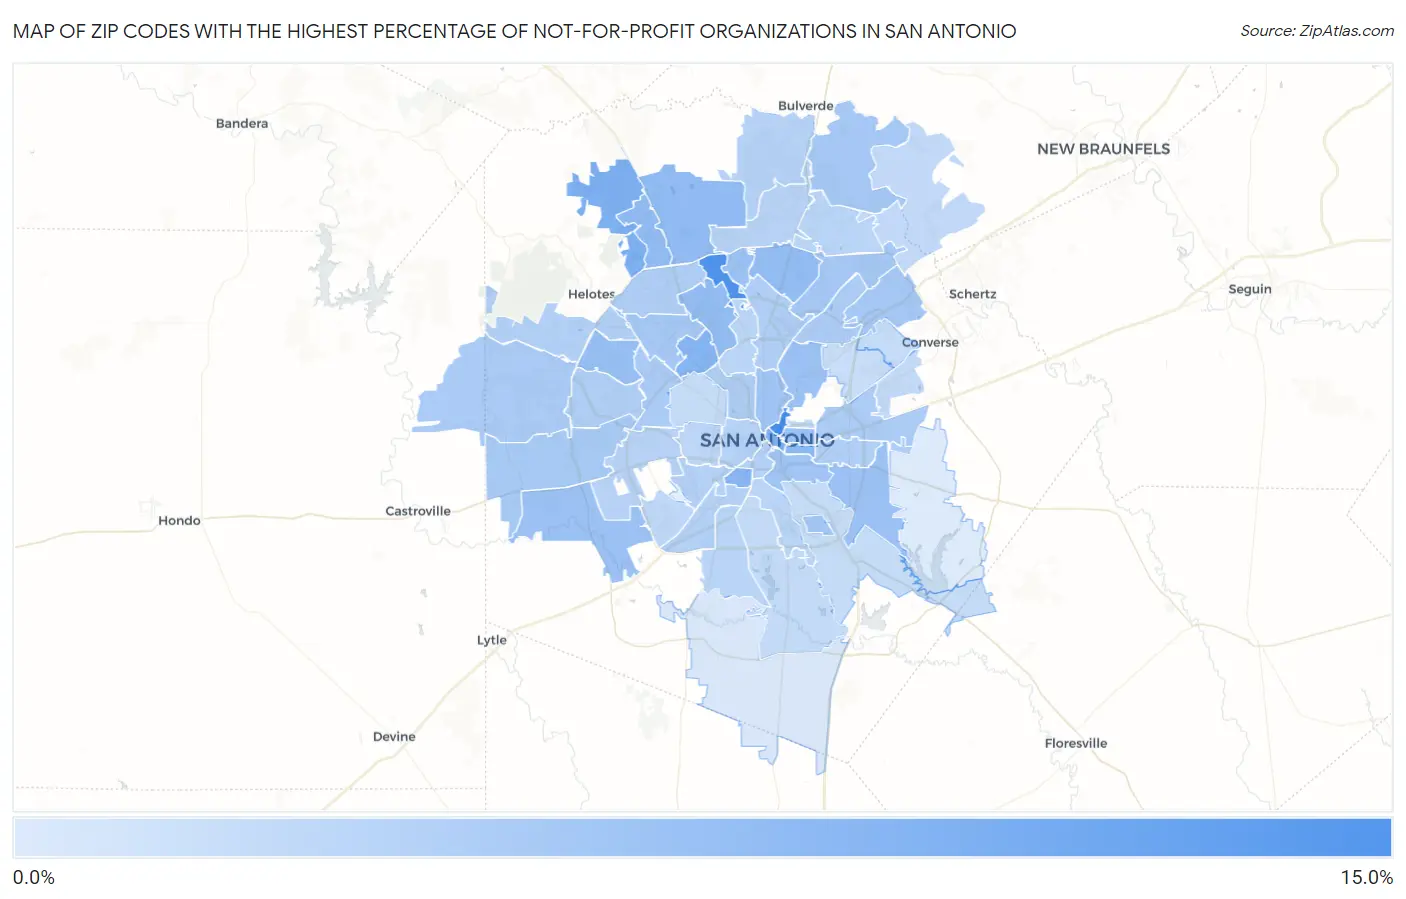
Zip Codes with the Highest Percentage of Not-for-profit Organizations in San Antonio, TX
| Zip Code | % Employed in Not-for-profit | vs State | vs National | |
| 1. | 78215 | 15.0% | 5.8%(+9.20)#72 | 8.4%(+6.52)#2,965 |
| 2. | 78231 | 14.3% | 5.8%(+8.57)#77 | 8.4%(+5.88)#3,357 |
| 3. | 78205 | 10.1% | 5.8%(+4.37)#177 | 8.4%(+1.68)#8,659 |
| 4. | 78255 | 10.1% | 5.8%(+4.31)#181 | 8.4%(+1.62)#8,770 |
| 5. | 78229 | 9.6% | 5.8%(+3.84)#196 | 8.4%(+1.16)#9,730 |
| 6. | 78225 | 9.3% | 5.8%(+3.55)#215 | 8.4%(+0.868)#10,335 |
| 7. | 78203 | 9.0% | 5.8%(+3.23)#238 | 8.4%(+0.544)#11,091 |
| 8. | 78257 | 8.5% | 5.8%(+2.79)#267 | 8.4%(+0.101)#12,166 |
| 9. | 78256 | 8.4% | 5.8%(+2.60)#285 | 8.4%(-0.080)#12,652 |
| 10. | 78230 | 8.3% | 5.8%(+2.58)#288 | 8.4%(-0.102)#12,707 |
| 11. | 78232 | 8.3% | 5.8%(+2.54)#293 | 8.4%(-0.143)#12,825 |
| 12. | 78250 | 8.1% | 5.8%(+2.33)#316 | 8.4%(-0.357)#13,395 |
| 13. | 78209 | 7.9% | 5.8%(+2.09)#343 | 8.4%(-0.592)#14,024 |
| 14. | 78222 | 7.6% | 5.8%(+1.87)#366 | 8.4%(-0.814)#14,675 |
| 15. | 78202 | 7.6% | 5.8%(+1.87)#367 | 8.4%(-0.818)#14,691 |
| 16. | 78248 | 7.6% | 5.8%(+1.85)#374 | 8.4%(-0.838)#14,744 |
| 17. | 78252 | 7.6% | 5.8%(+1.83)#375 | 8.4%(-0.853)#14,786 |
| 18. | 78212 | 7.2% | 5.8%(+1.48)#429 | 8.4%(-1.20)#15,873 |
| 19. | 78210 | 7.1% | 5.8%(+1.39)#446 | 8.4%(-1.30)#16,120 |
| 20. | 78235 | 7.0% | 5.8%(+1.27)#460 | 8.4%(-1.42)#16,497 |
| 21. | 78240 | 6.9% | 5.8%(+1.18)#473 | 8.4%(-1.50)#16,738 |
| 22. | 78233 | 6.9% | 5.8%(+1.10)#487 | 8.4%(-1.59)#17,003 |
| 23. | 78247 | 6.8% | 5.8%(+1.05)#493 | 8.4%(-1.64)#17,137 |
| 24. | 78261 | 6.8% | 5.8%(+1.03)#499 | 8.4%(-1.65)#17,180 |
| 25. | 78245 | 6.7% | 5.8%(+0.904)#528 | 8.4%(-1.78)#17,588 |
| 26. | 78253 | 6.5% | 5.8%(+0.709)#564 | 8.4%(-1.98)#18,121 |
| 27. | 78238 | 6.4% | 5.8%(+0.671)#572 | 8.4%(-2.01)#18,226 |
| 28. | 78219 | 6.4% | 5.8%(+0.612)#583 | 8.4%(-2.07)#18,403 |
| 29. | 78217 | 6.2% | 5.8%(+0.458)#616 | 8.4%(-2.23)#18,852 |
| 30. | 78249 | 6.1% | 5.8%(+0.328)#635 | 8.4%(-2.36)#19,218 |
| 31. | 78201 | 6.0% | 5.8%(+0.271)#643 | 8.4%(-2.41)#19,384 |
| 32. | 78251 | 6.0% | 5.8%(+0.220)#651 | 8.4%(-2.46)#19,530 |
| 33. | 78220 | 5.9% | 5.8%(+0.110)#675 | 8.4%(-2.58)#19,840 |
| 34. | 78216 | 5.8% | 5.8%(+0.073)#684 | 8.4%(-2.61)#19,959 |
| 35. | 78254 | 5.7% | 5.8%(-0.010)#702 | 8.4%(-2.69)#20,213 |
| 36. | 78204 | 5.7% | 5.8%(-0.078)#721 | 8.4%(-2.76)#20,445 |
| 37. | 78211 | 5.6% | 5.8%(-0.112)#732 | 8.4%(-2.80)#20,529 |
| 38. | 78207 | 5.6% | 5.8%(-0.177)#745 | 8.4%(-2.86)#20,711 |
| 39. | 78226 | 5.5% | 5.8%(-0.266)#768 | 8.4%(-2.95)#20,956 |
| 40. | 78260 | 5.4% | 5.8%(-0.310)#776 | 8.4%(-2.99)#21,086 |
| 41. | 78258 | 5.4% | 5.8%(-0.380)#793 | 8.4%(-3.06)#21,293 |
| 42. | 78227 | 5.3% | 5.8%(-0.502)#825 | 8.4%(-3.19)#21,648 |
| 43. | 78214 | 5.2% | 5.8%(-0.536)#832 | 8.4%(-3.22)#21,725 |
| 44. | 78224 | 5.2% | 5.8%(-0.538)#834 | 8.4%(-3.22)#21,740 |
| 45. | 78213 | 5.2% | 5.8%(-0.568)#841 | 8.4%(-3.25)#21,832 |
| 46. | 78259 | 5.2% | 5.8%(-0.592)#848 | 8.4%(-3.28)#21,886 |
| 47. | 78237 | 5.0% | 5.8%(-0.715)#867 | 8.4%(-3.40)#22,228 |
| 48. | 78242 | 4.7% | 5.8%(-1.07)#951 | 8.4%(-3.75)#23,098 |
| 49. | 78266 | 4.5% | 5.8%(-1.21)#990 | 8.4%(-3.89)#23,425 |
| 50. | 78208 | 4.5% | 5.8%(-1.27)#1,006 | 8.4%(-3.96)#23,592 |
| 51. | 78244 | 4.5% | 5.8%(-1.30)#1,017 | 8.4%(-3.99)#23,664 |
| 52. | 78221 | 4.4% | 5.8%(-1.31)#1,019 | 8.4%(-4.00)#23,683 |
| 53. | 78228 | 4.3% | 5.8%(-1.46)#1,059 | 8.4%(-4.14)#24,018 |
| 54. | 78223 | 4.3% | 5.8%(-1.48)#1,063 | 8.4%(-4.16)#24,061 |
| 55. | 78239 | 4.2% | 5.8%(-1.53)#1,080 | 8.4%(-4.21)#24,184 |
| 56. | 78218 | 4.0% | 5.8%(-1.72)#1,133 | 8.4%(-4.40)#24,605 |
| 57. | 78264 | 2.8% | 5.8%(-2.99)#1,405 | 8.4%(-5.68)#26,996 |
| 58. | 78263 | 2.4% | 5.8%(-3.39)#1,466 | 8.4%(-6.07)#27,543 |
1
Common Questions
What are the Top 10 Zip Codes with the Highest Percentage of Not-for-profit Organizations in San Antonio, TX?
Top 10 Zip Codes with the Highest Percentage of Not-for-profit Organizations in San Antonio, TX are:
What zip code has the Highest Percentage of Not-for-profit Organizations in San Antonio, TX?
78215 has the Highest Percentage of Not-for-profit Organizations in San Antonio, TX with 15.0%.
What is the Percentage of Not-for-profit Organizations in San Antonio, TX?
Percentage of Not-for-profit Organizations in San Antonio is 6.4%.
What is the Percentage of Not-for-profit Organizations in Texas?
Percentage of Not-for-profit Organizations in Texas is 5.8%.
What is the Percentage of Not-for-profit Organizations in the United States?
Percentage of Not-for-profit Organizations in the United States is 8.4%.