Zip Codes with the Highest Percentage of Population Employed in Health Diagnosing & Treating in San Antonio, TX
RELATED REPORTS & OPTIONS
Health Diagnosing & Treating
San Antonio
Compare Zip Codes
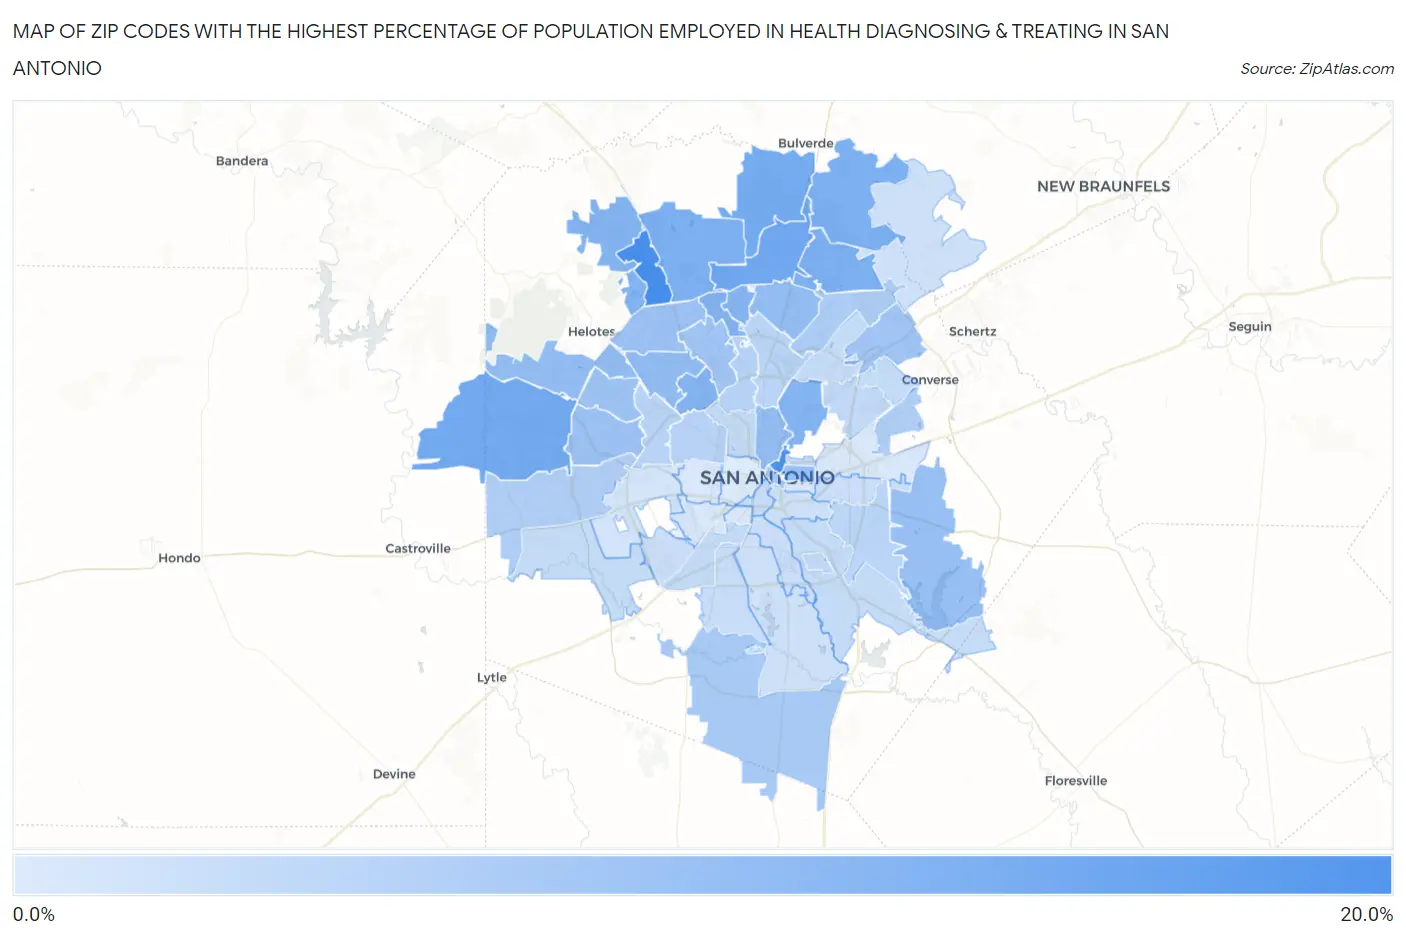
Map of Zip Codes with the Highest Percentage of Population Employed in Health Diagnosing & Treating in San Antonio
1.3%
16.2%
Zip Codes with the Highest Percentage of Population Employed in Health Diagnosing & Treating in San Antonio, TX
| Zip Code | % Employed | vs State | vs National | |
| 1. | 78256 | 16.2% | 5.5%(+10.7)#48 | 6.2%(+9.94)#931 |
| 2. | 78215 | 15.4% | 5.5%(+9.91)#51 | 6.2%(+9.19)#1,052 |
| 3. | 78258 | 11.8% | 5.5%(+6.25)#98 | 6.2%(+5.52)#2,340 |
| 4. | 78253 | 11.5% | 5.5%(+6.01)#103 | 6.2%(+5.28)#2,509 |
| 5. | 78260 | 11.3% | 5.5%(+5.77)#112 | 6.2%(+5.05)#2,665 |
| 6. | 78261 | 10.7% | 5.5%(+5.20)#131 | 6.2%(+4.47)#3,124 |
| 7. | 78259 | 10.7% | 5.5%(+5.19)#132 | 6.2%(+4.46)#3,134 |
| 8. | 78257 | 10.6% | 5.5%(+5.12)#136 | 6.2%(+4.39)#3,185 |
| 9. | 78209 | 10.1% | 5.5%(+4.57)#156 | 6.2%(+3.84)#3,783 |
| 10. | 78231 | 10.1% | 5.5%(+4.53)#160 | 6.2%(+3.81)#3,825 |
| 11. | 78229 | 9.9% | 5.5%(+4.41)#169 | 6.2%(+3.68)#3,974 |
| 12. | 78255 | 9.9% | 5.5%(+4.35)#171 | 6.2%(+3.63)#4,029 |
| 13. | 78248 | 9.7% | 5.5%(+4.14)#184 | 6.2%(+3.42)#4,306 |
| 14. | 78240 | 8.6% | 5.5%(+3.13)#245 | 6.2%(+2.40)#6,035 |
| 15. | 78232 | 8.3% | 5.5%(+2.82)#272 | 6.2%(+2.09)#6,659 |
| 16. | 78212 | 8.3% | 5.5%(+2.79)#278 | 6.2%(+2.06)#6,749 |
| 17. | 78254 | 8.3% | 5.5%(+2.75)#282 | 6.2%(+2.02)#6,854 |
| 18. | 78202 | 8.0% | 5.5%(+2.47)#321 | 6.2%(+1.75)#7,519 |
| 19. | 78263 | 7.9% | 5.5%(+2.38)#333 | 6.2%(+1.65)#7,762 |
| 20. | 78249 | 7.7% | 5.5%(+2.17)#359 | 6.2%(+1.44)#8,298 |
| 21. | 78251 | 7.5% | 5.5%(+1.98)#381 | 6.2%(+1.25)#8,821 |
| 22. | 78250 | 7.2% | 5.5%(+1.66)#424 | 6.2%(+0.930)#9,803 |
| 23. | 78233 | 7.1% | 5.5%(+1.54)#438 | 6.2%(+0.810)#10,176 |
| 24. | 78230 | 6.9% | 5.5%(+1.39)#452 | 6.2%(+0.663)#10,646 |
| 25. | 78205 | 6.4% | 5.5%(+0.832)#533 | 6.2%(+0.106)#12,564 |
| 26. | 78264 | 6.3% | 5.5%(+0.810)#536 | 6.2%(+0.084)#12,667 |
| 27. | 78247 | 5.9% | 5.5%(+0.391)#614 | 6.2%(-0.335)#14,184 |
| 28. | 78245 | 5.8% | 5.5%(+0.236)#645 | 6.2%(-0.490)#14,779 |
| 29. | 78244 | 5.7% | 5.5%(+0.169)#660 | 6.2%(-0.557)#15,034 |
| 30. | 78213 | 4.9% | 5.5%(-0.592)#842 | 6.2%(-1.32)#17,982 |
| 31. | 78228 | 4.8% | 5.5%(-0.725)#874 | 6.2%(-1.45)#18,518 |
| 32. | 78238 | 4.7% | 5.5%(-0.797)#891 | 6.2%(-1.52)#18,778 |
| 33. | 78222 | 4.6% | 5.5%(-0.931)#923 | 6.2%(-1.66)#19,304 |
| 34. | 78216 | 4.5% | 5.5%(-1.04)#955 | 6.2%(-1.76)#19,705 |
| 35. | 78235 | 4.0% | 5.5%(-1.55)#1,072 | 6.2%(-2.28)#21,453 |
| 36. | 78218 | 3.9% | 5.5%(-1.57)#1,080 | 6.2%(-2.30)#21,523 |
| 37. | 78211 | 3.7% | 5.5%(-1.80)#1,129 | 6.2%(-2.53)#22,239 |
| 38. | 78208 | 3.5% | 5.5%(-1.98)#1,169 | 6.2%(-2.71)#22,812 |
| 39. | 78217 | 3.5% | 5.5%(-2.03)#1,177 | 6.2%(-2.75)#22,933 |
| 40. | 78201 | 3.5% | 5.5%(-2.06)#1,184 | 6.2%(-2.79)#23,024 |
| 41. | 78239 | 3.5% | 5.5%(-2.07)#1,186 | 6.2%(-2.79)#23,039 |
| 42. | 78204 | 3.4% | 5.5%(-2.10)#1,196 | 6.2%(-2.83)#23,149 |
| 43. | 78252 | 3.4% | 5.5%(-2.10)#1,197 | 6.2%(-2.83)#23,152 |
| 44. | 78223 | 3.4% | 5.5%(-2.15)#1,205 | 6.2%(-2.87)#23,261 |
| 45. | 78224 | 3.3% | 5.5%(-2.22)#1,222 | 6.2%(-2.94)#23,478 |
| 46. | 78214 | 3.1% | 5.5%(-2.38)#1,265 | 6.2%(-3.11)#23,953 |
| 47. | 78242 | 3.1% | 5.5%(-2.41)#1,275 | 6.2%(-3.13)#24,017 |
| 48. | 78220 | 3.0% | 5.5%(-2.48)#1,289 | 6.2%(-3.20)#24,205 |
| 49. | 78210 | 2.7% | 5.5%(-2.86)#1,352 | 6.2%(-3.58)#25,136 |
| 50. | 78221 | 2.5% | 5.5%(-2.99)#1,380 | 6.2%(-3.71)#25,456 |
| 51. | 78266 | 2.5% | 5.5%(-3.01)#1,386 | 6.2%(-3.73)#25,489 |
| 52. | 78227 | 2.1% | 5.5%(-3.39)#1,442 | 6.2%(-4.11)#26,228 |
| 53. | 78225 | 1.8% | 5.5%(-3.69)#1,506 | 6.2%(-4.41)#26,751 |
| 54. | 78226 | 1.8% | 5.5%(-3.69)#1,507 | 6.2%(-4.41)#26,752 |
| 55. | 78219 | 1.8% | 5.5%(-3.72)#1,513 | 6.2%(-4.45)#26,807 |
| 56. | 78203 | 1.8% | 5.5%(-3.72)#1,514 | 6.2%(-4.45)#26,808 |
| 57. | 78237 | 1.6% | 5.5%(-3.91)#1,539 | 6.2%(-4.64)#27,074 |
| 58. | 78207 | 1.3% | 5.5%(-4.21)#1,564 | 6.2%(-4.94)#27,453 |
1
Common Questions
What are the Top 10 Zip Codes with the Highest Percentage of Population Employed in Health Diagnosing & Treating in San Antonio, TX?
Top 10 Zip Codes with the Highest Percentage of Population Employed in Health Diagnosing & Treating in San Antonio, TX are:
What zip code has the Highest Percentage of Population Employed in Health Diagnosing & Treating in San Antonio, TX?
78256 has the Highest Percentage of Population Employed in Health Diagnosing & Treating in San Antonio, TX with 16.2%.
What is the Percentage of Population Employed in Health Diagnosing & Treating in San Antonio, TX?
Percentage of Population Employed in Health Diagnosing & Treating in San Antonio is 5.9%.
What is the Percentage of Population Employed in Health Diagnosing & Treating in Texas?
Percentage of Population Employed in Health Diagnosing & Treating in Texas is 5.5%.
What is the Percentage of Population Employed in Health Diagnosing & Treating in the United States?
Percentage of Population Employed in Health Diagnosing & Treating in the United States is 6.2%.