Zip Codes with the Highest Percentage of Population Employed in Legal Services & Support in San Antonio, TX

RELATED REPORTS & OPTIONS

Legal Services & Support
Population
Families and Households
Female Fertility
Female Fertility (Unmarried)
Race (Community Size)
Race (Percentage)
Ancestry (Community Size)
AfghanAfricanAlbanianAleutAlsatianAmericanApacheArabArgentineanArmenianAustralianAustrianBahamianBangladeshiBarbadianBasqueBelgianBelizeanBhutaneseBlackfeetBolivianBrazilianBritishBritish West IndianBulgarianBurmeseCajunCambodianCanadianCape VerdeanCelticCentral AmericanCentral American IndianCherokeeCheyenneChickasawChileanChineseChippewaChoctawColombianComancheCosta RicanCreekCroatianCubanCzechCzechoslovakianDanishDelawareDominicanDutchDutch West IndianEastern EuropeanEcuadorianEgyptianEnglishEstonianEthiopianEuropeanFilipinoFinnishFrenchFrench American IndianFrench CanadianGermanGerman RussianGhanaianGreekGuamanian / ChamorroGuatemalanGuyaneseHaitianHonduranHopiHungarianIcelanderIndian (Asian)IndonesianInupiatIranianIraqiIrishIroquoisIsraeliItalianJamaicanJapaneseJordanianKenyanKoreanLaotianLatvianLebaneseLiberianLithuanianLumbeeLuxembourgerMacedonianMalaysianMexicanMexican American IndianMongolianMoroccanNative HawaiianNavajoNew ZealanderNicaraguanNigerianNorthern EuropeanNorwegianOkinawanOsageOttawaPakistaniPalestinianPanamanianParaguayanPennsylvania GermanPeruvianPimaPolishPortuguesePotawatomiPuebloPuerto RicanRomanianRussianSalvadoranSamoanScandinavianScotch-IrishScottishSeminoleSerbianShoshoneSierra LeoneanSiouxSlavicSlovakSloveneSomaliSouth AfricanSouth AmericanSouth American IndianSoviet UnionSpaniardSpanishSpanish AmericanSpanish American IndianSri LankanSubsaharan AfricanSudaneseSwedishSwissSyrianThaiTrinidadian and TobagonianTurkishU.S. Virgin IslanderUgandanUkrainianUruguayanUteVenezuelanVietnameseWelshWest IndianYaquiYugoslavian
Ancestry (Percentage)
AfghanAfricanAlbanianAleutAlsatianAmericanApacheArabArgentineanArmenianAustralianAustrianBahamianBangladeshiBarbadianBasqueBelgianBelizeanBhutaneseBlackfeetBolivianBrazilianBritishBritish West IndianBulgarianBurmeseCajunCambodianCanadianCape VerdeanCelticCentral AmericanCentral American IndianCherokeeCheyenneChickasawChileanChineseChippewaChoctawColombianComancheCosta RicanCreekCroatianCubanCzechCzechoslovakianDanishDelawareDominicanDutchDutch West IndianEastern EuropeanEcuadorianEgyptianEnglishEstonianEthiopianEuropeanFilipinoFinnishFrenchFrench American IndianFrench CanadianGermanGerman RussianGhanaianGreekGuamanian / ChamorroGuatemalanGuyaneseHaitianHonduranHopiHungarianIcelanderIndian (Asian)IndonesianInupiatIranianIraqiIrishIroquoisIsraeliItalianJamaicanJapaneseJordanianKenyanKoreanLaotianLatvianLebaneseLiberianLithuanianLumbeeLuxembourgerMacedonianMalaysianMexicanMexican American IndianMongolianMoroccanNative HawaiianNavajoNew ZealanderNicaraguanNigerianNorthern EuropeanNorwegianOkinawanOsageOttawaPakistaniPalestinianPanamanianParaguayanPennsylvania GermanPeruvianPimaPolishPortuguesePotawatomiPuebloPuerto RicanRomanianRussianSalvadoranSamoanScandinavianScotch-IrishScottishSeminoleSerbianShoshoneSierra LeoneanSiouxSlavicSlovakSloveneSomaliSouth AfricanSouth AmericanSouth American IndianSoviet UnionSpaniardSpanishSpanish AmericanSpanish American IndianSri LankanSubsaharan AfricanSudaneseSwedishSwissSyrianThaiTrinidadian and TobagonianTurkishU.S. Virgin IslanderUgandanUkrainianUruguayanUteVenezuelanVietnameseWelshWest IndianYaquiYugoslavian
Immigrant Origin (Total)
AfghanistanAfricaArgentinaAsiaAustraliaAustriaBangladeshBarbadosBelizeBoliviaBrazilBulgariaBurma / MyanmarCambodiaCameroonCanadaCaribbeanCentral AmericaChileChinaColombiaCongoCosta RicaCubaCzechoslovakiaDenmarkDominican RepublicEastern AfricaEastern AsiaEastern EuropeEcuadorEgyptEl SalvadorEnglandEritreaEthiopiaEuropeFijiFranceGermanyGhanaGreeceGuatemalaGuyanaHaitiHondurasHong KongHungaryIndiaIndonesiaIranIraqIrelandIsraelItalyJamaicaJapanJordanKazakhstanKenyaKoreaKuwaitLaosLatin AmericaLatviaLebanonLiberiaLithuaniaMalaysiaMexicoMiddle AfricaMoldovaMoroccoNepalNetherlandsNicaraguaNigeriaNorthern AfricaNorthern EuropeNorwayOceaniaPakistanPanamaPeruPhilippinesPolandPortugalRomaniaRussiaSaudi ArabiaScotlandSerbiaSierra LeoneSingaporeSomaliaSouth AfricaSouth AmericaSouth Central AsiaSouth Eastern AsiaSouthern EuropeSpainSri LankaSudanSwedenSwitzerlandSyriaTaiwanThailandTrinidad and TobagoTurkeyUgandaUkraineUruguayUzbekistanVenezuelaVietnamWestern AfricaWestern AsiaWestern EuropeZaireZimbabwe
Immigrant Origin (Percentage)
AfghanistanAfricaArgentinaAsiaAustraliaAustriaBangladeshBarbadosBelizeBoliviaBrazilBulgariaBurma / MyanmarCambodiaCameroonCanadaCaribbeanCentral AmericaChileChinaColombiaCongoCosta RicaCubaCzechoslovakiaDenmarkDominican RepublicEastern AfricaEastern AsiaEastern EuropeEcuadorEgyptEl SalvadorEnglandEritreaEthiopiaEuropeFijiFranceGermanyGhanaGreeceGuatemalaGuyanaHaitiHondurasHong KongHungaryIndiaIndonesiaIranIraqIrelandIsraelItalyJamaicaJapanJordanKazakhstanKenyaKoreaKuwaitLaosLatin AmericaLatviaLebanonLiberiaLithuaniaMalaysiaMexicoMiddle AfricaMoldovaMoroccoNepalNetherlandsNicaraguaNigeriaNorthern AfricaNorthern EuropeNorwayOceaniaPakistanPanamaPeruPhilippinesPolandPortugalRomaniaRussiaSaudi ArabiaScotlandSerbiaSierra LeoneSingaporeSomaliaSouth AfricaSouth AmericaSouth Central AsiaSouth Eastern AsiaSouthern EuropeSpainSri LankaSudanSwedenSwitzerlandSyriaTaiwanThailandTrinidad and TobagoTurkeyUgandaUkraineUruguayUzbekistanVenezuelaVietnamWestern AfricaWestern AsiaWestern EuropeZaireZimbabwe
Income
Income (Families)
Income (Households)
Poverty
Poverty (Families)
Unemployment
Employment Occupations
Employment Industries
Employer Class
Commute Time
Commute Means
School Enrollment
Education by Degree Field
Occupancy
Finances
Physical Characteristics
San Antonio
Compare Zip Codes
Comparison Subject

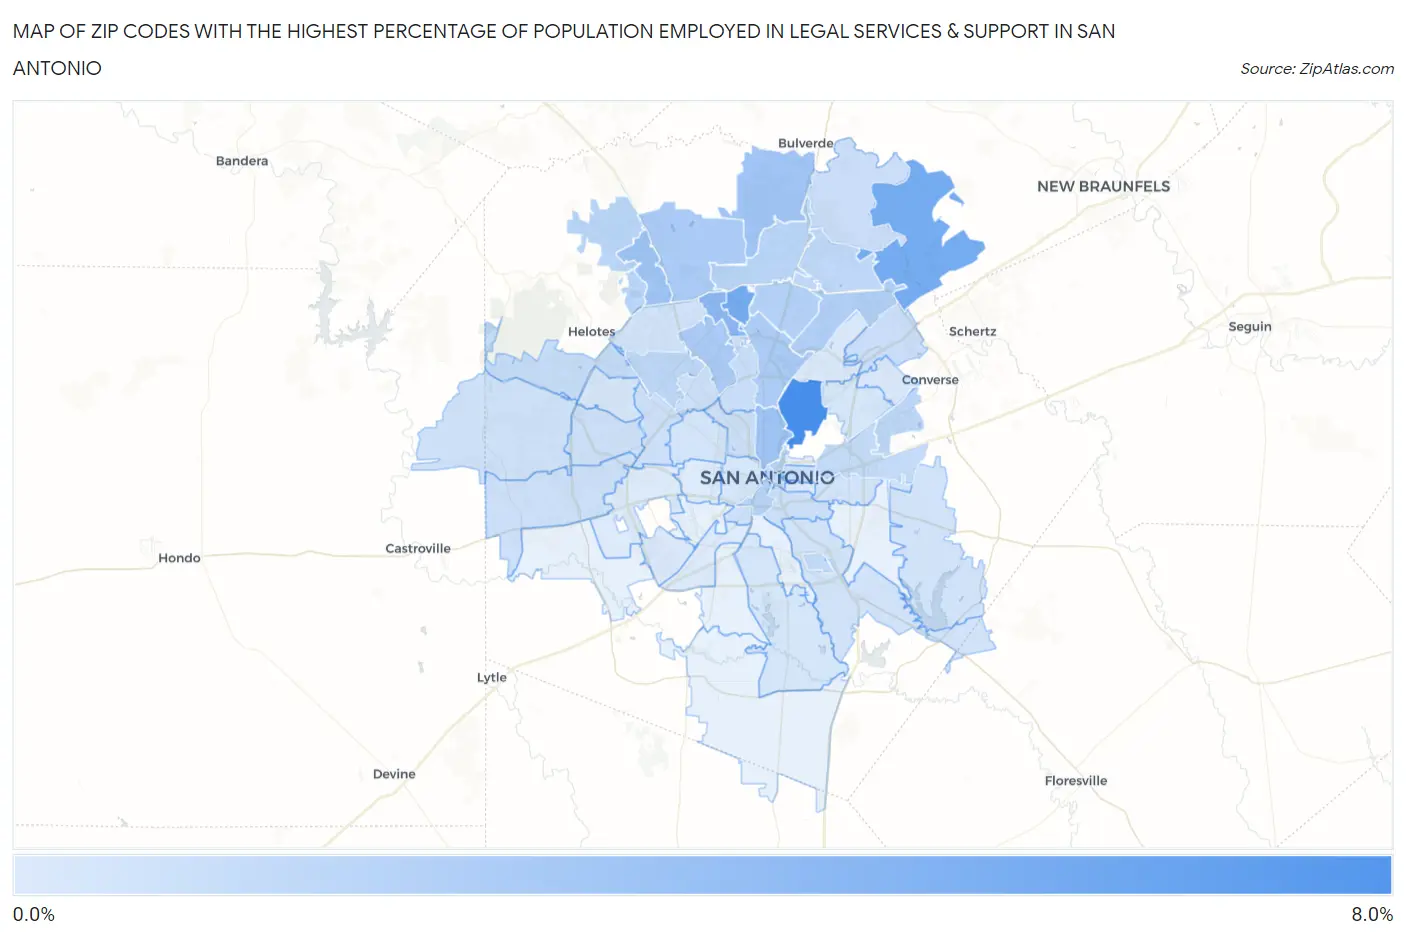
Map of Zip Codes with the Highest Percentage of Population Employed in Legal Services & Support in San Antonio

0.0%
8.0%
Zip Codes with the Highest Percentage of Population Employed in Legal Services & Support in San Antonio Map

Zip Codes with the Highest Percentage of Population Employed in Legal Services & Support in San Antonio, TX

Zip Code % Employed vs State vs National
1.782096.1%1.0%(+5.05)#231.2%(+4.88)#468
2.782484.2%1.0%(+3.18)#461.2%(+3.01)#1,022
3.782664.2%1.0%(+3.18)#471.2%(+3.00)#1,026
4.782313.3%1.0%(+2.27)#821.2%(+2.09)#1,593
5.782122.5%1.0%(+1.53)#1341.2%(+1.35)#2,458
6.782562.5%1.0%(+1.51)#1361.2%(+1.34)#2,482
7.782602.4%1.0%(+1.39)#1451.2%(+1.22)#2,683
8.782572.1%1.0%(+1.07)#1691.2%(+0.897)#3,266
9.782302.0%1.0%(+0.996)#1841.2%(+0.821)#3,475
10.782161.9%1.0%(+0.932)#1941.2%(+0.756)#3,632
11.782471.8%1.0%(+0.770)#2191.2%(+0.594)#4,059
12.782321.7%1.0%(+0.663)#2361.2%(+0.488)#4,416
13.782041.6%1.0%(+0.609)#2431.2%(+0.434)#4,617
14.782151.5%1.0%(+0.518)#2621.2%(+0.342)#4,931
15.782581.4%1.0%(+0.395)#2981.2%(+0.220)#5,460
16.782551.4%1.0%(+0.389)#3011.2%(+0.214)#5,492
17.782401.3%1.0%(+0.316)#3151.2%(+0.141)#5,812
18.782441.3%1.0%(+0.285)#3231.2%(+0.109)#5,969
19.782591.2%1.0%(+0.195)#3481.2%(+0.019)#6,480
20.782351.1%1.0%(+0.063)#4011.2%(-0.113)#7,359
21.782191.0%1.0%(+0.040)#4151.2%(-0.135)#7,500
22.782540.96%1.0%(-0.045)#4541.2%(-0.221)#8,103
23.782050.86%1.0%(-0.147)#5021.2%(-0.323)#8,923
24.782130.83%1.0%(-0.182)#5131.2%(-0.358)#9,227
25.782020.81%1.0%(-0.197)#5201.2%(-0.373)#9,346
26.782610.76%1.0%(-0.252)#5531.2%(-0.428)#9,861
27.782330.75%1.0%(-0.260)#5621.2%(-0.436)#9,946
28.782100.70%1.0%(-0.303)#5931.2%(-0.479)#10,357
29.782250.70%1.0%(-0.307)#5951.2%(-0.483)#10,391
30.782450.69%1.0%(-0.314)#6041.2%(-0.490)#10,470
31.782510.67%1.0%(-0.337)#6251.2%(-0.513)#10,723
32.782290.67%1.0%(-0.342)#6291.2%(-0.518)#10,766
33.782380.66%1.0%(-0.353)#6361.2%(-0.528)#10,880
34.782530.60%1.0%(-0.412)#6851.2%(-0.588)#11,507
35.782010.55%1.0%(-0.461)#7111.2%(-0.637)#12,089
36.782230.50%1.0%(-0.508)#7481.2%(-0.684)#12,637
37.782200.48%1.0%(-0.532)#7781.2%(-0.708)#12,940
38.782490.47%1.0%(-0.535)#7831.2%(-0.710)#12,966
39.782630.46%1.0%(-0.553)#7981.2%(-0.728)#13,200
40.782280.41%1.0%(-0.602)#8361.2%(-0.778)#13,782
41.782180.36%1.0%(-0.649)#8781.2%(-0.824)#14,339
42.782070.35%1.0%(-0.654)#8811.2%(-0.830)#14,404
43.782210.30%1.0%(-0.706)#9231.2%(-0.882)#15,015
44.782500.27%1.0%(-0.737)#9511.2%(-0.912)#15,374
45.782390.25%1.0%(-0.759)#9641.2%(-0.935)#15,643
46.782170.17%1.0%(-0.835)#1,0161.2%(-1.01)#16,461
47.782420.14%1.0%(-0.866)#1,0361.2%(-1.04)#16,769
48.782030.13%1.0%(-0.877)#1,0461.2%(-1.05)#16,858
49.782270.084%1.0%(-0.924)#1,0831.2%(-1.10)#17,236
50.782110.050%1.0%(-0.958)#1,1001.2%(-1.13)#17,426
51.782370.045%1.0%(-0.963)#1,1031.2%(-1.14)#17,447

Common Questions

What are the Top 10 Zip Codes with the Highest Percentage of Population Employed in Legal Services & Support in San Antonio, TX?
Top 10 Zip Codes with the Highest Percentage of Population Employed in Legal Services & Support in San Antonio, TX are:
#1
6.1%
#2
4.2%
#3
4.2%
#4
3.3%
#5
2.5%
#6
2.5%
#7
2.4%
#8
2.1%
#9
2.0%
#10
1.9%
What zip code has the Highest Percentage of Population Employed in Legal Services & Support in San Antonio, TX?
78209 has the Highest Percentage of Population Employed in Legal Services & Support in San Antonio, TX with 6.1%.
What is the Percentage of Population Employed in Legal Services & Support in San Antonio, TX?
Percentage of Population Employed in Legal Services & Support in San Antonio is 0.96%.
What is the Percentage of Population Employed in Legal Services & Support in Texas?
Percentage of Population Employed in Legal Services & Support in Texas is 1.0%.
What is the Percentage of Population Employed in Legal Services & Support in the United States?
Percentage of Population Employed in Legal Services & Support in the United States is 1.2%.