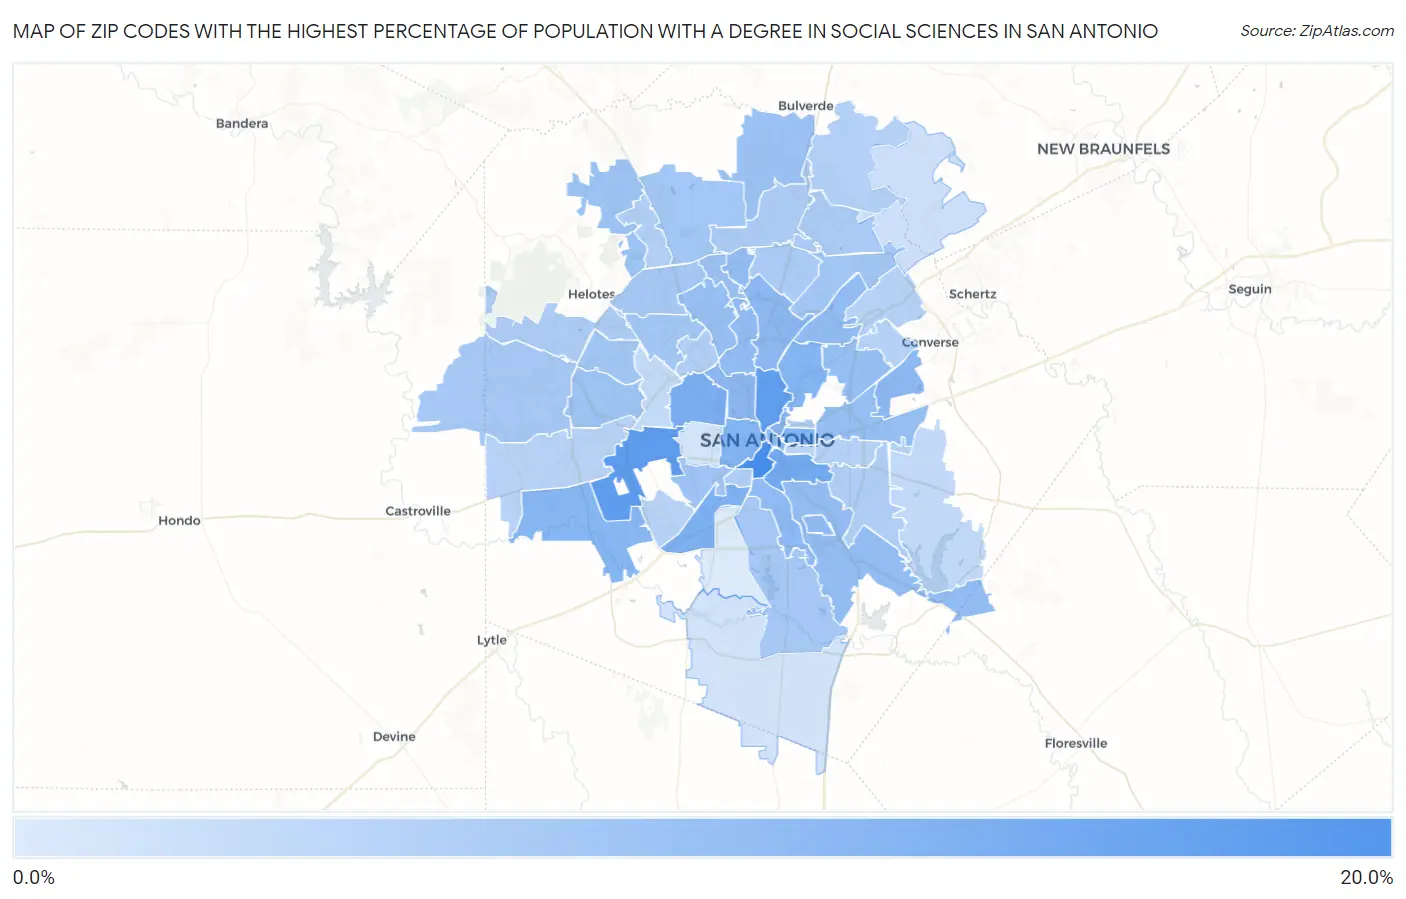
Zip Codes with the Highest Percentage of Population with a Degree in Social Sciences in San Antonio, TX
RELATED REPORTS & OPTIONS
Social Sciences
San Antonio
Compare Zip Codes
Map of Zip Codes with the Highest Percentage of Population with a Degree in Social Sciences in San Antonio
0.79%
15.6%
Zip Codes with the Highest Percentage of Population with a Degree in Social Sciences in San Antonio, TX
| Zip Code | % Graduates | vs State | vs National | |
| 1. | 78204 | 15.6% | 6.1%(+9.50)#57 | 8.1%(+7.56)#1,753 |
| 2. | 78227 | 13.3% | 6.1%(+7.13)#84 | 8.1%(+5.19)#2,695 |
| 3. | 78212 | 12.9% | 6.1%(+6.76)#91 | 8.1%(+4.82)#2,888 |
| 4. | 78210 | 11.1% | 6.1%(+4.94)#130 | 8.1%(+3.00)#4,312 |
| 5. | 78228 | 10.4% | 6.1%(+4.26)#149 | 8.1%(+2.32)#5,091 |
| 6. | 78211 | 9.9% | 6.1%(+3.78)#170 | 8.1%(+1.84)#5,666 |
| 7. | 78202 | 9.7% | 6.1%(+3.62)#176 | 8.1%(+1.68)#5,874 |
| 8. | 78207 | 9.5% | 6.1%(+3.38)#191 | 8.1%(+1.44)#6,194 |
| 9. | 78209 | 9.5% | 6.1%(+3.32)#198 | 8.1%(+1.38)#6,271 |
| 10. | 78252 | 9.1% | 6.1%(+2.93)#224 | 8.1%(+0.995)#6,862 |
| 11. | 78215 | 8.8% | 6.1%(+2.66)#242 | 8.1%(+0.724)#7,279 |
| 12. | 78216 | 8.6% | 6.1%(+2.50)#258 | 8.1%(+0.558)#7,556 |
| 13. | 78244 | 8.6% | 6.1%(+2.43)#266 | 8.1%(+0.494)#7,686 |
| 14. | 78201 | 8.5% | 6.1%(+2.35)#271 | 8.1%(+0.405)#7,851 |
| 15. | 78205 | 8.3% | 6.1%(+2.12)#294 | 8.1%(+0.184)#8,255 |
| 16. | 78214 | 8.2% | 6.1%(+2.09)#295 | 8.1%(+0.153)#8,310 |
| 17. | 78217 | 8.1% | 6.1%(+2.00)#307 | 8.1%(+0.058)#8,495 |
| 18. | 78235 | 8.0% | 6.1%(+1.91)#316 | 8.1%(-0.034)#8,663 |
| 19. | 78213 | 8.0% | 6.1%(+1.83)#325 | 8.1%(-0.105)#8,822 |
| 20. | 78248 | 7.9% | 6.1%(+1.73)#336 | 8.1%(-0.215)#9,047 |
| 21. | 78223 | 7.7% | 6.1%(+1.61)#345 | 8.1%(-0.330)#9,286 |
| 22. | 78218 | 7.7% | 6.1%(+1.53)#354 | 8.1%(-0.410)#9,454 |
| 23. | 78219 | 7.6% | 6.1%(+1.48)#359 | 8.1%(-0.461)#9,551 |
| 24. | 78230 | 7.5% | 6.1%(+1.37)#367 | 8.1%(-0.574)#9,776 |
| 25. | 78260 | 7.2% | 6.1%(+1.05)#408 | 8.1%(-0.890)#10,477 |
| 26. | 78231 | 7.1% | 6.1%(+0.936)#427 | 8.1%(-1.00)#10,758 |
| 27. | 78255 | 6.8% | 6.1%(+0.665)#466 | 8.1%(-1.28)#11,387 |
| 28. | 78251 | 6.6% | 6.1%(+0.515)#480 | 8.1%(-1.43)#11,752 |
| 29. | 78226 | 6.5% | 6.1%(+0.390)#496 | 8.1%(-1.55)#12,052 |
| 30. | 78250 | 6.4% | 6.1%(+0.228)#530 | 8.1%(-1.71)#12,491 |
| 31. | 78240 | 6.3% | 6.1%(+0.154)#537 | 8.1%(-1.79)#12,663 |
| 32. | 78247 | 6.2% | 6.1%(+0.045)#560 | 8.1%(-1.89)#12,919 |
| 33. | 78257 | 6.2% | 6.1%(+0.022)#564 | 8.1%(-1.92)#12,951 |
| 34. | 78249 | 6.1% | 6.1%(-0.059)#576 | 8.1%(-2.00)#13,155 |
| 35. | 78253 | 6.0% | 6.1%(-0.166)#594 | 8.1%(-2.11)#13,436 |
| 36. | 78221 | 5.9% | 6.1%(-0.184)#595 | 8.1%(-2.12)#13,479 |
| 37. | 78232 | 5.7% | 6.1%(-0.439)#634 | 8.1%(-2.38)#14,090 |
| 38. | 78259 | 5.5% | 6.1%(-0.616)#662 | 8.1%(-2.56)#14,536 |
| 39. | 78254 | 5.4% | 6.1%(-0.762)#687 | 8.1%(-2.70)#14,903 |
| 40. | 78258 | 5.3% | 6.1%(-0.802)#697 | 8.1%(-2.74)#14,999 |
| 41. | 78222 | 5.2% | 6.1%(-0.892)#715 | 8.1%(-2.83)#15,252 |
| 42. | 78225 | 5.1% | 6.1%(-1.07)#752 | 8.1%(-3.01)#15,681 |
| 43. | 78229 | 5.0% | 6.1%(-1.11)#760 | 8.1%(-3.05)#15,773 |
| 44. | 78220 | 4.8% | 6.1%(-1.35)#803 | 8.1%(-3.29)#16,322 |
| 45. | 78208 | 4.8% | 6.1%(-1.37)#805 | 8.1%(-3.31)#16,356 |
| 46. | 78261 | 4.7% | 6.1%(-1.41)#811 | 8.1%(-3.35)#16,483 |
| 47. | 78256 | 4.6% | 6.1%(-1.49)#825 | 8.1%(-3.43)#16,685 |
| 48. | 78233 | 4.5% | 6.1%(-1.58)#843 | 8.1%(-3.52)#16,891 |
| 49. | 78239 | 4.5% | 6.1%(-1.60)#847 | 8.1%(-3.54)#16,956 |
| 50. | 78242 | 4.3% | 6.1%(-1.85)#885 | 8.1%(-3.78)#17,550 |
| 51. | 78245 | 4.2% | 6.1%(-1.94)#902 | 8.1%(-3.88)#17,767 |
| 52. | 78203 | 4.0% | 6.1%(-2.16)#939 | 8.1%(-4.10)#18,267 |
| 53. | 78263 | 3.4% | 6.1%(-2.76)#1,035 | 8.1%(-4.70)#19,594 |
| 54. | 78238 | 3.1% | 6.1%(-3.02)#1,069 | 8.1%(-4.96)#20,127 |
| 55. | 78266 | 2.3% | 6.1%(-3.83)#1,169 | 8.1%(-5.77)#21,641 |
| 56. | 78264 | 1.8% | 6.1%(-4.34)#1,240 | 8.1%(-6.28)#22,492 |
| 57. | 78237 | 1.6% | 6.1%(-4.53)#1,276 | 8.1%(-6.47)#22,811 |
| 58. | 78224 | 0.79% | 6.1%(-5.34)#1,359 | 8.1%(-7.28)#23,821 |
1
Common Questions
What are the Top 10 Zip Codes with the Highest Percentage of Population with a Degree in Social Sciences in San Antonio, TX?
Top 10 Zip Codes with the Highest Percentage of Population with a Degree in Social Sciences in San Antonio, TX are:
What zip code has the Highest Percentage of Population with a Degree in Social Sciences in San Antonio, TX?
78204 has the Highest Percentage of Population with a Degree in Social Sciences in San Antonio, TX with 15.6%.
What is the Percentage of Population with a Degree in Social Sciences in San Antonio, TX?
Percentage of Population with a Degree in Social Sciences in San Antonio is 7.0%.
What is the Percentage of Population with a Degree in Social Sciences in Texas?
Percentage of Population with a Degree in Social Sciences in Texas is 6.1%.
What is the Percentage of Population with a Degree in Social Sciences in the United States?
Percentage of Population with a Degree in Social Sciences in the United States is 8.1%.