Zip Codes with the Highest Percentage of Population Employed in Accommodation & Food Services in San Antonio, TX
RELATED REPORTS & OPTIONS
Accommodation & Food Services
San Antonio
Compare Zip Codes
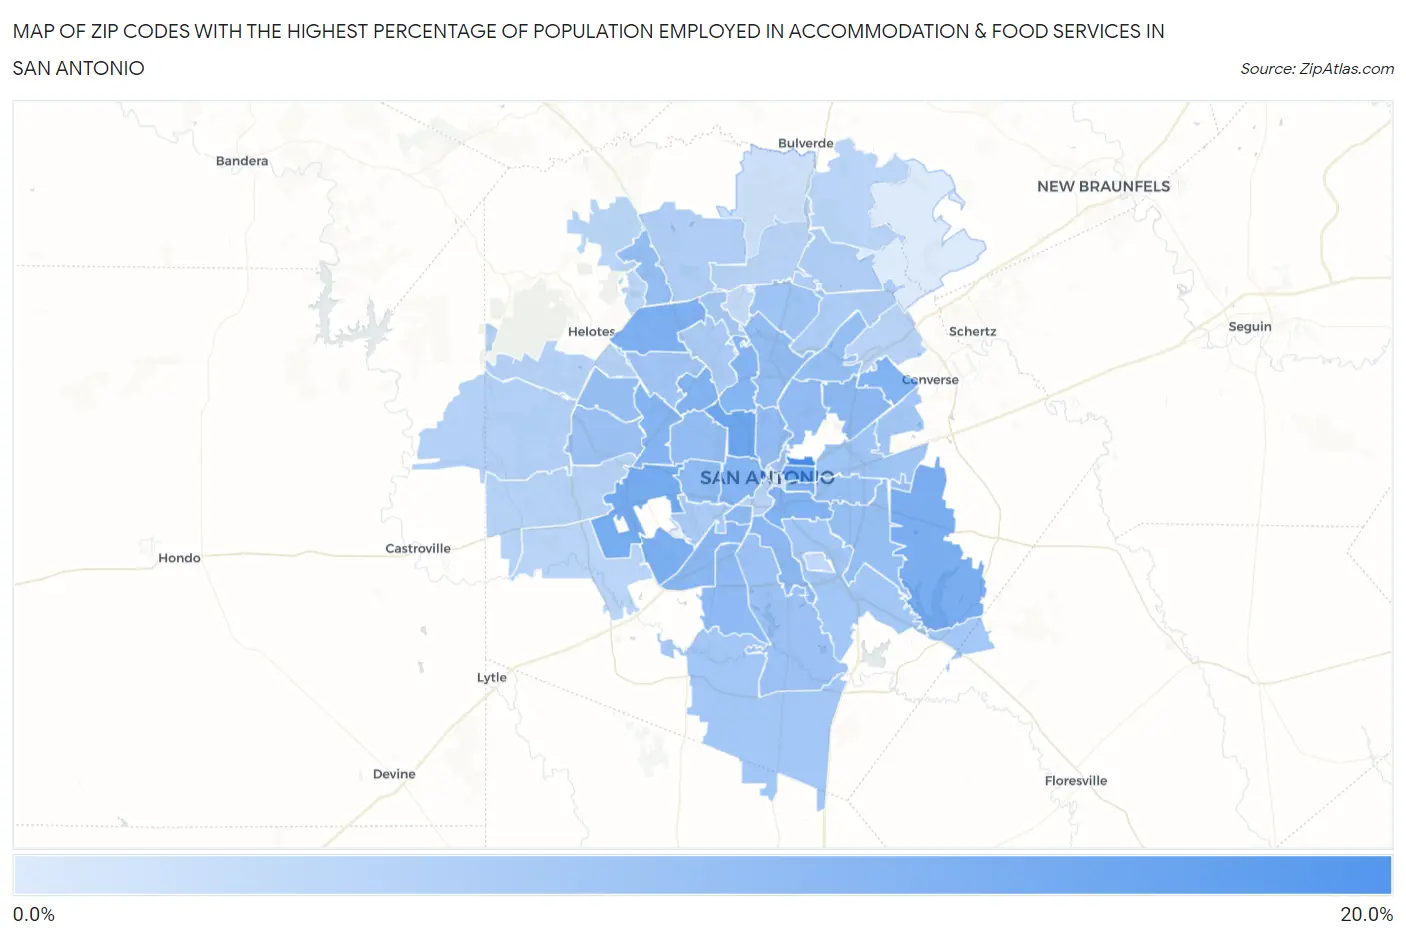
Map of Zip Codes with the Highest Percentage of Population Employed in Accommodation & Food Services in San Antonio
3.2%
18.3%
Zip Codes with the Highest Percentage of Population Employed in Accommodation & Food Services in San Antonio, TX
| Zip Code | % Employed | vs State | vs National | |
| 1. | 78208 | 18.3% | 7.2%(+11.0)#51 | 6.9%(+11.4)#1,055 |
| 2. | 78202 | 14.7% | 7.2%(+7.51)#91 | 6.9%(+7.83)#1,756 |
| 3. | 78201 | 14.1% | 7.2%(+6.91)#100 | 6.9%(+7.24)#1,930 |
| 4. | 78227 | 13.4% | 7.2%(+6.15)#119 | 6.9%(+6.48)#2,197 |
| 5. | 78263 | 12.8% | 7.2%(+5.63)#134 | 6.9%(+5.95)#2,415 |
| 6. | 78242 | 12.8% | 7.2%(+5.55)#137 | 6.9%(+5.88)#2,454 |
| 7. | 78203 | 12.6% | 7.2%(+5.36)#144 | 6.9%(+5.68)#2,554 |
| 8. | 78249 | 12.4% | 7.2%(+5.22)#149 | 6.9%(+5.55)#2,626 |
| 9. | 78210 | 12.2% | 7.2%(+4.99)#155 | 6.9%(+5.31)#2,719 |
| 10. | 78229 | 12.0% | 7.2%(+4.83)#163 | 6.9%(+5.15)#2,814 |
| 11. | 78239 | 12.0% | 7.2%(+4.83)#164 | 6.9%(+5.15)#2,815 |
| 12. | 78238 | 11.8% | 7.2%(+4.61)#178 | 6.9%(+4.94)#2,945 |
| 13. | 78207 | 11.7% | 7.2%(+4.52)#180 | 6.9%(+4.85)#3,002 |
| 14. | 78213 | 11.7% | 7.2%(+4.45)#187 | 6.9%(+4.77)#3,048 |
| 15. | 78211 | 11.2% | 7.2%(+4.03)#199 | 6.9%(+4.36)#3,369 |
| 16. | 78214 | 11.1% | 7.2%(+3.94)#204 | 6.9%(+4.26)#3,436 |
| 17. | 78218 | 11.1% | 7.2%(+3.90)#207 | 6.9%(+4.23)#3,477 |
| 18. | 78225 | 11.0% | 7.2%(+3.81)#214 | 6.9%(+4.13)#3,543 |
| 19. | 78237 | 10.9% | 7.2%(+3.67)#223 | 6.9%(+3.99)#3,657 |
| 20. | 78224 | 10.7% | 7.2%(+3.52)#229 | 6.9%(+3.85)#3,780 |
| 21. | 78209 | 10.7% | 7.2%(+3.45)#232 | 6.9%(+3.77)#3,834 |
| 22. | 78212 | 10.5% | 7.2%(+3.34)#239 | 6.9%(+3.66)#3,948 |
| 23. | 78228 | 10.4% | 7.2%(+3.23)#246 | 6.9%(+3.56)#4,058 |
| 24. | 78216 | 10.3% | 7.2%(+3.11)#256 | 6.9%(+3.43)#4,186 |
| 25. | 78222 | 10.2% | 7.2%(+2.99)#272 | 6.9%(+3.32)#4,307 |
| 26. | 78217 | 10.2% | 7.2%(+2.95)#275 | 6.9%(+3.27)#4,350 |
| 27. | 78256 | 10.1% | 7.2%(+2.94)#277 | 6.9%(+3.27)#4,360 |
| 28. | 78220 | 9.9% | 7.2%(+2.73)#293 | 6.9%(+3.06)#4,619 |
| 29. | 78250 | 9.9% | 7.2%(+2.66)#296 | 6.9%(+2.98)#4,708 |
| 30. | 78221 | 9.7% | 7.2%(+2.53)#312 | 6.9%(+2.85)#4,891 |
| 31. | 78251 | 9.6% | 7.2%(+2.36)#331 | 6.9%(+2.68)#5,130 |
| 32. | 78219 | 9.3% | 7.2%(+2.07)#367 | 6.9%(+2.40)#5,535 |
| 33. | 78232 | 9.1% | 7.2%(+1.94)#378 | 6.9%(+2.26)#5,739 |
| 34. | 78240 | 9.1% | 7.2%(+1.87)#391 | 6.9%(+2.20)#5,835 |
| 35. | 78215 | 9.1% | 7.2%(+1.86)#394 | 6.9%(+2.19)#5,862 |
| 36. | 78223 | 8.8% | 7.2%(+1.60)#427 | 6.9%(+1.93)#6,264 |
| 37. | 78244 | 8.8% | 7.2%(+1.57)#430 | 6.9%(+1.89)#6,341 |
| 38. | 78264 | 8.8% | 7.2%(+1.54)#435 | 6.9%(+1.87)#6,391 |
| 39. | 78231 | 8.6% | 7.2%(+1.37)#458 | 6.9%(+1.69)#6,680 |
| 40. | 78230 | 8.1% | 7.2%(+0.944)#531 | 6.9%(+1.27)#7,540 |
| 41. | 78226 | 8.1% | 7.2%(+0.934)#534 | 6.9%(+1.26)#7,562 |
| 42. | 78247 | 7.8% | 7.2%(+0.552)#589 | 6.9%(+0.877)#8,345 |
| 43. | 78257 | 7.6% | 7.2%(+0.437)#610 | 6.9%(+0.761)#8,647 |
| 44. | 78259 | 7.6% | 7.2%(+0.426)#613 | 6.9%(+0.751)#8,675 |
| 45. | 78253 | 7.1% | 7.2%(-0.078)#702 | 6.9%(+0.247)#9,991 |
| 46. | 78254 | 7.0% | 7.2%(-0.187)#714 | 6.9%(+0.138)#10,250 |
| 47. | 78245 | 6.8% | 7.2%(-0.371)#752 | 6.9%(-0.046)#10,770 |
| 48. | 78204 | 6.8% | 7.2%(-0.376)#754 | 6.9%(-0.051)#10,796 |
| 49. | 78233 | 6.8% | 7.2%(-0.433)#767 | 6.9%(-0.108)#10,974 |
| 50. | 78258 | 6.7% | 7.2%(-0.511)#779 | 6.9%(-0.186)#11,214 |
| 51. | 78255 | 6.6% | 7.2%(-0.628)#803 | 6.9%(-0.303)#11,588 |
| 52. | 78252 | 6.6% | 7.2%(-0.651)#809 | 6.9%(-0.327)#11,664 |
| 53. | 78261 | 6.4% | 7.2%(-0.811)#844 | 6.9%(-0.486)#12,179 |
| 54. | 78235 | 5.9% | 7.2%(-1.35)#940 | 6.9%(-1.02)#13,917 |
| 55. | 78248 | 5.6% | 7.2%(-1.64)#994 | 6.9%(-1.31)#14,821 |
| 56. | 78260 | 4.8% | 7.2%(-2.41)#1,132 | 6.9%(-2.08)#17,492 |
| 57. | 78205 | 3.7% | 7.2%(-3.55)#1,329 | 6.9%(-3.22)#21,262 |
| 58. | 78266 | 3.2% | 7.2%(-4.01)#1,408 | 6.9%(-3.69)#22,720 |
1
Common Questions
What are the Top 10 Zip Codes with the Highest Percentage of Population Employed in Accommodation & Food Services in San Antonio, TX?
Top 10 Zip Codes with the Highest Percentage of Population Employed in Accommodation & Food Services in San Antonio, TX are:
What zip code has the Highest Percentage of Population Employed in Accommodation & Food Services in San Antonio, TX?
78208 has the Highest Percentage of Population Employed in Accommodation & Food Services in San Antonio, TX with 18.3%.
What is the Percentage of Population Employed in Accommodation & Food Services in San Antonio, TX?
Percentage of Population Employed in Accommodation & Food Services in San Antonio is 10.2%.
What is the Percentage of Population Employed in Accommodation & Food Services in Texas?
Percentage of Population Employed in Accommodation & Food Services in Texas is 7.2%.
What is the Percentage of Population Employed in Accommodation & Food Services in the United States?
Percentage of Population Employed in Accommodation & Food Services in the United States is 6.9%.