Zip Codes with the Highest Percentage of Population Enrolled in Nursery / Preschool in San Antonio, TX
RELATED REPORTS & OPTIONS
Nursery / Preschool
San Antonio
Compare Zip Codes
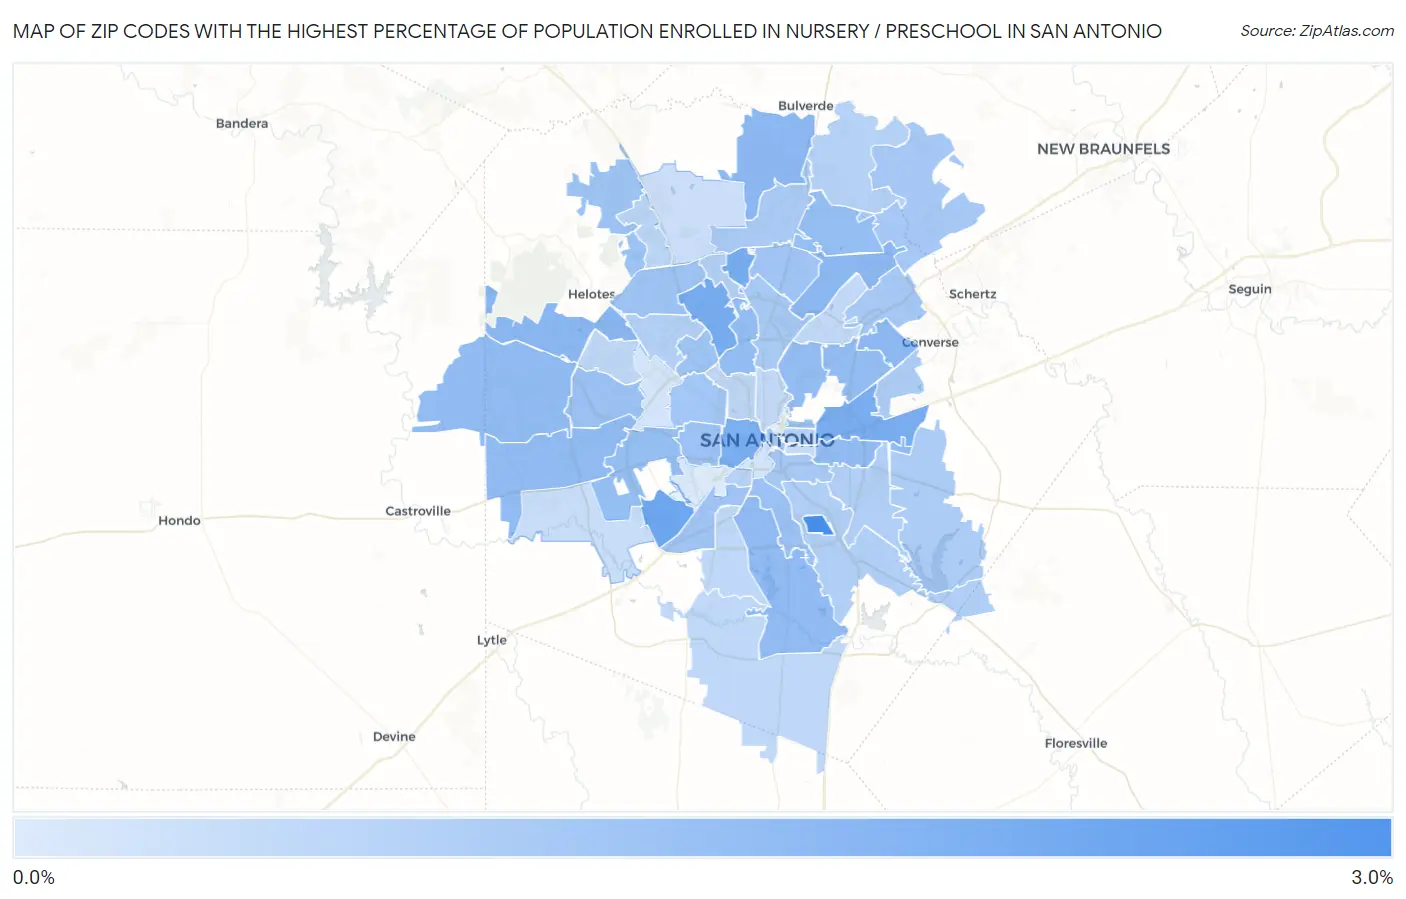
Map of Zip Codes with the Highest Percentage of Population Enrolled in Nursery / Preschool in San Antonio
0.39%
3.0%
Zip Codes with the Highest Percentage of Population Enrolled in Nursery / Preschool in San Antonio, TX
| Zip Code | % in Nursery | vs State | vs National | |
| 1. | 78235 | 3.0% | 1.5%(+1.44)#111 | 1.4%(+1.52)#2,276 |
| 2. | 78242 | 2.3% | 1.5%(+0.767)#230 | 1.4%(+0.848)#4,352 |
| 3. | 78248 | 2.1% | 1.5%(+0.595)#293 | 1.4%(+0.675)#5,256 |
| 4. | 78230 | 2.1% | 1.5%(+0.584)#295 | 1.4%(+0.665)#5,319 |
| 5. | 78219 | 2.1% | 1.5%(+0.557)#311 | 1.4%(+0.637)#5,515 |
| 6. | 78207 | 2.0% | 1.5%(+0.509)#331 | 1.4%(+0.589)#5,838 |
| 7. | 78254 | 1.8% | 1.5%(+0.290)#457 | 1.4%(+0.371)#7,553 |
| 8. | 78239 | 1.8% | 1.5%(+0.257)#483 | 1.4%(+0.337)#7,876 |
| 9. | 78247 | 1.8% | 1.5%(+0.236)#494 | 1.4%(+0.317)#8,081 |
| 10. | 78260 | 1.8% | 1.5%(+0.225)#503 | 1.4%(+0.305)#8,186 |
| 11. | 78245 | 1.7% | 1.5%(+0.177)#518 | 1.4%(+0.257)#8,648 |
| 12. | 78253 | 1.7% | 1.5%(+0.164)#527 | 1.4%(+0.245)#8,776 |
| 13. | 78221 | 1.7% | 1.5%(+0.150)#532 | 1.4%(+0.231)#8,944 |
| 14. | 78220 | 1.7% | 1.5%(+0.144)#540 | 1.4%(+0.225)#9,027 |
| 15. | 78213 | 1.7% | 1.5%(+0.132)#548 | 1.4%(+0.213)#9,175 |
| 16. | 78218 | 1.7% | 1.5%(+0.130)#551 | 1.4%(+0.210)#9,204 |
| 17. | 78209 | 1.6% | 1.5%(+0.103)#576 | 1.4%(+0.183)#9,486 |
| 18. | 78227 | 1.6% | 1.5%(+0.097)#582 | 1.4%(+0.178)#9,559 |
| 19. | 78259 | 1.6% | 1.5%(+0.096)#584 | 1.4%(+0.176)#9,566 |
| 20. | 78237 | 1.5% | 1.5%(+0.016)#632 | 1.4%(+0.096)#10,463 |
| 21. | 78208 | 1.5% | 1.5%(+0.009)#639 | 1.4%(+0.089)#10,551 |
| 22. | 78214 | 1.5% | 1.5%(-0.031)#668 | 1.4%(+0.049)#11,018 |
| 23. | 78251 | 1.5% | 1.5%(-0.034)#675 | 1.4%(+0.046)#11,067 |
| 24. | 78249 | 1.5% | 1.5%(-0.072)#701 | 1.4%(+0.008)#11,524 |
| 25. | 78255 | 1.5% | 1.5%(-0.074)#702 | 1.4%(+0.007)#11,550 |
| 26. | 78229 | 1.4% | 1.5%(-0.086)#711 | 1.4%(-0.006)#11,703 |
| 27. | 78232 | 1.4% | 1.5%(-0.109)#728 | 1.4%(-0.029)#12,002 |
| 28. | 78211 | 1.4% | 1.5%(-0.120)#739 | 1.4%(-0.039)#12,141 |
| 29. | 78205 | 1.4% | 1.5%(-0.150)#763 | 1.4%(-0.069)#12,517 |
| 30. | 78228 | 1.4% | 1.5%(-0.173)#775 | 1.4%(-0.093)#12,812 |
| 31. | 78210 | 1.4% | 1.5%(-0.177)#776 | 1.4%(-0.096)#12,847 |
| 32. | 78266 | 1.3% | 1.5%(-0.181)#785 | 1.4%(-0.100)#12,908 |
| 33. | 78233 | 1.3% | 1.5%(-0.210)#814 | 1.4%(-0.130)#13,279 |
| 34. | 78216 | 1.3% | 1.5%(-0.237)#837 | 1.4%(-0.156)#13,657 |
| 35. | 78258 | 1.3% | 1.5%(-0.276)#867 | 1.4%(-0.196)#14,182 |
| 36. | 78244 | 1.2% | 1.5%(-0.299)#882 | 1.4%(-0.219)#14,518 |
| 37. | 78263 | 1.2% | 1.5%(-0.306)#887 | 1.4%(-0.226)#14,594 |
| 38. | 78222 | 1.1% | 1.5%(-0.387)#952 | 1.4%(-0.307)#15,677 |
| 39. | 78223 | 1.1% | 1.5%(-0.405)#966 | 1.4%(-0.324)#15,887 |
| 40. | 78240 | 1.1% | 1.5%(-0.440)#998 | 1.4%(-0.360)#16,360 |
| 41. | 78231 | 1.1% | 1.5%(-0.446)#1,001 | 1.4%(-0.365)#16,442 |
| 42. | 78225 | 1.1% | 1.5%(-0.458)#1,018 | 1.4%(-0.378)#16,602 |
| 43. | 78261 | 1.0% | 1.5%(-0.488)#1,030 | 1.4%(-0.408)#16,999 |
| 44. | 78202 | 1.0% | 1.5%(-0.489)#1,031 | 1.4%(-0.409)#17,009 |
| 45. | 78256 | 0.96% | 1.5%(-0.571)#1,096 | 1.4%(-0.490)#18,088 |
| 46. | 78264 | 0.92% | 1.5%(-0.611)#1,126 | 1.4%(-0.531)#18,610 |
| 47. | 78250 | 0.92% | 1.5%(-0.612)#1,127 | 1.4%(-0.532)#18,616 |
| 48. | 78201 | 0.90% | 1.5%(-0.631)#1,138 | 1.4%(-0.551)#18,876 |
| 49. | 78224 | 0.89% | 1.5%(-0.638)#1,145 | 1.4%(-0.558)#18,954 |
| 50. | 78217 | 0.86% | 1.5%(-0.664)#1,160 | 1.4%(-0.584)#19,264 |
| 51. | 78212 | 0.85% | 1.5%(-0.676)#1,165 | 1.4%(-0.596)#19,400 |
| 52. | 78203 | 0.82% | 1.5%(-0.712)#1,197 | 1.4%(-0.632)#19,814 |
| 53. | 78252 | 0.76% | 1.5%(-0.769)#1,226 | 1.4%(-0.689)#20,455 |
| 54. | 78257 | 0.71% | 1.5%(-0.817)#1,248 | 1.4%(-0.736)#20,984 |
| 55. | 78238 | 0.56% | 1.5%(-0.970)#1,345 | 1.4%(-0.889)#22,540 |
| 56. | 78204 | 0.56% | 1.5%(-0.971)#1,346 | 1.4%(-0.891)#22,546 |
| 57. | 78226 | 0.39% | 1.5%(-1.14)#1,428 | 1.4%(-1.06)#23,925 |
1
Common Questions
What are the Top 10 Zip Codes with the Highest Percentage of Population Enrolled in Nursery / Preschool in San Antonio, TX?
Top 10 Zip Codes with the Highest Percentage of Population Enrolled in Nursery / Preschool in San Antonio, TX are:
What zip code has the Highest Percentage of Population Enrolled in Nursery / Preschool in San Antonio, TX?
78235 has the Highest Percentage of Population Enrolled in Nursery / Preschool in San Antonio, TX with 3.0%.
What is the Percentage of Population Enrolled in Nursery / Preschool in San Antonio, TX?
Percentage of Population Enrolled in Nursery / Preschool in San Antonio is 1.4%.
What is the Percentage of Population Enrolled in Nursery / Preschool in Texas?
Percentage of Population Enrolled in Nursery / Preschool in Texas is 1.5%.
What is the Percentage of Population Enrolled in Nursery / Preschool in the United States?
Percentage of Population Enrolled in Nursery / Preschool in the United States is 1.4%.