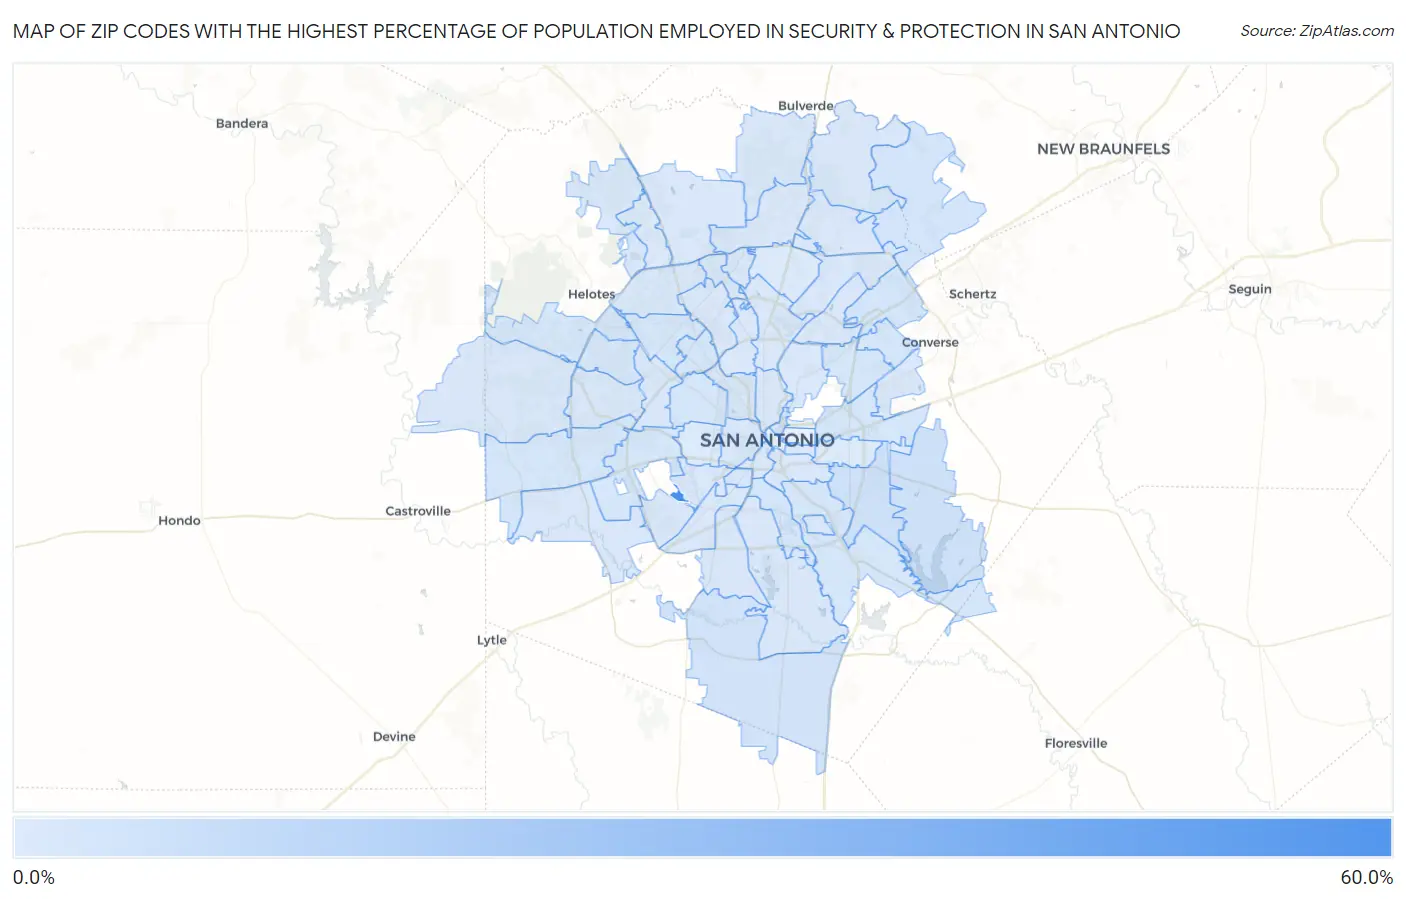
Zip Codes with the Highest Percentage of Population Employed in Security & Protection in San Antonio, TX
RELATED REPORTS & OPTIONS
Security & Protection
San Antonio
Compare Zip Codes
Map of Zip Codes with the Highest Percentage of Population Employed in Security & Protection in San Antonio
0.37%
60.0%
Zip Codes with the Highest Percentage of Population Employed in Security & Protection in San Antonio, TX
| Zip Code | % Employed | vs State | vs National | |
| 1. | 78243 | 60.0% | 2.2%(+57.8)#2 | 2.1%(+57.9)#26 |
| 2. | 78222 | 4.8% | 2.2%(+2.62)#244 | 2.1%(+2.70)#3,112 |
| 3. | 78263 | 4.7% | 2.2%(+2.52)#251 | 2.1%(+2.60)#3,242 |
| 4. | 78264 | 3.7% | 2.2%(+1.52)#373 | 2.1%(+1.60)#5,040 |
| 5. | 78233 | 3.6% | 2.2%(+1.33)#410 | 2.1%(+1.40)#5,529 |
| 6. | 78266 | 3.3% | 2.2%(+1.06)#455 | 2.1%(+1.14)#6,278 |
| 7. | 78214 | 3.0% | 2.2%(+0.787)#515 | 2.1%(+0.863)#7,188 |
| 8. | 78245 | 2.8% | 2.2%(+0.577)#578 | 2.1%(+0.652)#8,115 |
| 9. | 78228 | 2.8% | 2.2%(+0.552)#583 | 2.1%(+0.627)#8,221 |
| 10. | 78250 | 2.6% | 2.2%(+0.356)#641 | 2.1%(+0.432)#9,103 |
| 11. | 78215 | 2.6% | 2.2%(+0.348)#644 | 2.1%(+0.424)#9,144 |
| 12. | 78239 | 2.5% | 2.2%(+0.254)#675 | 2.1%(+0.329)#9,629 |
| 13. | 78223 | 2.5% | 2.2%(+0.229)#686 | 2.1%(+0.304)#9,771 |
| 14. | 78254 | 2.4% | 2.2%(+0.175)#708 | 2.1%(+0.250)#10,058 |
| 15. | 78225 | 2.4% | 2.2%(+0.167)#710 | 2.1%(+0.242)#10,102 |
| 16. | 78227 | 2.3% | 2.2%(+0.118)#730 | 2.1%(+0.194)#10,371 |
| 17. | 78240 | 2.3% | 2.2%(+0.047)#756 | 2.1%(+0.122)#10,833 |
| 18. | 78218 | 2.2% | 2.2%(+0.017)#766 | 2.1%(+0.093)#11,005 |
| 19. | 78229 | 2.2% | 2.2%(-0.005)#773 | 2.1%(+0.070)#11,142 |
| 20. | 78219 | 2.2% | 2.2%(-0.027)#779 | 2.1%(+0.049)#11,272 |
| 21. | 78248 | 2.1% | 2.2%(-0.107)#808 | 2.1%(-0.031)#11,782 |
| 22. | 78253 | 2.1% | 2.2%(-0.148)#825 | 2.1%(-0.072)#12,076 |
| 23. | 78201 | 2.1% | 2.2%(-0.149)#826 | 2.1%(-0.074)#12,083 |
| 24. | 78207 | 2.0% | 2.2%(-0.209)#853 | 2.1%(-0.133)#12,462 |
| 25. | 78212 | 2.0% | 2.2%(-0.233)#864 | 2.1%(-0.157)#12,612 |
| 26. | 78251 | 2.0% | 2.2%(-0.236)#867 | 2.1%(-0.161)#12,635 |
| 27. | 78255 | 1.9% | 2.2%(-0.327)#907 | 2.1%(-0.251)#13,238 |
| 28. | 78224 | 1.9% | 2.2%(-0.335)#914 | 2.1%(-0.260)#13,312 |
| 29. | 78238 | 1.8% | 2.2%(-0.382)#930 | 2.1%(-0.307)#13,627 |
| 30. | 78261 | 1.8% | 2.2%(-0.389)#933 | 2.1%(-0.313)#13,676 |
| 31. | 78249 | 1.8% | 2.2%(-0.406)#940 | 2.1%(-0.331)#13,805 |
| 32. | 78260 | 1.7% | 2.2%(-0.565)#1,009 | 2.1%(-0.490)#14,986 |
| 33. | 78242 | 1.6% | 2.2%(-0.648)#1,056 | 2.1%(-0.573)#15,602 |
| 34. | 78235 | 1.6% | 2.2%(-0.649)#1,057 | 2.1%(-0.573)#15,604 |
| 35. | 78221 | 1.5% | 2.2%(-0.731)#1,087 | 2.1%(-0.655)#16,265 |
| 36. | 78252 | 1.4% | 2.2%(-0.783)#1,103 | 2.1%(-0.707)#16,655 |
| 37. | 78217 | 1.4% | 2.2%(-0.813)#1,116 | 2.1%(-0.737)#16,862 |
| 38. | 78231 | 1.4% | 2.2%(-0.823)#1,124 | 2.1%(-0.748)#16,946 |
| 39. | 78209 | 1.4% | 2.2%(-0.849)#1,142 | 2.1%(-0.774)#17,145 |
| 40. | 78257 | 1.3% | 2.2%(-0.892)#1,155 | 2.1%(-0.816)#17,485 |
| 41. | 78210 | 1.3% | 2.2%(-0.904)#1,159 | 2.1%(-0.828)#17,584 |
| 42. | 78203 | 1.3% | 2.2%(-0.910)#1,161 | 2.1%(-0.835)#17,629 |
| 43. | 78247 | 1.3% | 2.2%(-0.959)#1,179 | 2.1%(-0.884)#18,032 |
| 44. | 78230 | 1.2% | 2.2%(-1.03)#1,207 | 2.1%(-0.955)#18,559 |
| 45. | 78244 | 1.2% | 2.2%(-1.05)#1,218 | 2.1%(-0.978)#18,743 |
| 46. | 78258 | 1.2% | 2.2%(-1.07)#1,224 | 2.1%(-0.998)#18,892 |
| 47. | 78259 | 1.1% | 2.2%(-1.12)#1,238 | 2.1%(-1.04)#19,240 |
| 48. | 78204 | 1.1% | 2.2%(-1.13)#1,246 | 2.1%(-1.05)#19,315 |
| 49. | 78216 | 0.99% | 2.2%(-1.24)#1,311 | 2.1%(-1.16)#20,158 |
| 50. | 78213 | 0.94% | 2.2%(-1.28)#1,329 | 2.1%(-1.21)#20,504 |
| 51. | 78211 | 0.92% | 2.2%(-1.31)#1,339 | 2.1%(-1.23)#20,681 |
| 52. | 78226 | 0.81% | 2.2%(-1.41)#1,374 | 2.1%(-1.34)#21,349 |
| 53. | 78220 | 0.71% | 2.2%(-1.51)#1,404 | 2.1%(-1.43)#21,977 |
| 54. | 78232 | 0.71% | 2.2%(-1.51)#1,405 | 2.1%(-1.44)#21,983 |
| 55. | 78237 | 0.70% | 2.2%(-1.52)#1,414 | 2.1%(-1.45)#22,075 |
| 56. | 78256 | 0.37% | 2.2%(-1.85)#1,490 | 2.1%(-1.78)#23,880 |
1
Common Questions
What are the Top 10 Zip Codes with the Highest Percentage of Population Employed in Security & Protection in San Antonio, TX?
Top 10 Zip Codes with the Highest Percentage of Population Employed in Security & Protection in San Antonio, TX are:
What zip code has the Highest Percentage of Population Employed in Security & Protection in San Antonio, TX?
78243 has the Highest Percentage of Population Employed in Security & Protection in San Antonio, TX with 60.0%.
What is the Percentage of Population Employed in Security & Protection in San Antonio, TX?
Percentage of Population Employed in Security & Protection in San Antonio is 1.8%.
What is the Percentage of Population Employed in Security & Protection in Texas?
Percentage of Population Employed in Security & Protection in Texas is 2.2%.
What is the Percentage of Population Employed in Security & Protection in the United States?
Percentage of Population Employed in Security & Protection in the United States is 2.1%.