Zip Codes with the Highest Percentage of Households Without a Vehicle in San Antonio, TX

RELATED REPORTS & OPTIONS

Households without a Cars
Population
Families and Households
Female Fertility
Female Fertility (Unmarried)
Race (Community Size)
Race (Percentage)
Ancestry (Community Size)
AfghanAfricanAlbanianAleutAlsatianAmericanApacheArabArgentineanArmenianAustralianAustrianBahamianBangladeshiBarbadianBasqueBelgianBelizeanBhutaneseBlackfeetBolivianBrazilianBritishBritish West IndianBulgarianBurmeseCajunCambodianCanadianCape VerdeanCelticCentral AmericanCentral American IndianCherokeeCheyenneChickasawChileanChineseChippewaChoctawColombianComancheCosta RicanCreekCroatianCubanCzechCzechoslovakianDanishDelawareDominicanDutchDutch West IndianEastern EuropeanEcuadorianEgyptianEnglishEstonianEthiopianEuropeanFilipinoFinnishFrenchFrench American IndianFrench CanadianGermanGerman RussianGhanaianGreekGuamanian / ChamorroGuatemalanGuyaneseHaitianHonduranHopiHungarianIcelanderIndian (Asian)IndonesianInupiatIranianIraqiIrishIroquoisIsraeliItalianJamaicanJapaneseJordanianKenyanKoreanLaotianLatvianLebaneseLiberianLithuanianLumbeeLuxembourgerMacedonianMalaysianMexicanMexican American IndianMongolianMoroccanNative HawaiianNavajoNew ZealanderNicaraguanNigerianNorthern EuropeanNorwegianOkinawanOsageOttawaPakistaniPalestinianPanamanianParaguayanPennsylvania GermanPeruvianPimaPolishPortuguesePotawatomiPuebloPuerto RicanRomanianRussianSalvadoranSamoanScandinavianScotch-IrishScottishSeminoleSerbianShoshoneSierra LeoneanSiouxSlavicSlovakSloveneSomaliSouth AfricanSouth AmericanSouth American IndianSoviet UnionSpaniardSpanishSpanish AmericanSpanish American IndianSri LankanSubsaharan AfricanSudaneseSwedishSwissSyrianThaiTrinidadian and TobagonianTurkishU.S. Virgin IslanderUgandanUkrainianUruguayanUteVenezuelanVietnameseWelshWest IndianYaquiYugoslavian
Ancestry (Percentage)
AfghanAfricanAlbanianAleutAlsatianAmericanApacheArabArgentineanArmenianAustralianAustrianBahamianBangladeshiBarbadianBasqueBelgianBelizeanBhutaneseBlackfeetBolivianBrazilianBritishBritish West IndianBulgarianBurmeseCajunCambodianCanadianCape VerdeanCelticCentral AmericanCentral American IndianCherokeeCheyenneChickasawChileanChineseChippewaChoctawColombianComancheCosta RicanCreekCroatianCubanCzechCzechoslovakianDanishDelawareDominicanDutchDutch West IndianEastern EuropeanEcuadorianEgyptianEnglishEstonianEthiopianEuropeanFilipinoFinnishFrenchFrench American IndianFrench CanadianGermanGerman RussianGhanaianGreekGuamanian / ChamorroGuatemalanGuyaneseHaitianHonduranHopiHungarianIcelanderIndian (Asian)IndonesianInupiatIranianIraqiIrishIroquoisIsraeliItalianJamaicanJapaneseJordanianKenyanKoreanLaotianLatvianLebaneseLiberianLithuanianLumbeeLuxembourgerMacedonianMalaysianMexicanMexican American IndianMongolianMoroccanNative HawaiianNavajoNew ZealanderNicaraguanNigerianNorthern EuropeanNorwegianOkinawanOsageOttawaPakistaniPalestinianPanamanianParaguayanPennsylvania GermanPeruvianPimaPolishPortuguesePotawatomiPuebloPuerto RicanRomanianRussianSalvadoranSamoanScandinavianScotch-IrishScottishSeminoleSerbianShoshoneSierra LeoneanSiouxSlavicSlovakSloveneSomaliSouth AfricanSouth AmericanSouth American IndianSoviet UnionSpaniardSpanishSpanish AmericanSpanish American IndianSri LankanSubsaharan AfricanSudaneseSwedishSwissSyrianThaiTrinidadian and TobagonianTurkishU.S. Virgin IslanderUgandanUkrainianUruguayanUteVenezuelanVietnameseWelshWest IndianYaquiYugoslavian
Immigrant Origin (Total)
AfghanistanAfricaArgentinaAsiaAustraliaAustriaBangladeshBarbadosBelizeBoliviaBrazilBulgariaBurma / MyanmarCambodiaCameroonCanadaCaribbeanCentral AmericaChileChinaColombiaCongoCosta RicaCubaCzechoslovakiaDenmarkDominican RepublicEastern AfricaEastern AsiaEastern EuropeEcuadorEgyptEl SalvadorEnglandEritreaEthiopiaEuropeFijiFranceGermanyGhanaGreeceGuatemalaGuyanaHaitiHondurasHong KongHungaryIndiaIndonesiaIranIraqIrelandIsraelItalyJamaicaJapanJordanKazakhstanKenyaKoreaKuwaitLaosLatin AmericaLatviaLebanonLiberiaLithuaniaMalaysiaMexicoMiddle AfricaMoldovaMoroccoNepalNetherlandsNicaraguaNigeriaNorthern AfricaNorthern EuropeNorwayOceaniaPakistanPanamaPeruPhilippinesPolandPortugalRomaniaRussiaSaudi ArabiaScotlandSerbiaSierra LeoneSingaporeSomaliaSouth AfricaSouth AmericaSouth Central AsiaSouth Eastern AsiaSouthern EuropeSpainSri LankaSudanSwedenSwitzerlandSyriaTaiwanThailandTrinidad and TobagoTurkeyUgandaUkraineUruguayUzbekistanVenezuelaVietnamWestern AfricaWestern AsiaWestern EuropeZaireZimbabwe
Immigrant Origin (Percentage)
AfghanistanAfricaArgentinaAsiaAustraliaAustriaBangladeshBarbadosBelizeBoliviaBrazilBulgariaBurma / MyanmarCambodiaCameroonCanadaCaribbeanCentral AmericaChileChinaColombiaCongoCosta RicaCubaCzechoslovakiaDenmarkDominican RepublicEastern AfricaEastern AsiaEastern EuropeEcuadorEgyptEl SalvadorEnglandEritreaEthiopiaEuropeFijiFranceGermanyGhanaGreeceGuatemalaGuyanaHaitiHondurasHong KongHungaryIndiaIndonesiaIranIraqIrelandIsraelItalyJamaicaJapanJordanKazakhstanKenyaKoreaKuwaitLaosLatin AmericaLatviaLebanonLiberiaLithuaniaMalaysiaMexicoMiddle AfricaMoldovaMoroccoNepalNetherlandsNicaraguaNigeriaNorthern AfricaNorthern EuropeNorwayOceaniaPakistanPanamaPeruPhilippinesPolandPortugalRomaniaRussiaSaudi ArabiaScotlandSerbiaSierra LeoneSingaporeSomaliaSouth AfricaSouth AmericaSouth Central AsiaSouth Eastern AsiaSouthern EuropeSpainSri LankaSudanSwedenSwitzerlandSyriaTaiwanThailandTrinidad and TobagoTurkeyUgandaUkraineUruguayUzbekistanVenezuelaVietnamWestern AfricaWestern AsiaWestern EuropeZaireZimbabwe
Income
Income (Families)
Income (Households)
Poverty
Poverty (Families)
Unemployment
Employment Occupations
Employment Industries
Employer Class
Commute Time
Commute Means
School Enrollment
Education by Degree Field
Occupancy
Finances
Physical Characteristics
San Antonio
Compare Zip Codes
Comparison Subject

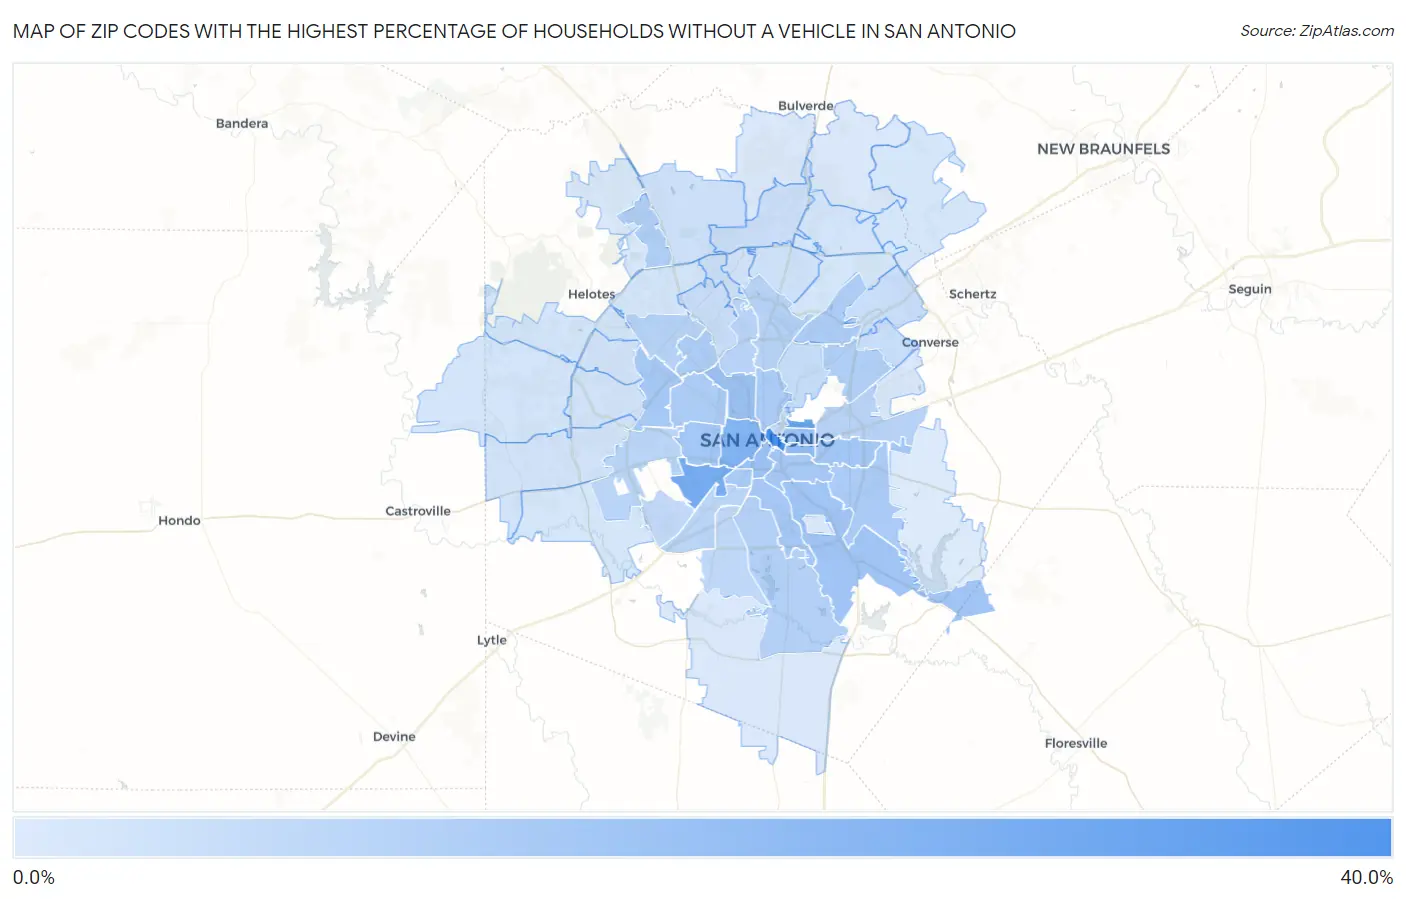
Map of Zip Codes with the Highest Percentage of Households Without a Vehicle in San Antonio

0.0%
40.0%
Zip Codes with the Highest Percentage of Households Without a Vehicle in San Antonio Map

Zip Codes with the Highest Percentage of Households Without a Vehicle in San Antonio, TX

Zip Code Housholds Without a Car vs State vs National
1.7820534.7%5.3%(+29.4)#138.3%(+26.4)#644
2.7820825.2%5.3%(+19.9)#248.3%(+16.9)#1,055
3.7822622.4%5.3%(+17.1)#298.3%(+14.1)#1,266
4.7820719.4%5.3%(+14.1)#378.3%(+11.1)#1,576
5.7820316.6%5.3%(+11.3)#648.3%(+8.30)#2,042
6.7820114.3%5.3%(+9.00)#948.3%(+6.00)#2,584
7.7820214.1%5.3%(+8.80)#998.3%(+5.80)#2,674
8.7820413.6%5.3%(+8.30)#1058.3%(+5.30)#2,848
9.7822312.8%5.3%(+7.50)#1258.3%(+4.50)#3,173
10.7823712.1%5.3%(+6.80)#1508.3%(+3.80)#3,499
11.7822012.1%5.3%(+6.80)#1558.3%(+3.80)#3,512
12.7821412.0%5.3%(+6.70)#1588.3%(+3.70)#3,557
13.7823811.9%5.3%(+6.60)#1658.3%(+3.60)#3,607
14.7821011.6%5.3%(+6.30)#1738.3%(+3.30)#3,755
15.7822511.1%5.3%(+5.80)#1858.3%(+2.80)#4,083
16.7821210.7%5.3%(+5.40)#1988.3%(+2.40)#4,310
17.7822210.6%5.3%(+5.30)#2048.3%(+2.30)#4,390
18.7822910.5%5.3%(+5.20)#2088.3%(+2.20)#4,455
19.7822810.3%5.3%(+5.00)#2158.3%(+2.00)#4,616
20.7821710.1%5.3%(+4.80)#2208.3%(+1.80)#4,772
21.782569.3%5.3%(+4.00)#2568.3%(+1.00)#5,453
22.782189.2%5.3%(+3.90)#2648.3%(+0.900)#5,515
23.782219.0%5.3%(+3.70)#2778.3%(+0.700)#5,726
24.782408.5%5.3%(+3.20)#3038.3%(+0.200)#6,294
25.782168.5%5.3%(+3.20)#3048.3%(+0.200)#6,304
26.782137.9%5.3%(+2.60)#3418.3%(-0.400)#7,067
27.782197.7%5.3%(+2.40)#3618.3%(-0.600)#7,404
28.782117.5%5.3%(+2.20)#3728.3%(-0.800)#7,697
29.782277.3%5.3%(+2.00)#3918.3%(-1.00)#8,020
30.782246.2%5.3%(+0.900)#5048.3%(-2.10)#10,027
31.782426.0%5.3%(+0.700)#5338.3%(-2.30)#10,431
32.782155.1%5.3%(-0.200)#6498.3%(-3.20)#12,727
33.782095.0%5.3%(-0.300)#6618.3%(-3.30)#12,839
34.782334.4%5.3%(-0.900)#7688.3%(-3.90)#14,460
35.782304.3%5.3%(-1.00)#7958.3%(-4.00)#14,775
36.782394.2%5.3%(-1.10)#8238.3%(-4.10)#15,117
37.782583.7%5.3%(-1.60)#9088.3%(-4.60)#16,638
38.782313.6%5.3%(-1.70)#9398.3%(-4.70)#17,077
39.782573.4%5.3%(-1.90)#9728.3%(-4.90)#17,712
40.782322.9%5.3%(-2.40)#1,0818.3%(-5.40)#19,389
41.782482.7%5.3%(-2.60)#1,1368.3%(-5.60)#20,147
42.782502.6%5.3%(-2.70)#1,1528.3%(-5.70)#20,383
43.782452.5%5.3%(-2.80)#1,1708.3%(-5.80)#20,705
44.782512.3%5.3%(-3.00)#1,2098.3%(-6.00)#21,347
45.782532.2%5.3%(-3.10)#1,2298.3%(-6.10)#21,698
46.782492.2%5.3%(-3.10)#1,2308.3%(-6.10)#21,699
47.782542.1%5.3%(-3.20)#1,2518.3%(-6.20)#22,025
48.782592.1%5.3%(-3.20)#1,2608.3%(-6.20)#22,072
49.782471.8%5.3%(-3.50)#1,3218.3%(-6.50)#23,096
50.782521.8%5.3%(-3.50)#1,3298.3%(-6.50)#23,160
51.782661.5%5.3%(-3.80)#1,3878.3%(-6.80)#24,161
52.782551.2%5.3%(-4.10)#1,4368.3%(-7.10)#25,070
53.782441.0%5.3%(-4.30)#1,4718.3%(-7.30)#25,608
54.782610.80%5.3%(-4.50)#1,5068.3%(-7.50)#26,089
55.782350.80%5.3%(-4.50)#1,5148.3%(-7.50)#26,188
56.782600.50%5.3%(-4.80)#1,5558.3%(-7.80)#26,791
57.782640.50%5.3%(-4.80)#1,5588.3%(-7.80)#26,805
58.782630.20%5.3%(-5.10)#1,5858.3%(-8.10)#27,307

Common Questions

What are the Top 10 Zip Codes with the Highest Percentage of Households Without a Vehicle in San Antonio, TX?
Top 10 Zip Codes with the Highest Percentage of Households Without a Vehicle in San Antonio, TX are:
#1
34.7%
#2
25.2%
#3
22.4%
#4
19.4%
#5
16.6%
#6
14.3%
#7
14.1%
#8
13.6%
#9
12.8%
#10
12.1%
What zip code has the Highest Percentage of Households Without a Vehicle in San Antonio, TX?
78205 has the Highest Percentage of Households Without a Vehicle in San Antonio, TX with 34.7%.
What is the Percentage of Households Without a Vehicle in San Antonio, TX?
Percentage of Households Without a Vehicle in San Antonio is 7.7%.
What is the Percentage of Households Without a Vehicle in Texas?
Percentage of Households Without a Vehicle in Texas is 5.3%.
What is the Percentage of Households Without a Vehicle in the United States?
Percentage of Households Without a Vehicle in the United States is 8.3%.