Zip Codes with the Highest Percentage of Population with a Degree in Arts and Humanities in San Antonio, TX
RELATED REPORTS & OPTIONS
Arts and Humanities
San Antonio
Compare Zip Codes
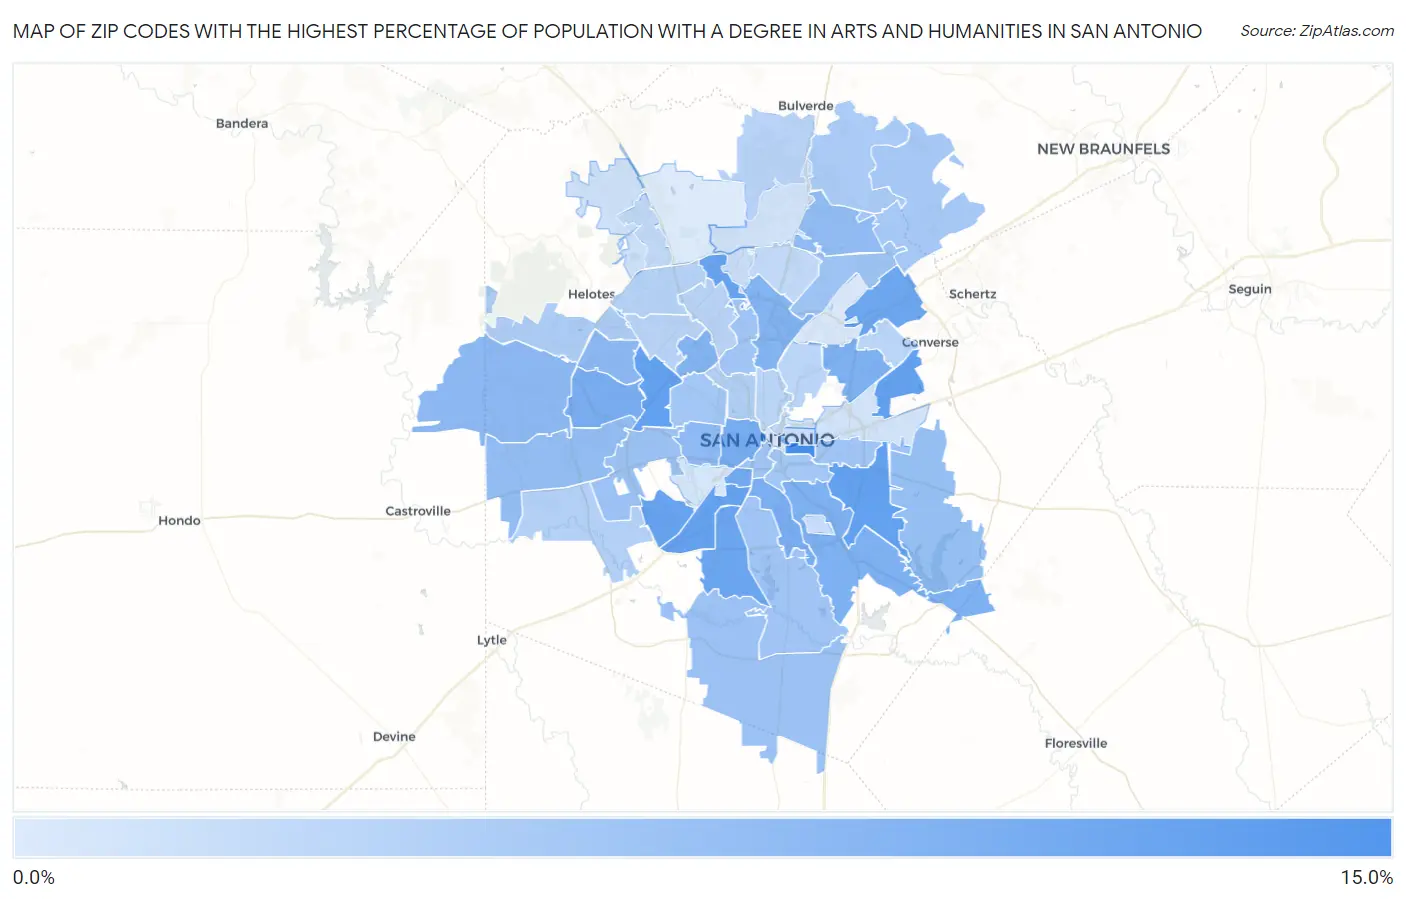
Map of Zip Codes with the Highest Percentage of Population with a Degree in Arts and Humanities in San Antonio
2.4%
12.9%
Zip Codes with the Highest Percentage of Population with a Degree in Arts and Humanities in San Antonio, TX
| Zip Code | % Graduates | vs State | vs National | |
| 1. | 78203 | 12.9% | 6.3%(+6.54)#232 | 6.0%(+6.85)#3,743 |
| 2. | 78238 | 10.9% | 6.3%(+4.56)#341 | 6.0%(+4.88)#5,246 |
| 3. | 78222 | 10.8% | 6.3%(+4.51)#346 | 6.0%(+4.83)#5,290 |
| 4. | 78244 | 10.8% | 6.3%(+4.46)#350 | 6.0%(+4.78)#5,337 |
| 5. | 78211 | 10.7% | 6.3%(+4.36)#358 | 6.0%(+4.68)#5,460 |
| 6. | 78242 | 10.6% | 6.3%(+4.25)#368 | 6.0%(+4.56)#5,576 |
| 7. | 78231 | 10.4% | 6.3%(+4.10)#378 | 6.0%(+4.42)#5,733 |
| 8. | 78224 | 10.2% | 6.3%(+3.85)#400 | 6.0%(+4.16)#6,042 |
| 9. | 78233 | 10.0% | 6.3%(+3.66)#417 | 6.0%(+3.97)#6,304 |
| 10. | 78225 | 9.6% | 6.3%(+3.30)#444 | 6.0%(+3.61)#6,762 |
| 11. | 78207 | 9.4% | 6.3%(+3.04)#465 | 6.0%(+3.36)#7,165 |
| 12. | 78251 | 9.3% | 6.3%(+2.97)#474 | 6.0%(+3.28)#7,277 |
| 13. | 78214 | 9.2% | 6.3%(+2.91)#482 | 6.0%(+3.23)#7,367 |
| 14. | 78218 | 8.9% | 6.3%(+2.63)#512 | 6.0%(+2.94)#7,844 |
| 15. | 78223 | 8.8% | 6.3%(+2.49)#535 | 6.0%(+2.81)#8,076 |
| 16. | 78229 | 8.6% | 6.3%(+2.26)#565 | 6.0%(+2.58)#8,483 |
| 17. | 78216 | 8.6% | 6.3%(+2.25)#566 | 6.0%(+2.57)#8,508 |
| 18. | 78250 | 7.9% | 6.3%(+1.57)#661 | 6.0%(+1.89)#9,889 |
| 19. | 78253 | 7.8% | 6.3%(+1.51)#669 | 6.0%(+1.83)#10,010 |
| 20. | 78237 | 7.7% | 6.3%(+1.35)#688 | 6.0%(+1.66)#10,374 |
| 21. | 78259 | 7.6% | 6.3%(+1.29)#693 | 6.0%(+1.61)#10,479 |
| 22. | 78245 | 7.3% | 6.3%(+1.02)#737 | 6.0%(+1.34)#11,125 |
| 23. | 78263 | 7.3% | 6.3%(+0.940)#747 | 6.0%(+1.26)#11,335 |
| 24. | 78264 | 7.0% | 6.3%(+0.642)#786 | 6.0%(+0.959)#12,084 |
| 25. | 78227 | 6.8% | 6.3%(+0.531)#799 | 6.0%(+0.848)#12,369 |
| 26. | 78247 | 6.7% | 6.3%(+0.338)#834 | 6.0%(+0.655)#12,879 |
| 27. | 78204 | 6.6% | 6.3%(+0.295)#841 | 6.0%(+0.612)#12,982 |
| 28. | 78220 | 6.4% | 6.3%(+0.093)#870 | 6.0%(+0.410)#13,515 |
| 29. | 78221 | 6.4% | 6.3%(+0.092)#871 | 6.0%(+0.409)#13,516 |
| 30. | 78213 | 6.4% | 6.3%(+0.089)#872 | 6.0%(+0.406)#13,523 |
| 31. | 78210 | 6.2% | 6.3%(-0.084)#904 | 6.0%(+0.233)#14,020 |
| 32. | 78228 | 6.2% | 6.3%(-0.088)#906 | 6.0%(+0.229)#14,032 |
| 33. | 78266 | 6.1% | 6.3%(-0.181)#918 | 6.0%(+0.136)#14,297 |
| 34. | 78261 | 5.8% | 6.3%(-0.505)#963 | 6.0%(-0.188)#15,221 |
| 35. | 78254 | 5.7% | 6.3%(-0.584)#977 | 6.0%(-0.267)#15,443 |
| 36. | 78201 | 5.2% | 6.3%(-1.10)#1,058 | 6.0%(-0.785)#16,978 |
| 37. | 78252 | 5.1% | 6.3%(-1.19)#1,072 | 6.0%(-0.869)#17,237 |
| 38. | 78249 | 5.0% | 6.3%(-1.32)#1,100 | 6.0%(-1.00)#17,627 |
| 39. | 78230 | 4.9% | 6.3%(-1.39)#1,116 | 6.0%(-1.08)#17,839 |
| 40. | 78260 | 4.9% | 6.3%(-1.40)#1,117 | 6.0%(-1.09)#17,871 |
| 41. | 78240 | 4.8% | 6.3%(-1.51)#1,137 | 6.0%(-1.19)#18,170 |
| 42. | 78239 | 4.8% | 6.3%(-1.54)#1,142 | 6.0%(-1.22)#18,240 |
| 43. | 78212 | 4.7% | 6.3%(-1.58)#1,144 | 6.0%(-1.26)#18,366 |
| 44. | 78209 | 4.7% | 6.3%(-1.64)#1,152 | 6.0%(-1.32)#18,516 |
| 45. | 78215 | 4.3% | 6.3%(-2.01)#1,209 | 6.0%(-1.69)#19,553 |
| 46. | 78232 | 4.3% | 6.3%(-2.03)#1,211 | 6.0%(-1.71)#19,596 |
| 47. | 78256 | 4.2% | 6.3%(-2.11)#1,218 | 6.0%(-1.79)#19,788 |
| 48. | 78235 | 3.7% | 6.3%(-2.57)#1,277 | 6.0%(-2.26)#21,005 |
| 49. | 78202 | 3.7% | 6.3%(-2.59)#1,278 | 6.0%(-2.27)#21,031 |
| 50. | 78248 | 3.7% | 6.3%(-2.60)#1,281 | 6.0%(-2.29)#21,066 |
| 51. | 78255 | 3.3% | 6.3%(-3.02)#1,332 | 6.0%(-2.71)#22,081 |
| 52. | 78258 | 3.1% | 6.3%(-3.19)#1,359 | 6.0%(-2.88)#22,442 |
| 53. | 78219 | 3.1% | 6.3%(-3.20)#1,360 | 6.0%(-2.89)#22,455 |
| 54. | 78208 | 3.1% | 6.3%(-3.22)#1,363 | 6.0%(-2.90)#22,482 |
| 55. | 78226 | 2.8% | 6.3%(-3.52)#1,392 | 6.0%(-3.20)#23,056 |
| 56. | 78217 | 2.7% | 6.3%(-3.58)#1,400 | 6.0%(-3.27)#23,162 |
| 57. | 78205 | 2.5% | 6.3%(-3.82)#1,420 | 6.0%(-3.50)#23,600 |
| 58. | 78257 | 2.4% | 6.3%(-3.92)#1,427 | 6.0%(-3.60)#23,761 |
1
Common Questions
What are the Top 10 Zip Codes with the Highest Percentage of Population with a Degree in Arts and Humanities in San Antonio, TX?
Top 10 Zip Codes with the Highest Percentage of Population with a Degree in Arts and Humanities in San Antonio, TX are:
What zip code has the Highest Percentage of Population with a Degree in Arts and Humanities in San Antonio, TX?
78203 has the Highest Percentage of Population with a Degree in Arts and Humanities in San Antonio, TX with 12.9%.
What is the Percentage of Population with a Degree in Arts and Humanities in San Antonio, TX?
Percentage of Population with a Degree in Arts and Humanities in San Antonio is 6.2%.
What is the Percentage of Population with a Degree in Arts and Humanities in Texas?
Percentage of Population with a Degree in Arts and Humanities in Texas is 6.3%.
What is the Percentage of Population with a Degree in Arts and Humanities in the United States?
Percentage of Population with a Degree in Arts and Humanities in the United States is 6.0%.