Zip Codes with the Highest Percentage of Population with a Degree in Psychology in San Antonio, TX
RELATED REPORTS & OPTIONS
Psychology
San Antonio
Compare Zip Codes
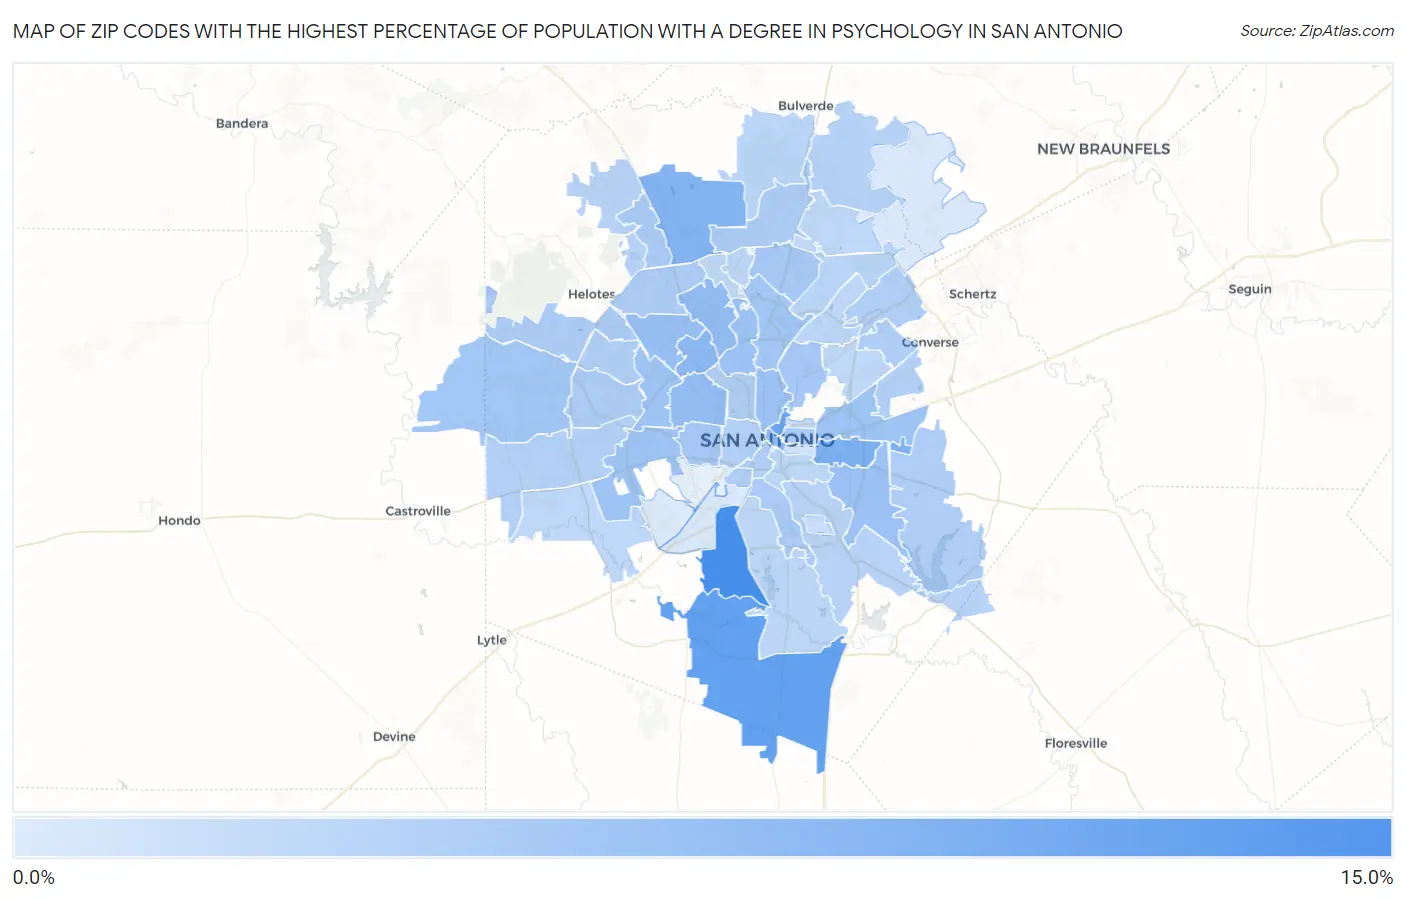
Map of Zip Codes with the Highest Percentage of Population with a Degree in Psychology in San Antonio
0.68%
14.9%
Zip Codes with the Highest Percentage of Population with a Degree in Psychology in San Antonio, TX
| Zip Code | % Graduates | vs State | vs National | |
| 1. | 78224 | 14.9% | 4.3%(+10.6)#44 | 5.1%(+9.85)#1,145 |
| 2. | 78264 | 12.2% | 4.3%(+7.92)#69 | 5.1%(+7.17)#1,666 |
| 3. | 78215 | 11.0% | 4.3%(+6.70)#90 | 5.1%(+5.94)#2,062 |
| 4. | 78220 | 9.8% | 4.3%(+5.45)#108 | 5.1%(+4.70)#2,636 |
| 5. | 78257 | 9.0% | 4.3%(+4.71)#128 | 5.1%(+3.96)#3,122 |
| 6. | 78229 | 8.2% | 4.3%(+3.88)#171 | 5.1%(+3.12)#3,935 |
| 7. | 78205 | 8.1% | 4.3%(+3.80)#177 | 5.1%(+3.05)#4,019 |
| 8. | 78228 | 7.5% | 4.3%(+3.20)#200 | 5.1%(+2.45)#4,823 |
| 9. | 78230 | 7.4% | 4.3%(+3.08)#207 | 5.1%(+2.32)#5,018 |
| 10. | 78240 | 7.0% | 4.3%(+2.72)#226 | 5.1%(+1.97)#5,595 |
| 11. | 78213 | 6.7% | 4.3%(+2.43)#241 | 5.1%(+1.68)#6,166 |
| 12. | 78222 | 6.7% | 4.3%(+2.42)#243 | 5.1%(+1.67)#6,177 |
| 13. | 78212 | 6.5% | 4.3%(+2.19)#259 | 5.1%(+1.44)#6,670 |
| 14. | 78238 | 6.4% | 4.3%(+2.12)#267 | 5.1%(+1.37)#6,841 |
| 15. | 78227 | 6.4% | 4.3%(+2.12)#268 | 5.1%(+1.37)#6,846 |
| 16. | 78219 | 6.3% | 4.3%(+2.00)#281 | 5.1%(+1.25)#7,132 |
| 17. | 78253 | 5.9% | 4.3%(+1.64)#318 | 5.1%(+0.886)#8,146 |
| 18. | 78216 | 5.9% | 4.3%(+1.59)#325 | 5.1%(+0.839)#8,283 |
| 19. | 78237 | 5.8% | 4.3%(+1.48)#342 | 5.1%(+0.729)#8,640 |
| 20. | 78232 | 5.8% | 4.3%(+1.48)#344 | 5.1%(+0.724)#8,657 |
| 21. | 78209 | 5.8% | 4.3%(+1.47)#345 | 5.1%(+0.718)#8,672 |
| 22. | 78202 | 5.3% | 4.3%(+0.977)#414 | 5.1%(+0.224)#10,245 |
| 23. | 78214 | 5.2% | 4.3%(+0.928)#423 | 5.1%(+0.176)#10,444 |
| 24. | 78256 | 5.2% | 4.3%(+0.917)#425 | 5.1%(+0.164)#10,484 |
| 25. | 78254 | 5.2% | 4.3%(+0.869)#435 | 5.1%(+0.116)#10,656 |
| 26. | 78251 | 5.0% | 4.3%(+0.751)#455 | 5.1%(-0.001)#11,075 |
| 27. | 78258 | 5.0% | 4.3%(+0.736)#458 | 5.1%(-0.017)#11,134 |
| 28. | 78249 | 5.0% | 4.3%(+0.722)#463 | 5.1%(-0.031)#11,197 |
| 29. | 78263 | 4.9% | 4.3%(+0.604)#484 | 5.1%(-0.148)#11,625 |
| 30. | 78225 | 4.8% | 4.3%(+0.470)#513 | 5.1%(-0.282)#12,060 |
| 31. | 78239 | 4.7% | 4.3%(+0.407)#518 | 5.1%(-0.345)#12,296 |
| 32. | 78201 | 4.7% | 4.3%(+0.391)#520 | 5.1%(-0.361)#12,362 |
| 33. | 78204 | 4.7% | 4.3%(+0.368)#526 | 5.1%(-0.384)#12,448 |
| 34. | 78250 | 4.6% | 4.3%(+0.341)#536 | 5.1%(-0.412)#12,558 |
| 35. | 78233 | 4.6% | 4.3%(+0.276)#548 | 5.1%(-0.476)#12,826 |
| 36. | 78207 | 4.4% | 4.3%(+0.134)#585 | 5.1%(-0.619)#13,369 |
| 37. | 78244 | 4.4% | 4.3%(+0.114)#594 | 5.1%(-0.638)#13,432 |
| 38. | 78245 | 4.3% | 4.3%(+0.028)#614 | 5.1%(-0.725)#13,758 |
| 39. | 78261 | 4.1% | 4.3%(-0.156)#672 | 5.1%(-0.908)#14,419 |
| 40. | 78255 | 4.1% | 4.3%(-0.247)#694 | 5.1%(-0.999)#14,742 |
| 41. | 78223 | 4.0% | 4.3%(-0.282)#703 | 5.1%(-1.03)#14,864 |
| 42. | 78260 | 3.9% | 4.3%(-0.427)#754 | 5.1%(-1.18)#15,376 |
| 43. | 78247 | 3.7% | 4.3%(-0.578)#793 | 5.1%(-1.33)#15,886 |
| 44. | 78217 | 3.7% | 4.3%(-0.616)#808 | 5.1%(-1.37)#16,023 |
| 45. | 78210 | 3.6% | 4.3%(-0.665)#820 | 5.1%(-1.42)#16,213 |
| 46. | 78248 | 3.5% | 4.3%(-0.776)#842 | 5.1%(-1.53)#16,621 |
| 47. | 78221 | 3.5% | 4.3%(-0.791)#849 | 5.1%(-1.54)#16,679 |
| 48. | 78252 | 3.4% | 4.3%(-0.899)#876 | 5.1%(-1.65)#17,003 |
| 49. | 78218 | 3.4% | 4.3%(-0.936)#884 | 5.1%(-1.69)#17,110 |
| 50. | 78259 | 3.4% | 4.3%(-0.943)#886 | 5.1%(-1.70)#17,139 |
| 51. | 78231 | 3.3% | 4.3%(-1.02)#899 | 5.1%(-1.77)#17,352 |
| 52. | 78208 | 2.6% | 4.3%(-1.68)#1,039 | 5.1%(-2.43)#19,303 |
| 53. | 78235 | 2.4% | 4.3%(-1.87)#1,069 | 5.1%(-2.62)#19,796 |
| 54. | 78203 | 1.6% | 4.3%(-2.66)#1,199 | 5.1%(-3.42)#21,553 |
| 55. | 78211 | 0.83% | 4.3%(-3.47)#1,289 | 5.1%(-4.22)#22,900 |
| 56. | 78266 | 0.81% | 4.3%(-3.49)#1,291 | 5.1%(-4.24)#22,923 |
| 57. | 78242 | 0.68% | 4.3%(-3.62)#1,303 | 5.1%(-4.37)#23,086 |
1
Common Questions
What are the Top 10 Zip Codes with the Highest Percentage of Population with a Degree in Psychology in San Antonio, TX?
Top 10 Zip Codes with the Highest Percentage of Population with a Degree in Psychology in San Antonio, TX are:
What zip code has the Highest Percentage of Population with a Degree in Psychology in San Antonio, TX?
78224 has the Highest Percentage of Population with a Degree in Psychology in San Antonio, TX with 14.9%.
What is the Percentage of Population with a Degree in Psychology in San Antonio, TX?
Percentage of Population with a Degree in Psychology in San Antonio is 5.4%.
What is the Percentage of Population with a Degree in Psychology in Texas?
Percentage of Population with a Degree in Psychology in Texas is 4.3%.
What is the Percentage of Population with a Degree in Psychology in the United States?
Percentage of Population with a Degree in Psychology in the United States is 5.1%.