Zip Codes with the Highest Percentage of Families with Income Above $200,000 in San Antonio, TX
RELATED REPORTS & OPTIONS
Family Income | $200k+
San Antonio
Compare Zip Codes
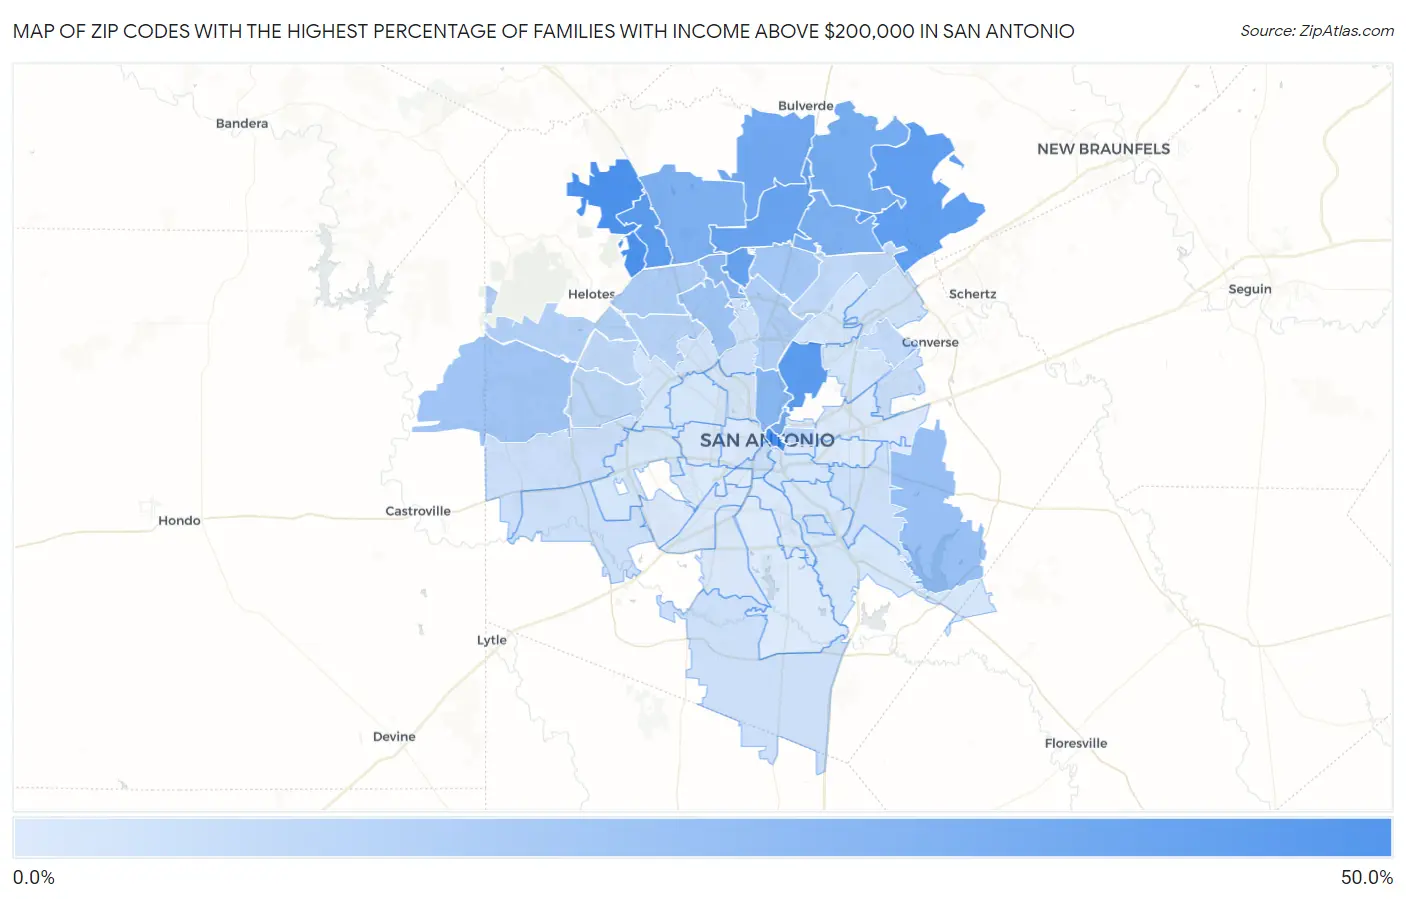
Map of Zip Codes with the Highest Percentage of Families with Income Above $200,000 in San Antonio
0.50%
41.9%
Zip Codes with the Highest Percentage of Families with Income Above $200,000 in San Antonio, TX
| Zip Code | Families with Income > $200k | vs State | vs National | |
| 1. | 78205 | 41.9% | 13.5%(+28.4)#48 | 14.8%(+27.1)#1,152 |
| 2. | 78255 | 40.6% | 13.5%(+27.1)#53 | 14.8%(+25.8)#1,266 |
| 3. | 78209 | 35.6% | 13.5%(+22.1)#78 | 14.8%(+20.8)#1,766 |
| 4. | 78256 | 35.5% | 13.5%(+22.0)#79 | 14.8%(+20.7)#1,782 |
| 5. | 78266 | 34.2% | 13.5%(+20.7)#90 | 14.8%(+19.4)#1,937 |
| 6. | 78248 | 31.6% | 13.5%(+18.1)#106 | 14.8%(+16.8)#2,285 |
| 7. | 78258 | 30.9% | 13.5%(+17.4)#110 | 14.8%(+16.1)#2,383 |
| 8. | 78260 | 29.3% | 13.5%(+15.8)#124 | 14.8%(+14.5)#2,620 |
| 9. | 78215 | 27.9% | 13.5%(+14.4)#142 | 14.8%(+13.1)#2,881 |
| 10. | 78261 | 27.8% | 13.5%(+14.3)#143 | 14.8%(+13.0)#2,891 |
| 11. | 78257 | 25.8% | 13.5%(+12.3)#163 | 14.8%(+11.0)#3,288 |
| 12. | 78259 | 25.4% | 13.5%(+11.9)#168 | 14.8%(+10.6)#3,364 |
| 13. | 78212 | 22.4% | 13.5%(+8.90)#210 | 14.8%(+7.60)#4,109 |
| 14. | 78231 | 20.4% | 13.5%(+6.90)#242 | 14.8%(+5.60)#4,689 |
| 15. | 78263 | 18.1% | 13.5%(+4.60)#282 | 14.8%(+3.30)#5,539 |
| 16. | 78230 | 16.0% | 13.5%(+2.50)#322 | 14.8%(+1.20)#6,441 |
| 17. | 78253 | 15.6% | 13.5%(+2.10)#335 | 14.8%(+0.800)#6,624 |
| 18. | 78232 | 14.8% | 13.5%(+1.30)#369 | 14.8%(=0.000)#7,082 |
| 19. | 78249 | 12.3% | 13.5%(-1.20)#478 | 14.8%(-2.50)#8,709 |
| 20. | 78216 | 11.2% | 13.5%(-2.30)#537 | 14.8%(-3.60)#9,614 |
| 21. | 78254 | 10.7% | 13.5%(-2.80)#582 | 14.8%(-4.10)#10,086 |
| 22. | 78240 | 9.9% | 13.5%(-3.60)#645 | 14.8%(-4.90)#10,887 |
| 23. | 78202 | 9.5% | 13.5%(-4.00)#673 | 14.8%(-5.30)#11,332 |
| 24. | 78251 | 8.4% | 13.5%(-5.10)#753 | 14.8%(-6.40)#12,625 |
| 25. | 78247 | 7.7% | 13.5%(-5.80)#810 | 14.8%(-7.10)#13,576 |
| 26. | 78250 | 7.5% | 13.5%(-6.00)#829 | 14.8%(-7.30)#13,858 |
| 27. | 78239 | 7.2% | 13.5%(-6.30)#865 | 14.8%(-7.60)#14,336 |
| 28. | 78204 | 5.3% | 13.5%(-8.20)#1,039 | 14.8%(-9.50)#17,819 |
| 29. | 78244 | 5.2% | 13.5%(-8.30)#1,056 | 14.8%(-9.60)#17,987 |
| 30. | 78245 | 5.0% | 13.5%(-8.50)#1,083 | 14.8%(-9.80)#18,389 |
| 31. | 78213 | 4.5% | 13.5%(-9.00)#1,140 | 14.8%(-10.3)#19,369 |
| 32. | 78264 | 4.5% | 13.5%(-9.00)#1,145 | 14.8%(-10.3)#19,410 |
| 33. | 78252 | 4.2% | 13.5%(-9.30)#1,193 | 14.8%(-10.6)#20,012 |
| 34. | 78222 | 4.1% | 13.5%(-9.40)#1,203 | 14.8%(-10.7)#20,193 |
| 35. | 78233 | 3.7% | 13.5%(-9.80)#1,248 | 14.8%(-11.1)#21,055 |
| 36. | 78235 | 3.5% | 13.5%(-10.00)#1,284 | 14.8%(-11.3)#21,572 |
| 37. | 78229 | 3.1% | 13.5%(-10.4)#1,317 | 14.8%(-11.7)#22,257 |
| 38. | 78210 | 2.8% | 13.5%(-10.7)#1,359 | 14.8%(-12.0)#22,893 |
| 39. | 78217 | 2.8% | 13.5%(-10.7)#1,360 | 14.8%(-12.0)#22,895 |
| 40. | 78238 | 2.8% | 13.5%(-10.7)#1,363 | 14.8%(-12.0)#22,900 |
| 41. | 78218 | 2.7% | 13.5%(-10.8)#1,376 | 14.8%(-12.1)#23,083 |
| 42. | 78201 | 2.3% | 13.5%(-11.2)#1,428 | 14.8%(-12.5)#23,893 |
| 43. | 78228 | 2.2% | 13.5%(-11.3)#1,438 | 14.8%(-12.6)#24,071 |
| 44. | 78223 | 1.9% | 13.5%(-11.6)#1,458 | 14.8%(-12.9)#24,609 |
| 45. | 78227 | 1.9% | 13.5%(-11.6)#1,459 | 14.8%(-12.9)#24,613 |
| 46. | 78203 | 1.8% | 13.5%(-11.7)#1,480 | 14.8%(-13.0)#24,823 |
| 47. | 78224 | 1.6% | 13.5%(-11.9)#1,498 | 14.8%(-13.2)#25,162 |
| 48. | 78237 | 1.4% | 13.5%(-12.1)#1,514 | 14.8%(-13.4)#25,459 |
| 49. | 78214 | 1.3% | 13.5%(-12.2)#1,521 | 14.8%(-13.5)#25,621 |
| 50. | 78219 | 1.3% | 13.5%(-12.2)#1,524 | 14.8%(-13.5)#25,629 |
| 51. | 78208 | 1.2% | 13.5%(-12.3)#1,538 | 14.8%(-13.6)#25,818 |
| 52. | 78207 | 1.0% | 13.5%(-12.5)#1,548 | 14.8%(-13.8)#26,069 |
| 53. | 78211 | 0.90% | 13.5%(-12.6)#1,561 | 14.8%(-13.9)#26,211 |
| 54. | 78242 | 0.80% | 13.5%(-12.7)#1,567 | 14.8%(-14.0)#26,342 |
| 55. | 78225 | 0.60% | 13.5%(-12.9)#1,591 | 14.8%(-14.2)#26,596 |
| 56. | 78226 | 0.60% | 13.5%(-12.9)#1,593 | 14.8%(-14.2)#26,603 |
| 57. | 78221 | 0.50% | 13.5%(-13.0)#1,598 | 14.8%(-14.3)#26,700 |
| 58. | 78220 | 0.50% | 13.5%(-13.0)#1,599 | 14.8%(-14.3)#26,708 |
1
Common Questions
What are the Top 10 Zip Codes with the Highest Percentage of Families with Income Above $200,000 in San Antonio, TX?
Top 10 Zip Codes with the Highest Percentage of Families with Income Above $200,000 in San Antonio, TX are:
What zip code has the Highest Percentage of Families with Income Above $200,000 in San Antonio, TX?
78205 has the Highest Percentage of Families with Income Above $200,000 in San Antonio, TX with 41.9%.
What is the Percentage of Families with Income Above $200,000 in San Antonio, TX?
Percentage of Families with Income Above $200,000 in San Antonio is 7.7%.
What is the Percentage of Families with Income Above $200,000 in Texas?
Percentage of Families with Income Above $200,000 in Texas is 13.5%.
What is the Percentage of Families with Income Above $200,000 in the United States?
Percentage of Families with Income Above $200,000 in the United States is 14.8%.