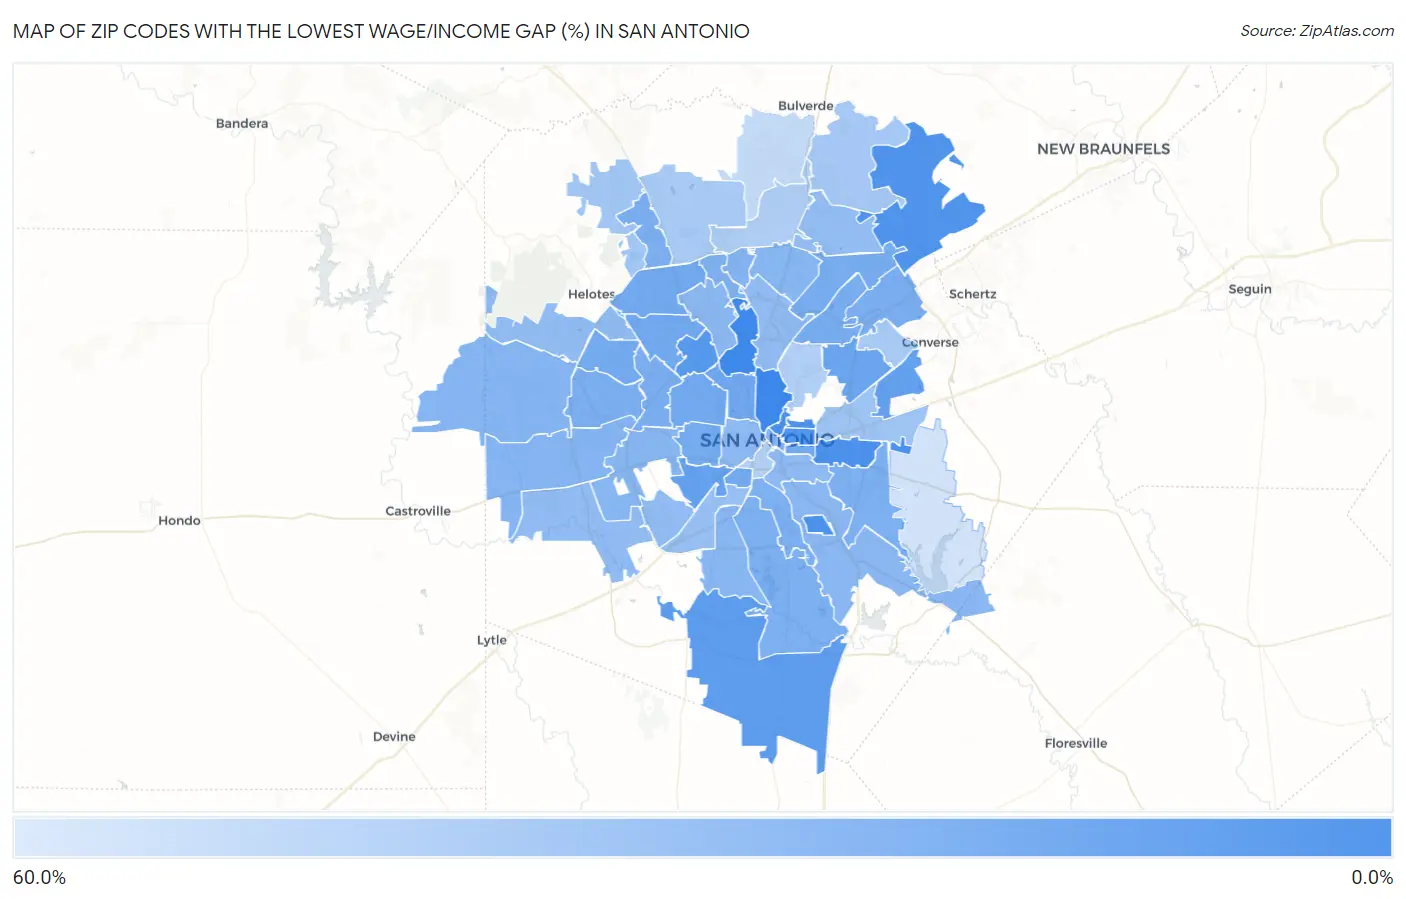
Zip Codes with the Lowest Wage/Income Gap (%) in San Antonio, TX
RELATED REPORTS & OPTIONS
Lowest Wage/Income Gap (%)
San Antonio
Compare Zip Codes
Map of Zip Codes with the Lowest Wage/Income Gap (%) in San Antonio
52.0%
2.4%
Zip Codes with the Lowest Wage/Income Gap (%) in San Antonio, TX
| Zip Code | Wage/Income Gap (%) | vs State | vs National | |
| 1. | 78212 | 2.4% | 29.4%(-0.269)#15 | 28.0%(-0.255)#627 |
| 2. | 78213 | 3.3% | 29.4%(-0.261)#22 | 28.0%(-0.247)#847 |
| 3. | 78235 | 6.6% | 29.4%(-0.227)#52 | 28.0%(-0.214)#1,763 |
| 4. | 78215 | 6.7% | 29.4%(-0.226)#56 | 28.0%(-0.212)#1,796 |
| 5. | 78220 | 6.8% | 29.4%(-0.225)#60 | 28.0%(-0.211)#1,830 |
| 6. | 78266 | 7.5% | 29.4%(-0.219)#68 | 28.0%(-0.205)#2,033 |
| 7. | 78208 | 7.5% | 29.4%(-0.218)#70 | 28.0%(-0.204)#2,051 |
| 8. | 78202 | 8.9% | 29.4%(-0.204)#86 | 28.0%(-0.191)#2,466 |
| 9. | 78229 | 10.4% | 29.4%(-0.190)#106 | 28.0%(-0.176)#2,977 |
| 10. | 78264 | 12.3% | 29.4%(-0.171)#134 | 28.0%(-0.157)#3,629 |
| 11. | 78244 | 13.9% | 29.4%(-0.155)#161 | 28.0%(-0.141)#4,219 |
| 12. | 78226 | 14.3% | 29.4%(-0.151)#166 | 28.0%(-0.137)#4,369 |
| 13. | 78218 | 16.6% | 29.4%(-0.128)#217 | 28.0%(-0.114)#5,347 |
| 14. | 78201 | 18.1% | 29.4%(-0.113)#254 | 28.0%(-0.099)#6,095 |
| 15. | 78228 | 18.3% | 29.4%(-0.111)#265 | 28.0%(-0.097)#6,232 |
| 16. | 78249 | 18.4% | 29.4%(-0.110)#269 | 28.0%(-0.096)#6,280 |
| 17. | 78225 | 18.6% | 29.4%(-0.108)#274 | 28.0%(-0.094)#6,358 |
| 18. | 78203 | 18.7% | 29.4%(-0.107)#280 | 28.0%(-0.093)#6,448 |
| 19. | 78240 | 18.8% | 29.4%(-0.105)#284 | 28.0%(-0.091)#6,516 |
| 20. | 78250 | 18.9% | 29.4%(-0.104)#288 | 28.0%(-0.091)#6,558 |
| 21. | 78237 | 19.0% | 29.4%(-0.104)#289 | 28.0%(-0.090)#6,580 |
| 22. | 78217 | 19.6% | 29.4%(-0.098)#301 | 28.0%(-0.084)#6,911 |
| 23. | 78247 | 19.9% | 29.4%(-0.095)#311 | 28.0%(-0.081)#7,077 |
| 24. | 78233 | 20.5% | 29.4%(-0.089)#342 | 28.0%(-0.075)#7,492 |
| 25. | 78238 | 20.8% | 29.4%(-0.085)#351 | 28.0%(-0.071)#7,685 |
| 26. | 78256 | 21.7% | 29.4%(-0.077)#372 | 28.0%(-0.063)#8,219 |
| 27. | 78251 | 21.7% | 29.4%(-0.076)#376 | 28.0%(-0.063)#8,267 |
| 28. | 78214 | 21.9% | 29.4%(-0.074)#383 | 28.0%(-0.061)#8,404 |
| 29. | 78221 | 22.0% | 29.4%(-0.073)#389 | 28.0%(-0.059)#8,476 |
| 30. | 78222 | 22.1% | 29.4%(-0.073)#394 | 28.0%(-0.059)#8,520 |
| 31. | 78231 | 23.3% | 29.4%(-0.061)#424 | 28.0%(-0.047)#9,250 |
| 32. | 78248 | 23.6% | 29.4%(-0.058)#436 | 28.0%(-0.044)#9,499 |
| 33. | 78205 | 23.9% | 29.4%(-0.054)#449 | 28.0%(-0.040)#9,720 |
| 34. | 78245 | 24.5% | 29.4%(-0.049)#476 | 28.0%(-0.035)#10,115 |
| 35. | 78253 | 24.6% | 29.4%(-0.048)#483 | 28.0%(-0.034)#10,182 |
| 36. | 78227 | 25.1% | 29.4%(-0.043)#507 | 28.0%(-0.029)#10,467 |
| 37. | 78232 | 25.2% | 29.4%(-0.042)#512 | 28.0%(-0.028)#10,530 |
| 38. | 78224 | 25.3% | 29.4%(-0.041)#519 | 28.0%(-0.027)#10,609 |
| 39. | 78223 | 25.6% | 29.4%(-0.037)#536 | 28.0%(-0.023)#10,870 |
| 40. | 78230 | 25.7% | 29.4%(-0.037)#537 | 28.0%(-0.023)#10,909 |
| 41. | 78207 | 27.4% | 29.4%(-0.020)#597 | 28.0%(-0.006)#12,152 |
| 42. | 78210 | 27.7% | 29.4%(-0.016)#605 | 28.0%(-0.003)#12,385 |
| 43. | 78254 | 27.9% | 29.4%(-0.014)#618 | 28.0%(-0.001)#12,516 |
| 44. | 78242 | 28.1% | 29.4%(-0.013)#628 | 28.0%(+0.001)#12,654 |
| 45. | 78216 | 28.3% | 29.4%(-0.011)#637 | 28.0%(+0.003)#12,806 |
| 46. | 78252 | 28.6% | 29.4%(-0.008)#653 | 28.0%(+0.006)#13,042 |
| 47. | 78259 | 29.0% | 29.4%(-0.004)#669 | 28.0%(+0.010)#13,350 |
| 48. | 78211 | 30.4% | 29.4%(+0.010)#713 | 28.0%(+0.024)#14,335 |
| 49. | 78219 | 32.6% | 29.4%(+0.033)#803 | 28.0%(+0.047)#15,883 |
| 50. | 78255 | 34.3% | 29.4%(+0.049)#876 | 28.0%(+0.063)#17,034 |
| 51. | 78261 | 35.1% | 29.4%(+0.057)#918 | 28.0%(+0.071)#17,601 |
| 52. | 78257 | 36.3% | 29.4%(+0.069)#965 | 28.0%(+0.083)#18,393 |
| 53. | 78239 | 36.4% | 29.4%(+0.070)#973 | 28.0%(+0.084)#18,462 |
| 54. | 78258 | 39.1% | 29.4%(+0.097)#1,096 | 28.0%(+0.111)#20,143 |
| 55. | 78209 | 39.3% | 29.4%(+0.100)#1,104 | 28.0%(+0.113)#20,292 |
| 56. | 78204 | 39.6% | 29.4%(+0.102)#1,114 | 28.0%(+0.116)#20,447 |
| 57. | 78260 | 46.7% | 29.4%(+0.173)#1,339 | 28.0%(+0.187)#23,688 |
| 58. | 78263 | 52.0% | 29.4%(+0.226)#1,462 | 28.0%(+0.240)#25,356 |
1
Common Questions
What are the Top 10 Zip Codes with the Lowest Wage/Income Gap (%) in San Antonio, TX?
Top 10 Zip Codes with the Lowest Wage/Income Gap (%) in San Antonio, TX are:
What zip code has the Lowest Wage/Income Gap (%) in San Antonio, TX?
78212 has the Lowest Wage/Income Gap (%) in San Antonio, TX with 2.4%.
What is the Wage / Income Gap in Percentage Terms in San Antonio, TX?
Wage / Income Gap in Percentage Terms in San Antonio is 19.9%.
What is the Wage / Income Gap in Percentage Terms in Texas?
Wage / Income Gap in Percentage Terms in Texas is 29.4%.
What is the Wage / Income Gap in Percentage Terms in the United States?
Wage / Income Gap in Percentage Terms in the United States is 28.0%.