Zip Codes with the Highest Percentage of Scotch-Irish Population in San Antonio, TX
RELATED REPORTS & OPTIONS
Scotch-Irish
San Antonio
Compare Zip Codes
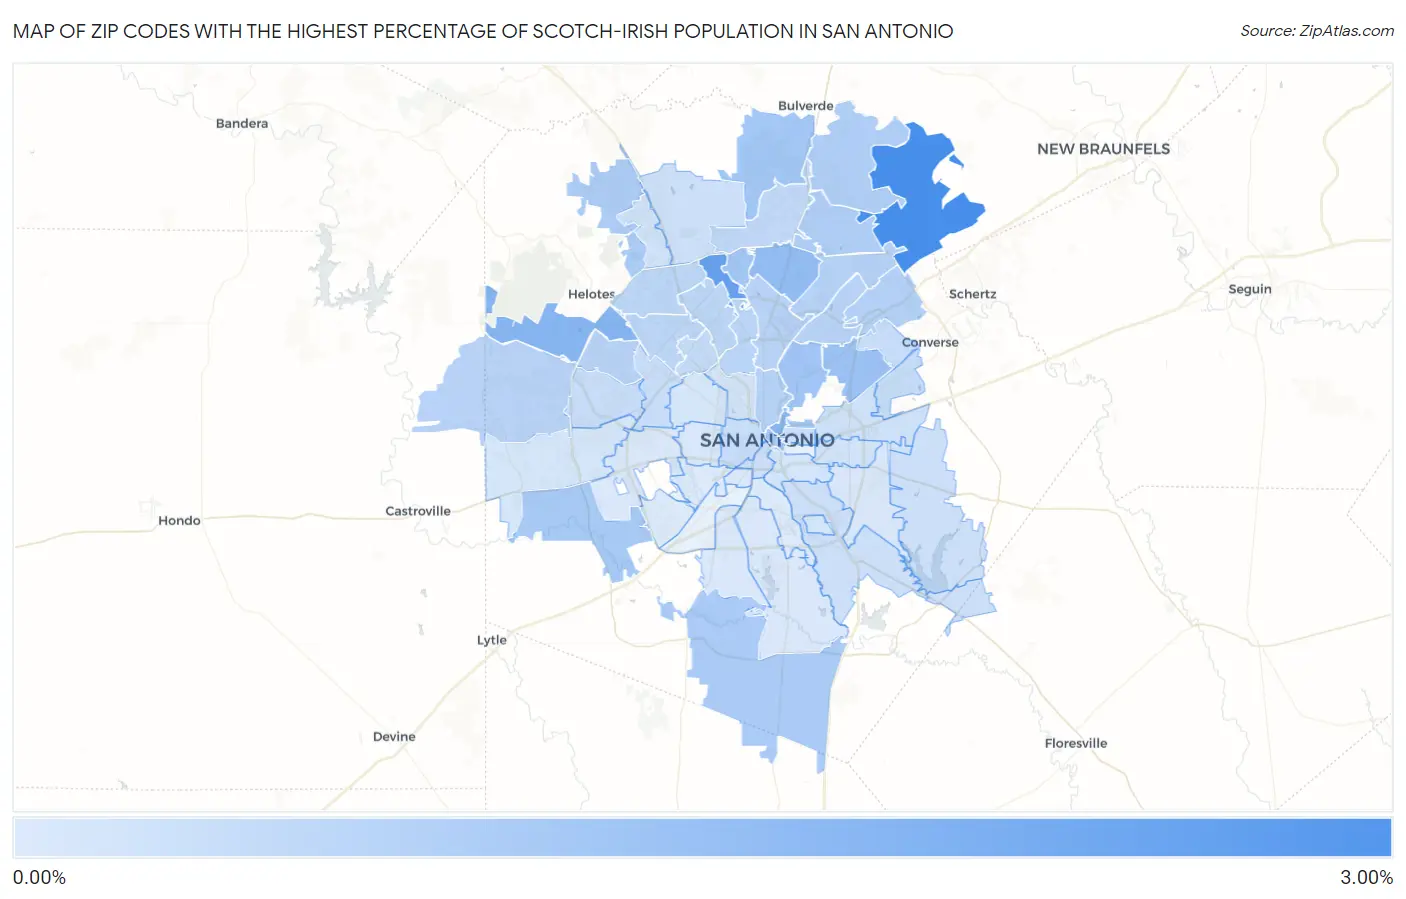
Map of Zip Codes with the Highest Percentage of Scotch-Irish Population in San Antonio
0.014%
2.91%
Zip Codes with the Highest Percentage of Scotch-Irish Population in San Antonio, TX
| Zip Code | Scotch-Irish | vs State | vs National | |
| 1. | 78266 | 2.91% | 0.79%(+2.12)#118 | 0.82%(+2.09)#2,073 |
| 2. | 78231 | 2.26% | 0.79%(+1.47)#180 | 0.82%(+1.44)#3,129 |
| 3. | 78254 | 1.67% | 0.79%(+0.887)#295 | 0.82%(+0.855)#5,035 |
| 4. | 78215 | 1.61% | 0.79%(+0.823)#319 | 0.82%(+0.792)#5,317 |
| 5. | 78232 | 1.45% | 0.79%(+0.660)#380 | 0.82%(+0.628)#6,235 |
| 6. | 78218 | 1.29% | 0.79%(+0.504)#442 | 0.82%(+0.472)#7,281 |
| 7. | 78209 | 1.14% | 0.79%(+0.356)#511 | 0.82%(+0.324)#8,386 |
| 8. | 78260 | 1.13% | 0.79%(+0.343)#522 | 0.82%(+0.311)#8,507 |
| 9. | 78248 | 1.10% | 0.79%(+0.314)#539 | 0.82%(+0.282)#8,744 |
| 10. | 78205 | 1.09% | 0.79%(+0.305)#543 | 0.82%(+0.273)#8,820 |
| 11. | 78208 | 1.08% | 0.79%(+0.289)#555 | 0.82%(+0.257)#8,976 |
| 12. | 78252 | 1.02% | 0.79%(+0.232)#595 | 0.82%(+0.200)#9,562 |
| 13. | 78264 | 0.97% | 0.79%(+0.186)#631 | 0.82%(+0.155)#10,048 |
| 14. | 78255 | 0.96% | 0.79%(+0.173)#647 | 0.82%(+0.141)#10,187 |
| 15. | 78259 | 0.89% | 0.79%(+0.106)#689 | 0.82%(+0.074)#10,924 |
| 16. | 78261 | 0.88% | 0.79%(+0.096)#695 | 0.82%(+0.064)#11,032 |
| 17. | 78233 | 0.82% | 0.79%(+0.030)#748 | 0.82%(-0.002)#11,850 |
| 18. | 78247 | 0.78% | 0.79%(-0.010)#781 | 0.82%(-0.042)#12,365 |
| 19. | 78212 | 0.77% | 0.79%(-0.017)#786 | 0.82%(-0.049)#12,437 |
| 20. | 78253 | 0.73% | 0.79%(-0.056)#825 | 0.82%(-0.088)#12,985 |
| 21. | 78216 | 0.72% | 0.79%(-0.062)#832 | 0.82%(-0.093)#13,081 |
| 22. | 78217 | 0.70% | 0.79%(-0.083)#846 | 0.82%(-0.115)#13,366 |
| 23. | 78250 | 0.70% | 0.79%(-0.089)#852 | 0.82%(-0.121)#13,445 |
| 24. | 78213 | 0.69% | 0.79%(-0.096)#859 | 0.82%(-0.128)#13,541 |
| 25. | 78230 | 0.65% | 0.79%(-0.135)#883 | 0.82%(-0.167)#14,093 |
| 26. | 78240 | 0.63% | 0.79%(-0.153)#898 | 0.82%(-0.185)#14,353 |
| 27. | 78249 | 0.61% | 0.79%(-0.176)#920 | 0.82%(-0.207)#14,669 |
| 28. | 78258 | 0.54% | 0.79%(-0.242)#975 | 0.82%(-0.274)#15,694 |
| 29. | 78229 | 0.48% | 0.79%(-0.302)#1,033 | 0.82%(-0.334)#16,697 |
| 30. | 78244 | 0.44% | 0.79%(-0.344)#1,080 | 0.82%(-0.376)#17,345 |
| 31. | 78251 | 0.41% | 0.79%(-0.372)#1,096 | 0.82%(-0.404)#17,847 |
| 32. | 78207 | 0.41% | 0.79%(-0.375)#1,099 | 0.82%(-0.407)#17,906 |
| 33. | 78239 | 0.40% | 0.79%(-0.386)#1,107 | 0.82%(-0.418)#18,071 |
| 34. | 78238 | 0.39% | 0.79%(-0.396)#1,118 | 0.82%(-0.428)#18,242 |
| 35. | 78202 | 0.38% | 0.79%(-0.404)#1,126 | 0.82%(-0.436)#18,383 |
| 36. | 78204 | 0.35% | 0.79%(-0.435)#1,151 | 0.82%(-0.467)#18,874 |
| 37. | 78223 | 0.34% | 0.79%(-0.448)#1,169 | 0.82%(-0.480)#19,102 |
| 38. | 78257 | 0.34% | 0.79%(-0.449)#1,170 | 0.82%(-0.481)#19,110 |
| 39. | 78263 | 0.34% | 0.79%(-0.449)#1,171 | 0.82%(-0.481)#19,116 |
| 40. | 78219 | 0.29% | 0.79%(-0.500)#1,215 | 0.82%(-0.532)#19,968 |
| 41. | 78256 | 0.25% | 0.79%(-0.532)#1,245 | 0.82%(-0.564)#20,510 |
| 42. | 78220 | 0.22% | 0.79%(-0.561)#1,269 | 0.82%(-0.593)#21,014 |
| 43. | 78235 | 0.20% | 0.79%(-0.590)#1,296 | 0.82%(-0.622)#21,532 |
| 44. | 78210 | 0.19% | 0.79%(-0.597)#1,303 | 0.82%(-0.629)#21,645 |
| 45. | 78201 | 0.17% | 0.79%(-0.616)#1,321 | 0.82%(-0.648)#21,946 |
| 46. | 78228 | 0.15% | 0.79%(-0.632)#1,336 | 0.82%(-0.664)#22,239 |
| 47. | 78245 | 0.13% | 0.79%(-0.657)#1,353 | 0.82%(-0.689)#22,595 |
| 48. | 78222 | 0.088% | 0.79%(-0.698)#1,398 | 0.82%(-0.729)#23,196 |
| 49. | 78237 | 0.086% | 0.79%(-0.700)#1,400 | 0.82%(-0.732)#23,221 |
| 50. | 78221 | 0.077% | 0.79%(-0.709)#1,407 | 0.82%(-0.741)#23,327 |
| 51. | 78225 | 0.043% | 0.79%(-0.743)#1,429 | 0.82%(-0.774)#23,721 |
| 52. | 78224 | 0.043% | 0.79%(-0.743)#1,430 | 0.82%(-0.775)#23,725 |
| 53. | 78227 | 0.040% | 0.79%(-0.747)#1,433 | 0.82%(-0.778)#23,756 |
| 54. | 78214 | 0.022% | 0.79%(-0.764)#1,448 | 0.82%(-0.796)#23,899 |
| 55. | 78242 | 0.019% | 0.79%(-0.767)#1,450 | 0.82%(-0.799)#23,925 |
| 56. | 78226 | 0.014% | 0.79%(-0.772)#1,455 | 0.82%(-0.804)#23,963 |
1
Common Questions
What are the Top 10 Zip Codes with the Highest Percentage of Scotch-Irish Population in San Antonio, TX?
Top 10 Zip Codes with the Highest Percentage of Scotch-Irish Population in San Antonio, TX are:
What zip code has the Highest Percentage of Scotch-Irish Population in San Antonio, TX?
78266 has the Highest Percentage of Scotch-Irish Population in San Antonio, TX with 2.91%.
What is the Percentage of Scotch-Irish Population in San Antonio, TX?
Percentage of Scotch-Irish Population in San Antonio is 0.53%.
What is the Percentage of Scotch-Irish Population in Texas?
Percentage of Scotch-Irish Population in Texas is 0.79%.
What is the Percentage of Scotch-Irish Population in the United States?
Percentage of Scotch-Irish Population in the United States is 0.82%.