Zip Codes with the Highest Percentage of Population with a Degree in Physical and Health Sciences in San Antonio, TX
RELATED REPORTS & OPTIONS
Physical and Health Sciences
San Antonio
Compare Zip Codes
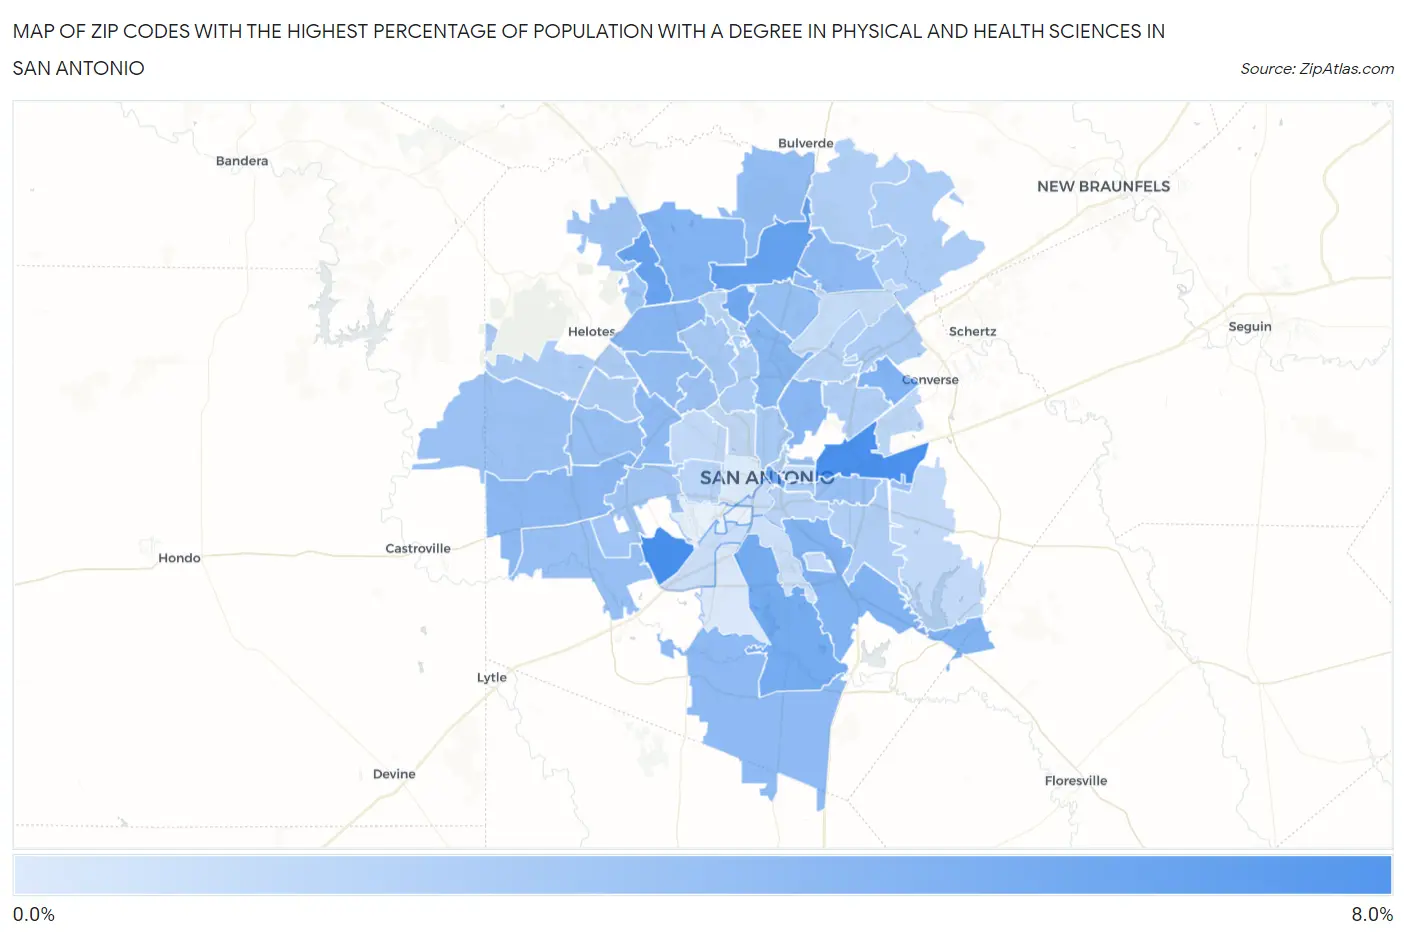
Map of Zip Codes with the Highest Percentage of Population with a Degree in Physical and Health Sciences in San Antonio
0.27%
6.9%
Zip Codes with the Highest Percentage of Population with a Degree in Physical and Health Sciences in San Antonio, TX
| Zip Code | % Graduates | vs State | vs National | |
| 1. | 78242 | 6.9% | 3.3%(+3.58)#177 | 3.1%(+3.80)#2,570 |
| 2. | 78219 | 6.8% | 3.3%(+3.47)#182 | 3.1%(+3.69)#2,634 |
| 3. | 78258 | 5.6% | 3.3%(+2.27)#255 | 3.1%(+2.49)#3,704 |
| 4. | 78256 | 5.5% | 3.3%(+2.15)#262 | 3.1%(+2.37)#3,871 |
| 5. | 78248 | 5.1% | 3.3%(+1.75)#289 | 3.1%(+1.97)#4,447 |
| 6. | 78205 | 5.0% | 3.3%(+1.66)#298 | 3.1%(+1.88)#4,583 |
| 7. | 78221 | 4.8% | 3.3%(+1.45)#321 | 3.1%(+1.67)#4,985 |
| 8. | 78257 | 4.3% | 3.3%(+1.03)#376 | 3.1%(+1.25)#5,871 |
| 9. | 78239 | 4.3% | 3.3%(+1.02)#381 | 3.1%(+1.24)#5,890 |
| 10. | 78223 | 4.3% | 3.3%(+0.990)#383 | 3.1%(+1.21)#5,942 |
| 11. | 78249 | 4.0% | 3.3%(+0.669)#437 | 3.1%(+0.889)#6,796 |
| 12. | 78216 | 4.0% | 3.3%(+0.648)#443 | 3.1%(+0.868)#6,853 |
| 13. | 78209 | 3.9% | 3.3%(+0.569)#459 | 3.1%(+0.789)#7,082 |
| 14. | 78245 | 3.8% | 3.3%(+0.484)#481 | 3.1%(+0.704)#7,357 |
| 15. | 78238 | 3.7% | 3.3%(+0.404)#498 | 3.1%(+0.624)#7,639 |
| 16. | 78264 | 3.7% | 3.3%(+0.368)#513 | 3.1%(+0.588)#7,755 |
| 17. | 78259 | 3.6% | 3.3%(+0.319)#526 | 3.1%(+0.539)#7,921 |
| 18. | 78240 | 3.5% | 3.3%(+0.131)#572 | 3.1%(+0.351)#8,612 |
| 19. | 78260 | 3.4% | 3.3%(+0.124)#574 | 3.1%(+0.344)#8,652 |
| 20. | 78232 | 3.4% | 3.3%(+0.035)#592 | 3.1%(+0.255)#8,980 |
| 21. | 78252 | 3.3% | 3.3%(-0.028)#606 | 3.1%(+0.192)#9,220 |
| 22. | 78220 | 3.3% | 3.3%(-0.069)#619 | 3.1%(+0.151)#9,388 |
| 23. | 78251 | 3.2% | 3.3%(-0.087)#622 | 3.1%(+0.132)#9,446 |
| 24. | 78229 | 3.1% | 3.3%(-0.180)#636 | 3.1%(+0.040)#9,813 |
| 25. | 78253 | 3.1% | 3.3%(-0.196)#641 | 3.1%(+0.024)#9,893 |
| 26. | 78208 | 3.1% | 3.3%(-0.224)#648 | 3.1%(-0.004)#9,995 |
| 27. | 78227 | 2.9% | 3.3%(-0.447)#707 | 3.1%(-0.227)#10,971 |
| 28. | 78255 | 2.9% | 3.3%(-0.459)#714 | 3.1%(-0.239)#11,022 |
| 29. | 78230 | 2.7% | 3.3%(-0.620)#756 | 3.1%(-0.400)#11,784 |
| 30. | 78212 | 2.6% | 3.3%(-0.720)#778 | 3.1%(-0.500)#12,242 |
| 31. | 78203 | 2.6% | 3.3%(-0.750)#792 | 3.1%(-0.530)#12,385 |
| 32. | 78213 | 2.4% | 3.3%(-0.915)#836 | 3.1%(-0.695)#13,171 |
| 33. | 78254 | 2.4% | 3.3%(-0.932)#846 | 3.1%(-0.712)#13,253 |
| 34. | 78233 | 2.4% | 3.3%(-0.945)#850 | 3.1%(-0.725)#13,315 |
| 35. | 78266 | 2.4% | 3.3%(-0.948)#851 | 3.1%(-0.728)#13,331 |
| 36. | 78250 | 2.3% | 3.3%(-0.985)#855 | 3.1%(-0.766)#13,512 |
| 37. | 78222 | 2.2% | 3.3%(-1.08)#876 | 3.1%(-0.859)#13,964 |
| 38. | 78261 | 2.2% | 3.3%(-1.11)#887 | 3.1%(-0.890)#14,096 |
| 39. | 78218 | 2.2% | 3.3%(-1.15)#901 | 3.1%(-0.929)#14,272 |
| 40. | 78215 | 2.0% | 3.3%(-1.31)#956 | 3.1%(-1.09)#15,064 |
| 41. | 78217 | 2.0% | 3.3%(-1.37)#971 | 3.1%(-1.15)#15,334 |
| 42. | 78210 | 1.9% | 3.3%(-1.45)#993 | 3.1%(-1.23)#15,657 |
| 43. | 78231 | 1.8% | 3.3%(-1.54)#1,019 | 3.1%(-1.32)#16,080 |
| 44. | 78237 | 1.7% | 3.3%(-1.58)#1,028 | 3.1%(-1.36)#16,257 |
| 45. | 78244 | 1.7% | 3.3%(-1.63)#1,044 | 3.1%(-1.41)#16,488 |
| 46. | 78235 | 1.5% | 3.3%(-1.82)#1,087 | 3.1%(-1.60)#17,307 |
| 47. | 78201 | 1.5% | 3.3%(-1.83)#1,089 | 3.1%(-1.61)#17,315 |
| 48. | 78263 | 1.4% | 3.3%(-1.89)#1,110 | 3.1%(-1.67)#17,598 |
| 49. | 78228 | 1.4% | 3.3%(-1.89)#1,111 | 3.1%(-1.67)#17,615 |
| 50. | 78202 | 1.4% | 3.3%(-1.94)#1,121 | 3.1%(-1.72)#17,808 |
| 51. | 78247 | 1.2% | 3.3%(-2.08)#1,147 | 3.1%(-1.86)#18,360 |
| 52. | 78211 | 1.1% | 3.3%(-2.21)#1,172 | 3.1%(-1.99)#18,848 |
| 53. | 78204 | 1.1% | 3.3%(-2.22)#1,173 | 3.1%(-2.00)#18,872 |
| 54. | 78214 | 1.00% | 3.3%(-2.32)#1,200 | 3.1%(-2.10)#19,263 |
| 55. | 78224 | 0.36% | 3.3%(-2.95)#1,285 | 3.1%(-2.73)#20,856 |
| 56. | 78207 | 0.27% | 3.3%(-3.05)#1,292 | 3.1%(-2.83)#20,973 |
1
Common Questions
What are the Top 10 Zip Codes with the Highest Percentage of Population with a Degree in Physical and Health Sciences in San Antonio, TX?
Top 10 Zip Codes with the Highest Percentage of Population with a Degree in Physical and Health Sciences in San Antonio, TX are:
What zip code has the Highest Percentage of Population with a Degree in Physical and Health Sciences in San Antonio, TX?
78242 has the Highest Percentage of Population with a Degree in Physical and Health Sciences in San Antonio, TX with 6.9%.
What is the Percentage of Population with a Degree in Physical and Health Sciences in San Antonio, TX?
Percentage of Population with a Degree in Physical and Health Sciences in San Antonio is 3.2%.
What is the Percentage of Population with a Degree in Physical and Health Sciences in Texas?
Percentage of Population with a Degree in Physical and Health Sciences in Texas is 3.3%.
What is the Percentage of Population with a Degree in Physical and Health Sciences in the United States?
Percentage of Population with a Degree in Physical and Health Sciences in the United States is 3.1%.