Zip Codes with the Highest Percentage of Self-Employed / Not Incorporated in San Antonio, TX
RELATED REPORTS & OPTIONS
Self-Employed / Not Incorporated
San Antonio
Compare Zip Codes
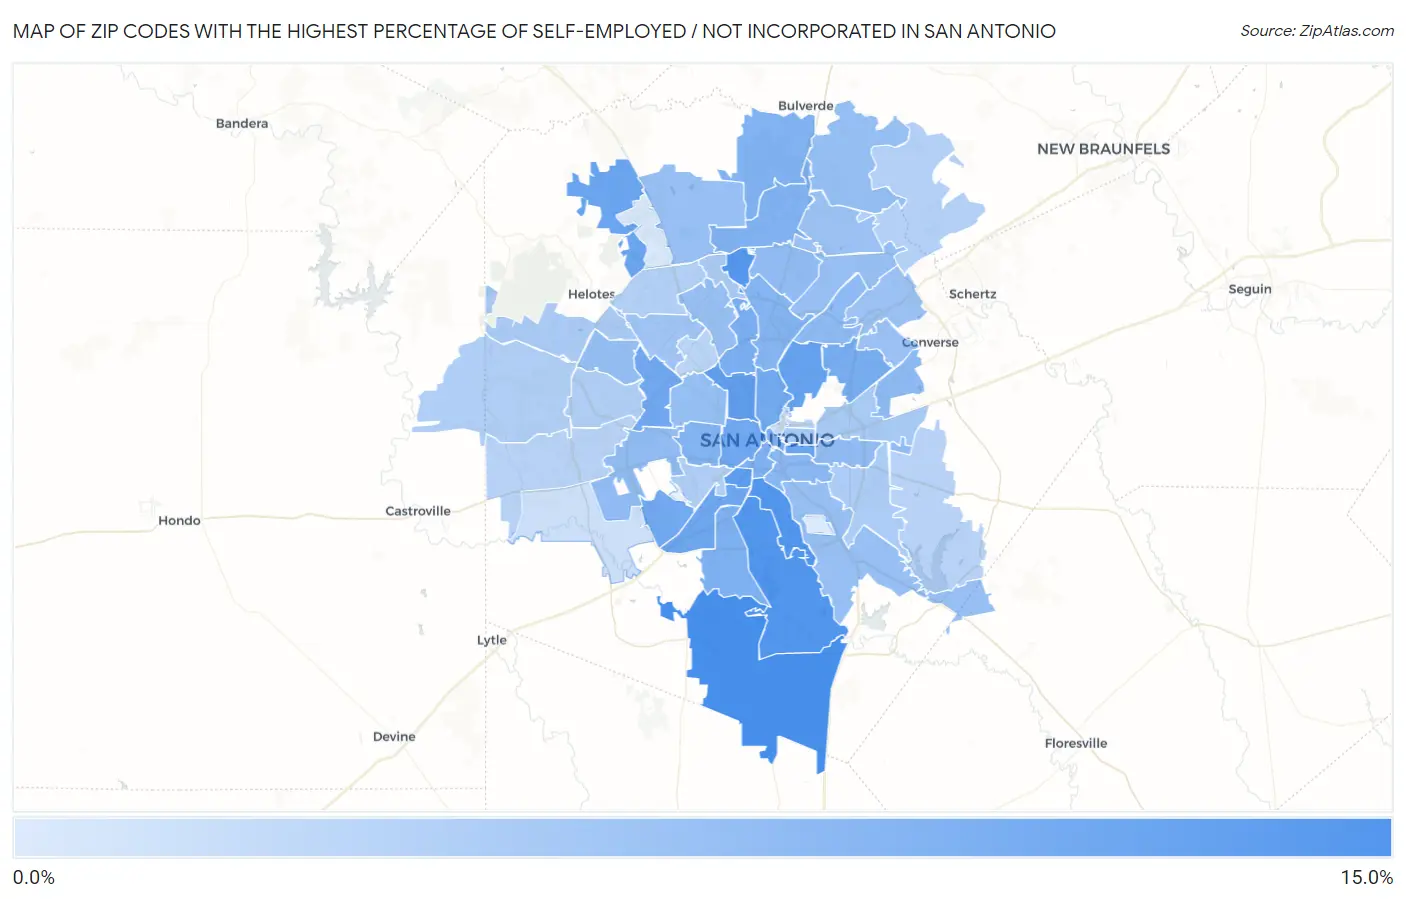
Map of Zip Codes with the Highest Percentage of Self-Employed / Not Incorporated in San Antonio
0.0%
15.0%
Zip Codes with the Highest Percentage of Self-Employed / Not Incorporated in San Antonio, TX
| Zip Code | % Self-Employed / Not Incorporated | vs State | vs National | |
| 1. | 78264 | 11.2% | 6.7%(+4.51)#359 | 5.8%(+5.43)#5,951 |
| 2. | 78214 | 10.4% | 6.7%(+3.72)#418 | 5.8%(+4.63)#6,830 |
| 3. | 78221 | 10.4% | 6.7%(+3.71)#420 | 5.8%(+4.63)#6,837 |
| 4. | 78248 | 10.3% | 6.7%(+3.61)#435 | 5.8%(+4.53)#6,953 |
| 5. | 78225 | 9.8% | 6.7%(+3.05)#491 | 5.8%(+3.97)#7,653 |
| 6. | 78201 | 9.5% | 6.7%(+2.73)#520 | 5.8%(+3.64)#8,065 |
| 7. | 78209 | 9.1% | 6.7%(+2.35)#565 | 5.8%(+3.26)#8,664 |
| 8. | 78203 | 8.9% | 6.7%(+2.17)#592 | 5.8%(+3.08)#8,965 |
| 9. | 78255 | 8.7% | 6.7%(+1.95)#623 | 5.8%(+2.87)#9,342 |
| 10. | 78211 | 8.5% | 6.7%(+1.77)#650 | 5.8%(+2.69)#9,652 |
| 11. | 78238 | 8.4% | 6.7%(+1.66)#670 | 5.8%(+2.58)#9,852 |
| 12. | 78207 | 8.3% | 6.7%(+1.58)#680 | 5.8%(+2.49)#10,048 |
| 13. | 78242 | 8.2% | 6.7%(+1.50)#688 | 5.8%(+2.42)#10,170 |
| 14. | 78212 | 8.2% | 6.7%(+1.48)#694 | 5.8%(+2.39)#10,214 |
| 15. | 78218 | 7.9% | 6.7%(+1.17)#748 | 5.8%(+2.09)#10,835 |
| 16. | 78213 | 7.8% | 6.7%(+1.06)#768 | 5.8%(+1.98)#11,087 |
| 17. | 78205 | 7.6% | 6.7%(+0.862)#807 | 5.8%(+1.78)#11,548 |
| 18. | 78224 | 7.4% | 6.7%(+0.671)#848 | 5.8%(+1.59)#12,034 |
| 19. | 78204 | 7.4% | 6.7%(+0.649)#851 | 5.8%(+1.57)#12,100 |
| 20. | 78258 | 7.3% | 6.7%(+0.567)#863 | 5.8%(+1.48)#12,287 |
| 21. | 78260 | 7.2% | 6.7%(+0.494)#877 | 5.8%(+1.41)#12,451 |
| 22. | 78237 | 7.1% | 6.7%(+0.382)#897 | 5.8%(+1.30)#12,720 |
| 23. | 78216 | 7.0% | 6.7%(+0.253)#926 | 5.8%(+1.17)#13,094 |
| 24. | 78210 | 6.6% | 6.7%(-0.097)#999 | 5.8%(+0.820)#14,021 |
| 25. | 78217 | 6.3% | 6.7%(-0.404)#1,071 | 5.8%(+0.513)#14,991 |
| 26. | 78244 | 6.2% | 6.7%(-0.504)#1,089 | 5.8%(+0.413)#15,331 |
| 27. | 78220 | 6.2% | 6.7%(-0.520)#1,097 | 5.8%(+0.397)#15,380 |
| 28. | 78227 | 6.2% | 6.7%(-0.543)#1,103 | 5.8%(+0.374)#15,451 |
| 29. | 78232 | 6.1% | 6.7%(-0.587)#1,115 | 5.8%(+0.330)#15,598 |
| 30. | 78228 | 5.9% | 6.7%(-0.850)#1,184 | 5.8%(+0.067)#16,447 |
| 31. | 78261 | 5.9% | 6.7%(-0.857)#1,186 | 5.8%(+0.060)#16,462 |
| 32. | 78250 | 5.9% | 6.7%(-0.863)#1,191 | 5.8%(+0.054)#16,490 |
| 33. | 78257 | 5.7% | 6.7%(-1.07)#1,245 | 5.8%(-0.151)#17,170 |
| 34. | 78230 | 5.7% | 6.7%(-1.08)#1,248 | 5.8%(-0.161)#17,215 |
| 35. | 78247 | 5.6% | 6.7%(-1.10)#1,257 | 5.8%(-0.188)#17,308 |
| 36. | 78223 | 5.6% | 6.7%(-1.11)#1,258 | 5.8%(-0.196)#17,343 |
| 37. | 78239 | 5.6% | 6.7%(-1.17)#1,270 | 5.8%(-0.257)#17,565 |
| 38. | 78259 | 5.4% | 6.7%(-1.28)#1,295 | 5.8%(-0.367)#17,955 |
| 39. | 78233 | 5.4% | 6.7%(-1.34)#1,305 | 5.8%(-0.426)#18,167 |
| 40. | 78240 | 5.1% | 6.7%(-1.67)#1,376 | 5.8%(-0.752)#19,424 |
| 41. | 78202 | 4.7% | 6.7%(-2.00)#1,439 | 5.8%(-1.08)#20,676 |
| 42. | 78219 | 4.6% | 6.7%(-2.14)#1,456 | 5.8%(-1.22)#21,171 |
| 43. | 78254 | 4.4% | 6.7%(-2.29)#1,476 | 5.8%(-1.37)#21,794 |
| 44. | 78231 | 4.4% | 6.7%(-2.30)#1,479 | 5.8%(-1.38)#21,827 |
| 45. | 78222 | 4.3% | 6.7%(-2.41)#1,490 | 5.8%(-1.49)#22,227 |
| 46. | 78251 | 4.0% | 6.7%(-2.72)#1,527 | 5.8%(-1.81)#23,356 |
| 47. | 78226 | 4.0% | 6.7%(-2.74)#1,529 | 5.8%(-1.82)#23,400 |
| 48. | 78253 | 4.0% | 6.7%(-2.76)#1,535 | 5.8%(-1.84)#23,494 |
| 49. | 78249 | 3.9% | 6.7%(-2.82)#1,544 | 5.8%(-1.91)#23,707 |
| 50. | 78266 | 3.9% | 6.7%(-2.85)#1,547 | 5.8%(-1.93)#23,792 |
| 51. | 78245 | 3.6% | 6.7%(-3.15)#1,579 | 5.8%(-2.23)#24,766 |
| 52. | 78263 | 3.5% | 6.7%(-3.24)#1,588 | 5.8%(-2.32)#25,010 |
| 53. | 78229 | 3.4% | 6.7%(-3.38)#1,606 | 5.8%(-2.46)#25,450 |
| 54. | 78208 | 3.3% | 6.7%(-3.46)#1,613 | 5.8%(-2.55)#25,683 |
| 55. | 78215 | 2.3% | 6.7%(-4.43)#1,673 | 5.8%(-3.52)#27,776 |
| 56. | 78252 | 2.2% | 6.7%(-4.51)#1,677 | 5.8%(-3.60)#27,915 |
| 57. | 78256 | 1.3% | 6.7%(-5.44)#1,713 | 5.8%(-4.52)#28,919 |
| 58. | 78235 | 1.1% | 6.7%(-5.60)#1,720 | 5.8%(-4.69)#29,041 |
1
Common Questions
What are the Top 10 Zip Codes with the Highest Percentage of Self-Employed / Not Incorporated in San Antonio, TX?
Top 10 Zip Codes with the Highest Percentage of Self-Employed / Not Incorporated in San Antonio, TX are:
What zip code has the Highest Percentage of Self-Employed / Not Incorporated in San Antonio, TX?
78264 has the Highest Percentage of Self-Employed / Not Incorporated in San Antonio, TX with 11.2%.
What is the Percentage of Self-Employed / Not Incorporated in San Antonio, TX?
Percentage of Self-Employed / Not Incorporated in San Antonio is 6.2%.
What is the Percentage of Self-Employed / Not Incorporated in Texas?
Percentage of Self-Employed / Not Incorporated in Texas is 6.7%.
What is the Percentage of Self-Employed / Not Incorporated in the United States?
Percentage of Self-Employed / Not Incorporated in the United States is 5.8%.