Zip Codes with the Lowest Percentage of Renter-Occupied Units in San Antonio, TX
RELATED REPORTS & OPTIONS
Lowest Renter-Occupied
San Antonio
Compare Zip Codes
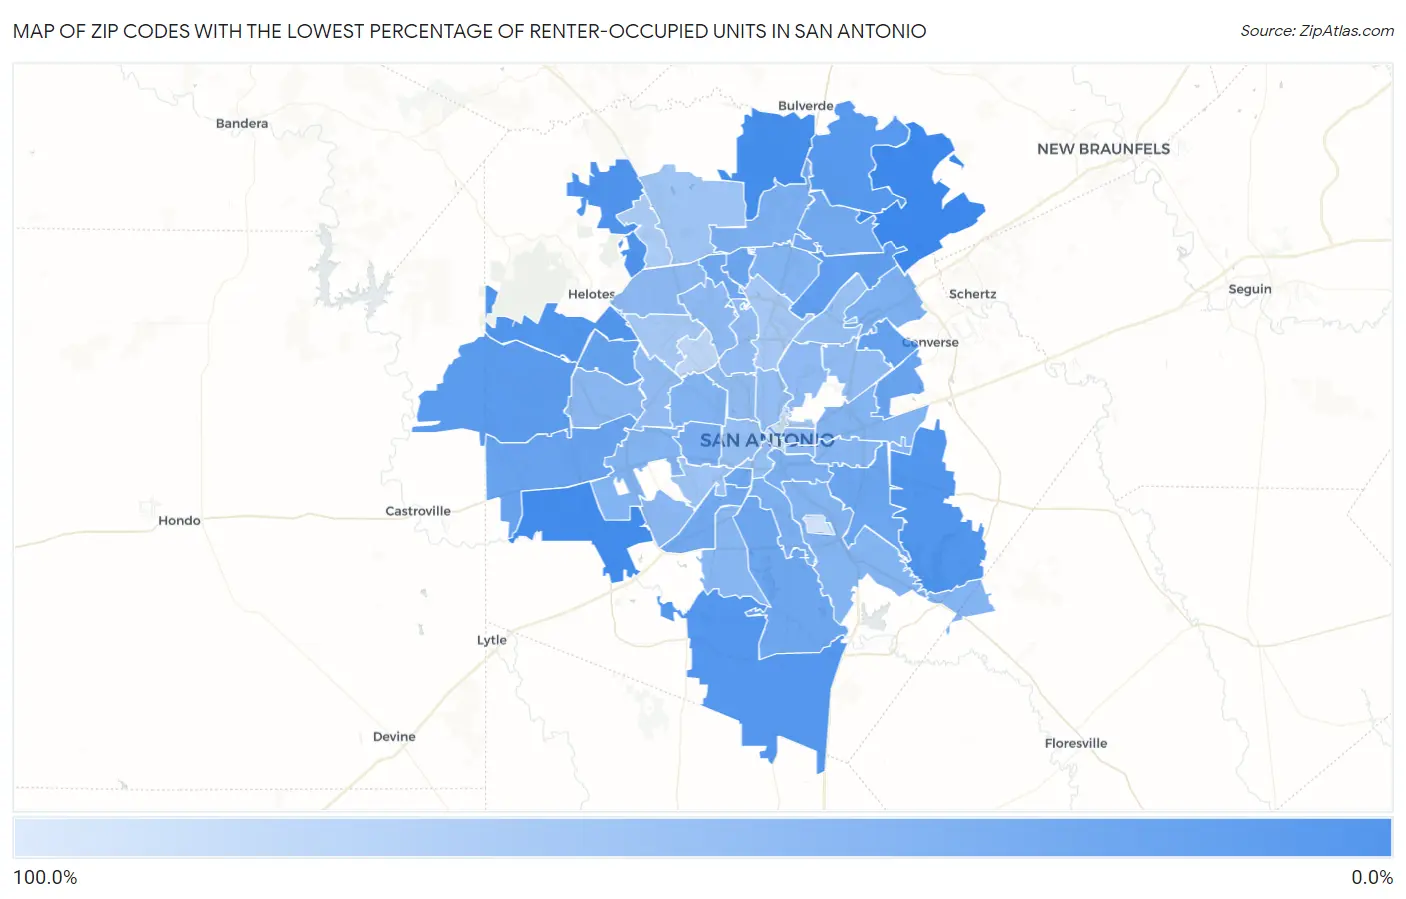
Map of Zip Codes with the Lowest Percentage of Renter-Occupied Units in San Antonio
100.0%
6.8%
Zip Codes with the Lowest Percentage of Renter-Occupied Units in San Antonio, TX
| Zip Code | % Renter-Occupied | vs State | vs National | |
| 1. | 78266 | 6.8% | 37.6%(-30.8)#63 | 35.2%(-28.4)#1,800 |
| 2. | 78252 | 10.3% | 37.6%(-27.3)#148 | 35.2%(-24.9)#3,991 |
| 3. | 78260 | 11.5% | 37.6%(-26.1)#194 | 35.2%(-23.7)#4,888 |
| 4. | 78255 | 15.8% | 37.6%(-21.8)#357 | 35.2%(-19.4)#8,722 |
| 5. | 78263 | 17.4% | 37.6%(-20.2)#435 | 35.2%(-17.8)#10,310 |
| 6. | 78254 | 17.8% | 37.6%(-19.8)#458 | 35.2%(-17.4)#10,704 |
| 7. | 78264 | 18.2% | 37.6%(-19.4)#486 | 35.2%(-16.9)#11,179 |
| 8. | 78261 | 20.1% | 37.6%(-17.5)#568 | 35.2%(-15.1)#12,976 |
| 9. | 78253 | 21.8% | 37.6%(-15.8)#648 | 35.2%(-13.4)#14,562 |
| 10. | 78247 | 24.6% | 37.6%(-13.0)#799 | 35.2%(-10.5)#17,149 |
| 11. | 78250 | 26.7% | 37.6%(-10.9)#898 | 35.2%(-8.47)#18,804 |
| 12. | 78239 | 27.5% | 37.6%(-10.2)#925 | 35.2%(-7.73)#19,320 |
| 13. | 78245 | 27.7% | 37.6%(-9.86)#940 | 35.2%(-7.44)#19,529 |
| 14. | 78244 | 29.5% | 37.6%(-8.09)#1,008 | 35.2%(-5.67)#20,714 |
| 15. | 78248 | 30.3% | 37.6%(-7.31)#1,046 | 35.2%(-4.89)#21,228 |
| 16. | 78222 | 30.7% | 37.6%(-6.86)#1,072 | 35.2%(-4.44)#21,495 |
| 17. | 78225 | 31.9% | 37.6%(-5.68)#1,112 | 35.2%(-3.26)#22,199 |
| 18. | 78221 | 32.1% | 37.6%(-5.46)#1,121 | 35.2%(-3.04)#22,335 |
| 19. | 78231 | 33.1% | 37.6%(-4.54)#1,146 | 35.2%(-2.12)#22,813 |
| 20. | 78259 | 34.6% | 37.6%(-3.05)#1,199 | 35.2%(-0.631)#23,517 |
| 21. | 78211 | 35.0% | 37.6%(-2.59)#1,220 | 35.2%(-0.174)#23,755 |
| 22. | 78237 | 38.0% | 37.6%(+0.434)#1,295 | 35.2%(+2.85)#25,023 |
| 23. | 78233 | 39.7% | 37.6%(+2.05)#1,338 | 35.2%(+4.47)#25,590 |
| 24. | 78258 | 40.7% | 37.6%(+3.14)#1,365 | 35.2%(+5.56)#25,915 |
| 25. | 78214 | 41.1% | 37.6%(+3.46)#1,373 | 35.2%(+5.88)#26,016 |
| 26. | 78210 | 41.9% | 37.6%(+4.31)#1,394 | 35.2%(+6.73)#26,238 |
| 27. | 78228 | 42.1% | 37.6%(+4.47)#1,400 | 35.2%(+6.89)#26,286 |
| 28. | 78232 | 42.9% | 37.6%(+5.32)#1,411 | 35.2%(+7.74)#26,509 |
| 29. | 78227 | 43.6% | 37.6%(+6.00)#1,432 | 35.2%(+8.42)#26,685 |
| 30. | 78223 | 43.8% | 37.6%(+6.18)#1,438 | 35.2%(+8.60)#26,735 |
| 31. | 78219 | 43.9% | 37.6%(+6.27)#1,441 | 35.2%(+8.69)#26,751 |
| 32. | 78220 | 45.1% | 37.6%(+7.49)#1,460 | 35.2%(+9.91)#27,069 |
| 33. | 78224 | 46.5% | 37.6%(+8.92)#1,486 | 35.2%(+11.3)#27,374 |
| 34. | 78251 | 48.2% | 37.6%(+10.6)#1,518 | 35.2%(+13.0)#27,697 |
| 35. | 78242 | 48.2% | 37.6%(+10.6)#1,519 | 35.2%(+13.0)#27,698 |
| 36. | 78249 | 49.6% | 37.6%(+12.0)#1,543 | 35.2%(+14.4)#27,941 |
| 37. | 78202 | 50.0% | 37.6%(+12.4)#1,551 | 35.2%(+14.8)#28,004 |
| 38. | 78203 | 51.0% | 37.6%(+13.3)#1,565 | 35.2%(+15.8)#28,158 |
| 39. | 78230 | 51.0% | 37.6%(+13.4)#1,566 | 35.2%(+15.9)#28,174 |
| 40. | 78209 | 51.7% | 37.6%(+14.1)#1,575 | 35.2%(+16.5)#28,290 |
| 41. | 78201 | 52.2% | 37.6%(+14.6)#1,580 | 35.2%(+17.0)#28,363 |
| 42. | 78218 | 52.3% | 37.6%(+14.7)#1,582 | 35.2%(+17.2)#28,381 |
| 43. | 78238 | 52.5% | 37.6%(+14.9)#1,583 | 35.2%(+17.3)#28,397 |
| 44. | 78213 | 53.3% | 37.6%(+15.7)#1,594 | 35.2%(+18.1)#28,531 |
| 45. | 78212 | 54.1% | 37.6%(+16.5)#1,604 | 35.2%(+18.9)#28,649 |
| 46. | 78204 | 55.2% | 37.6%(+17.6)#1,611 | 35.2%(+20.0)#28,792 |
| 47. | 78217 | 55.6% | 37.6%(+18.0)#1,615 | 35.2%(+20.4)#28,851 |
| 48. | 78207 | 56.3% | 37.6%(+18.7)#1,619 | 35.2%(+21.1)#28,928 |
| 49. | 78257 | 61.3% | 37.6%(+23.6)#1,654 | 35.2%(+26.1)#29,407 |
| 50. | 78226 | 61.3% | 37.6%(+23.7)#1,655 | 35.2%(+26.1)#29,410 |
| 51. | 78240 | 65.7% | 37.6%(+28.1)#1,684 | 35.2%(+30.5)#29,775 |
| 52. | 78216 | 66.3% | 37.6%(+28.7)#1,686 | 35.2%(+31.1)#29,813 |
| 53. | 78208 | 66.3% | 37.6%(+28.7)#1,688 | 35.2%(+31.2)#29,820 |
| 54. | 78256 | 71.2% | 37.6%(+33.6)#1,712 | 35.2%(+36.0)#30,101 |
| 55. | 78229 | 85.3% | 37.6%(+47.7)#1,753 | 35.2%(+50.2)#30,556 |
| 56. | 78205 | 92.1% | 37.6%(+54.5)#1,764 | 35.2%(+57.0)#30,678 |
| 57. | 78215 | 95.6% | 37.6%(+58.0)#1,771 | 35.2%(+60.4)#30,724 |
| 58. | 78235 | 100.0% | 37.6%(+62.4)#1,782 | 35.2%(+64.8)#30,860 |
1
Common Questions
What are the Top 10 Zip Codes with the Lowest Percentage of Renter-Occupied Units in San Antonio, TX?
Top 10 Zip Codes with the Lowest Percentage of Renter-Occupied Units in San Antonio, TX are:
What zip code has the Lowest Percentage of Renter-Occupied Units in San Antonio, TX?
78266 has the Lowest Percentage of Renter-Occupied Units in San Antonio, TX with 6.8%.
What is the Percentage of Renter-Occupied Units in San Antonio, TX?
Percentage of Renter-Occupied Units in San Antonio is 48.1%.
What is the Percentage of Renter-Occupied Units in Texas?
Percentage of Renter-Occupied Units in Texas is 37.6%.
What is the Percentage of Renter-Occupied Units in the United States?
Percentage of Renter-Occupied Units in the United States is 35.2%.