Plattsmouth, NE Map & Demographics
Plattsmouth Map
Plattsmouth Overview
$33,181
PER CAPITA INCOME
$67,188
AVG FAMILY INCOME
$58,989
AVG HOUSEHOLD INCOME
26.2%
WAGE / INCOME GAP [ % ]
73.8¢/ $1
WAGE / INCOME GAP [ $ ]
0.38
INEQUALITY / GINI INDEX
6,585
TOTAL POPULATION
3,288
MALE POPULATION
3,297
FEMALE POPULATION
99.73
MALES / 100 FEMALES
100.27
FEMALES / 100 MALES
37.2
MEDIAN AGE
2.8
AVG FAMILY SIZE
2.2
AVG HOUSEHOLD SIZE
3,510
LABOR FORCE [ PEOPLE ]
65.9%
PERCENT IN LABOR FORCE
0.7%
UNEMPLOYMENT RATE
Plattsmouth Zip Codes
Plattsmouth Area Codes
Income in Plattsmouth
Income Overview in Plattsmouth
Per Capita Income in Plattsmouth is $33,181, while median incomes of families and households are $67,188 and $58,989 respectively.
| Characteristic | Number | Measure |
| Per Capita Income | 6,585 | $33,181 |
| Median Family Income | 1,727 | $67,188 |
| Mean Family Income | 1,727 | $85,277 |
| Median Household Income | 2,873 | $58,989 |
| Mean Household Income | 2,873 | $72,507 |
| Income Deficit | 1,727 | $0 |
| Wage / Income Gap (%) | 6,585 | 26.17% |
| Wage / Income Gap ($) | 6,585 | 73.83¢ per $1 |
| Gini / Inequality Index | 6,585 | 0.38 |
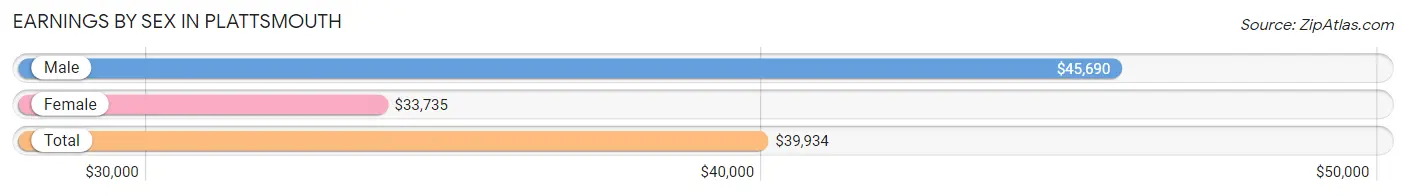
Earnings by Sex in Plattsmouth
Average Earnings in Plattsmouth are $39,934, $45,690 for men and $33,735 for women, a difference of 26.2%.
| Sex | Number | Average Earnings |
| Male | 2,033 (54.6%) | $45,690 |
| Female | 1,691 (45.4%) | $33,735 |
| Total | 3,724 (100.0%) | $39,934 |
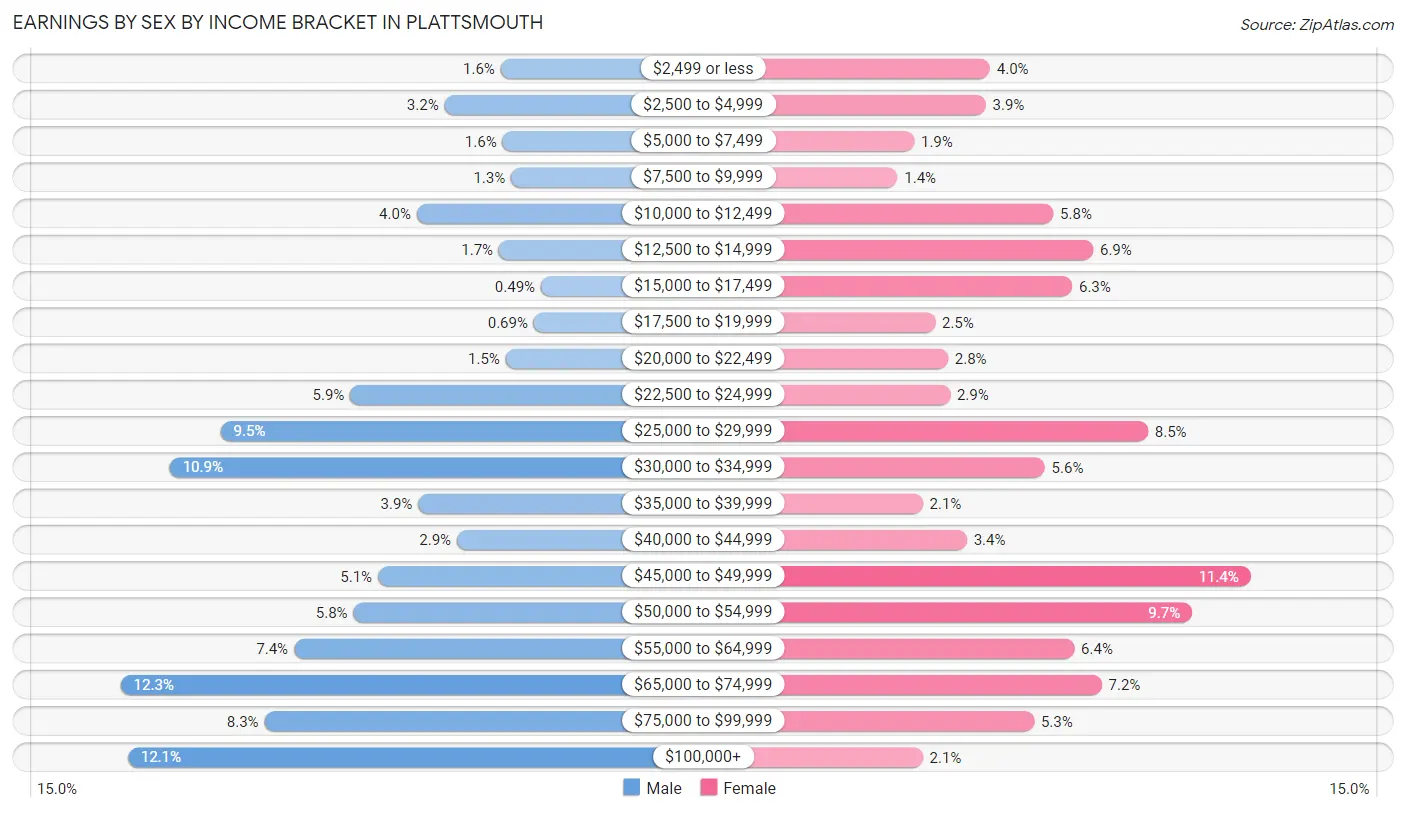
Earnings by Sex by Income Bracket in Plattsmouth
The most common earnings brackets in Plattsmouth are $65,000 to $74,999 for men (250 | 12.3%) and $45,000 to $49,999 for women (192 | 11.4%).
| Income | Male | Female |
| $2,499 or less | 33 (1.6%) | 68 (4.0%) |
| $2,500 to $4,999 | 65 (3.2%) | 66 (3.9%) |
| $5,000 to $7,499 | 32 (1.6%) | 32 (1.9%) |
| $7,500 to $9,999 | 27 (1.3%) | 24 (1.4%) |
| $10,000 to $12,499 | 81 (4.0%) | 98 (5.8%) |
| $12,500 to $14,999 | 34 (1.7%) | 117 (6.9%) |
| $15,000 to $17,499 | 10 (0.5%) | 107 (6.3%) |
| $17,500 to $19,999 | 14 (0.7%) | 42 (2.5%) |
| $20,000 to $22,499 | 30 (1.5%) | 48 (2.8%) |
| $22,500 to $24,999 | 119 (5.9%) | 49 (2.9%) |
| $25,000 to $29,999 | 193 (9.5%) | 143 (8.5%) |
| $30,000 to $34,999 | 222 (10.9%) | 94 (5.6%) |
| $35,000 to $39,999 | 80 (3.9%) | 36 (2.1%) |
| $40,000 to $44,999 | 58 (2.9%) | 57 (3.4%) |
| $45,000 to $49,999 | 103 (5.1%) | 192 (11.4%) |
| $50,000 to $54,999 | 117 (5.8%) | 164 (9.7%) |
| $55,000 to $64,999 | 151 (7.4%) | 108 (6.4%) |
| $65,000 to $74,999 | 250 (12.3%) | 121 (7.2%) |
| $75,000 to $99,999 | 168 (8.3%) | 89 (5.3%) |
| $100,000+ | 246 (12.1%) | 36 (2.1%) |
| Total | 2,033 (100.0%) | 1,691 (100.0%) |
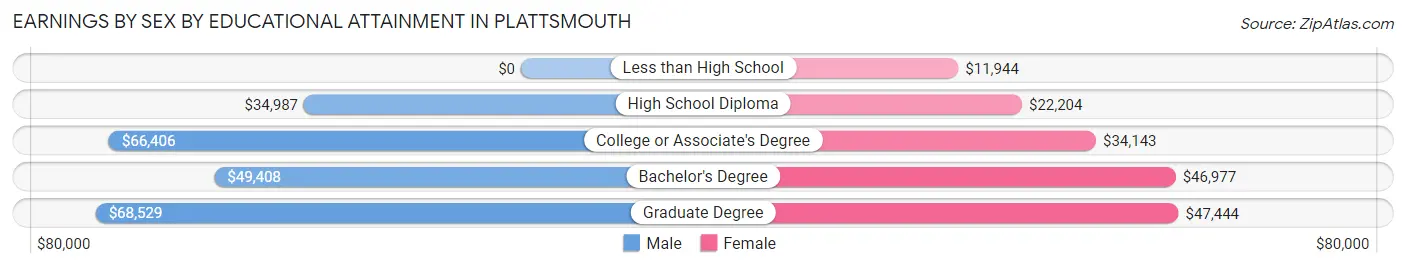
Earnings by Sex by Educational Attainment in Plattsmouth
Average earnings in Plattsmouth are $51,814 for men and $40,871 for women, a difference of 21.1%. Men with an educational attainment of graduate degree enjoy the highest average annual earnings of $68,529, while those with high school diploma education earn the least with $34,987. Women with an educational attainment of graduate degree earn the most with the average annual earnings of $47,444, while those with less than high school education have the smallest earnings of $11,944.
| Educational Attainment | Male Income | Female Income |
| Less than High School | - | - |
| High School Diploma | $34,987 | $22,204 |
| College or Associate's Degree | $66,406 | $34,143 |
| Bachelor's Degree | $49,408 | $46,977 |
| Graduate Degree | $68,529 | $47,444 |
| Total | $51,814 | $40,871 |
Family Income in Plattsmouth
Family Income Brackets in Plattsmouth
According to the Plattsmouth family income data, there are 433 families falling into the $50,000 to $74,999 income range, which is the most common income bracket and makes up 25.1% of all families.
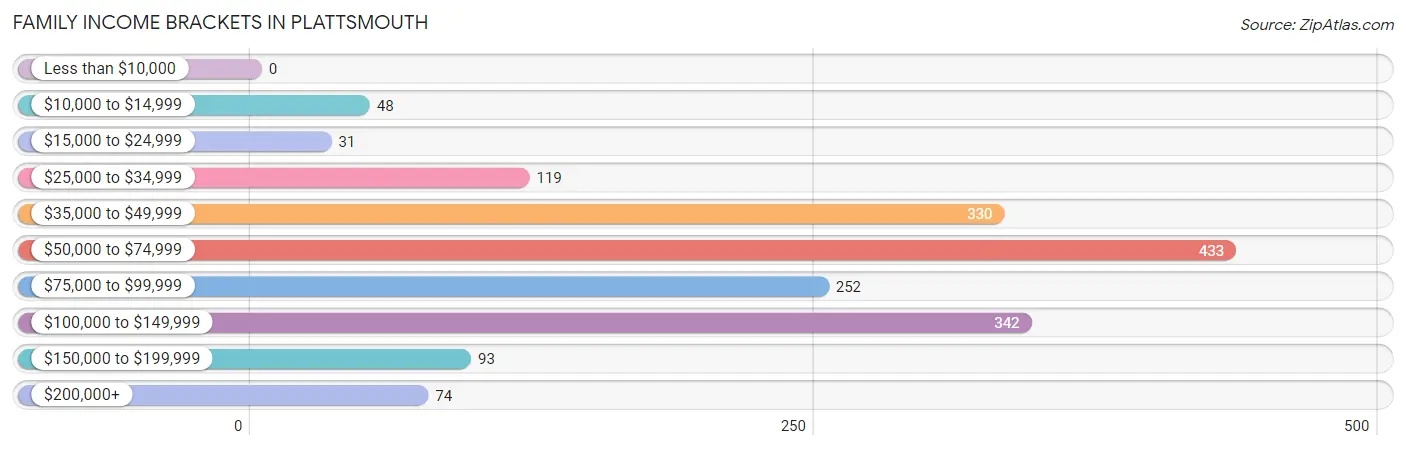
| Income Bracket | # Families | % Families |
| Less than $10,000 | 0 | 0.0% |
| $10,000 to $14,999 | 48 | 2.8% |
| $15,000 to $24,999 | 31 | 1.8% |
| $25,000 to $34,999 | 119 | 6.9% |
| $35,000 to $49,999 | 330 | 19.1% |
| $50,000 to $74,999 | 433 | 25.1% |
| $75,000 to $99,999 | 252 | 14.6% |
| $100,000 to $149,999 | 342 | 19.8% |
| $150,000 to $199,999 | 93 | 5.4% |
| $200,000+ | 74 | 4.3% |
Family Income by Famaliy Size in Plattsmouth
5-person families (87 | 5.0%) account for the highest median family income in Plattsmouth with $114,141 per family, while 2-person families (917 | 53.1%) have the highest median income of $30,412 per family member.
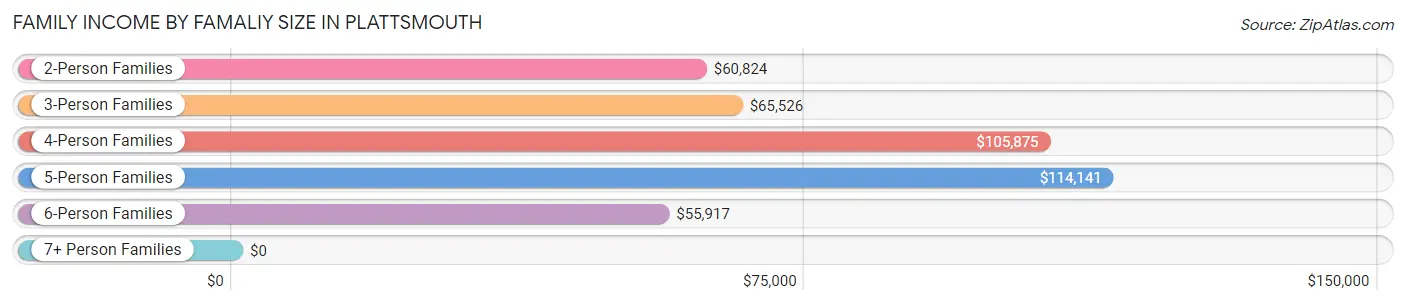
| Income Bracket | # Families | Median Income |
| 2-Person Families | 917 (53.1%) | $60,824 |
| 3-Person Families | 454 (26.3%) | $65,526 |
| 4-Person Families | 165 (9.6%) | $105,875 |
| 5-Person Families | 87 (5.0%) | $114,141 |
| 6-Person Families | 69 (4.0%) | $55,917 |
| 7+ Person Families | 35 (2.0%) | $0 |
| Total | 1,727 (100.0%) | $67,188 |
Family Income by Number of Earners in Plattsmouth
The median family income in Plattsmouth is $67,188, with families comprising 3+ earners (133) having the highest median family income of $111,635, while families with no earners (187) have the lowest median family income of $46,477, accounting for 7.7% and 10.8% of families, respectively.
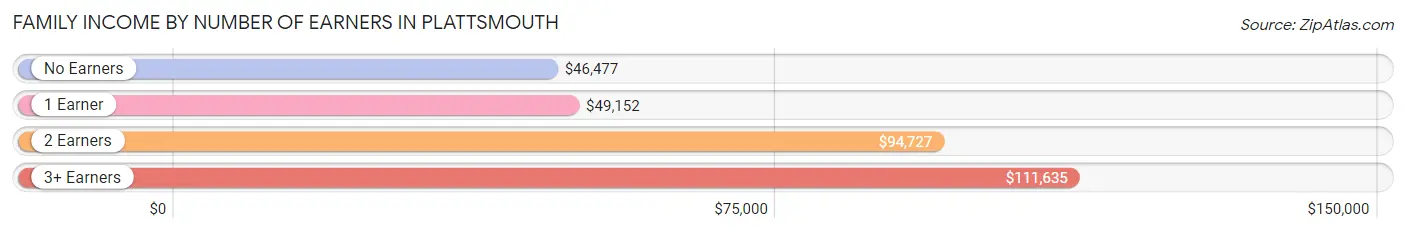
| Number of Earners | # Families | Median Income |
| No Earners | 187 (10.8%) | $46,477 |
| 1 Earner | 645 (37.3%) | $49,152 |
| 2 Earners | 762 (44.1%) | $94,727 |
| 3+ Earners | 133 (7.7%) | $111,635 |
| Total | 1,727 (100.0%) | $67,188 |
Household Income in Plattsmouth
Household Income Brackets in Plattsmouth
With 589 households falling in the category, the $50,000 to $74,999 income range is the most frequent in Plattsmouth, accounting for 20.5% of all households. In contrast, only 72 households (2.5%) fall into the less than $10,000 income bracket, making it the least populous group.
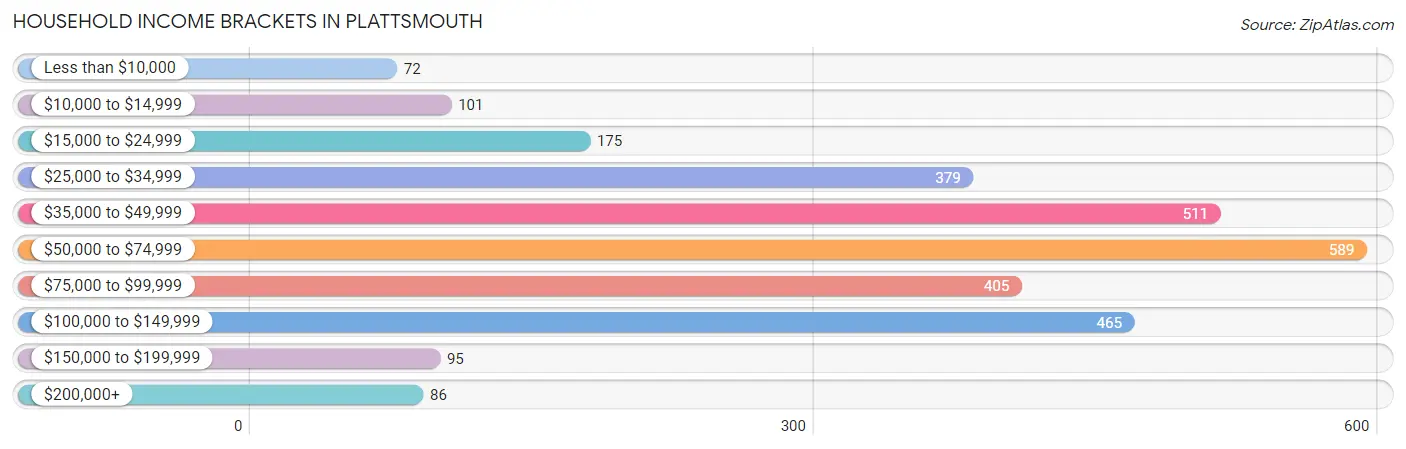
| Income Bracket | # Households | % Households |
| Less than $10,000 | 72 | 2.5% |
| $10,000 to $14,999 | 101 | 3.5% |
| $15,000 to $24,999 | 175 | 6.1% |
| $25,000 to $34,999 | 379 | 13.2% |
| $35,000 to $49,999 | 511 | 17.8% |
| $50,000 to $74,999 | 589 | 20.5% |
| $75,000 to $99,999 | 405 | 14.1% |
| $100,000 to $149,999 | 465 | 16.2% |
| $150,000 to $199,999 | 95 | 3.3% |
| $200,000+ | 86 | 3.0% |
Household Income by Householder Age in Plattsmouth
The median household income in Plattsmouth is $58,989, with the highest median household income of $75,000 found in the 45 to 64 years age bracket for the primary householder. A total of 1,180 households (41.1%) fall into this category. Meanwhile, the 15 to 24 years age bracket for the primary householder has the lowest median household income of $31,827, with 185 households (6.4%) in this group.
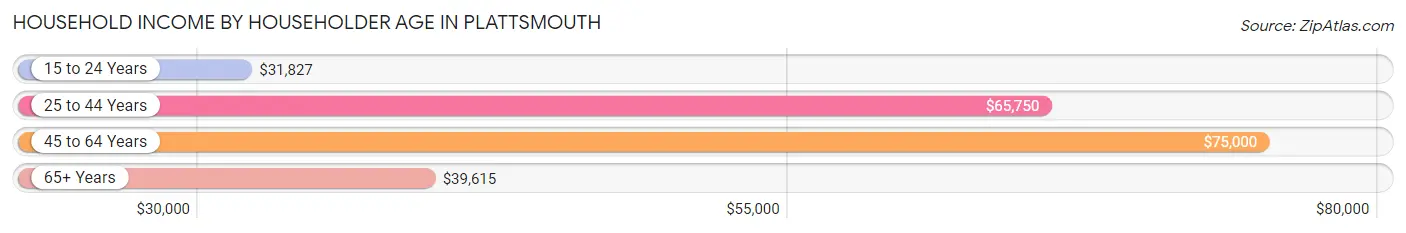
| Income Bracket | # Households | Median Income |
| 15 to 24 Years | 185 (6.4%) | $31,827 |
| 25 to 44 Years | 868 (30.2%) | $65,750 |
| 45 to 64 Years | 1,180 (41.1%) | $75,000 |
| 65+ Years | 640 (22.3%) | $39,615 |
| Total | 2,873 (100.0%) | $58,989 |
Poverty in Plattsmouth
Income Below Poverty by Sex and Age in Plattsmouth
With 7.1% poverty level for males and 8.8% for females among the residents of Plattsmouth, 35 to 44 year old males and 75 year old and over females are the most vulnerable to poverty, with 42 males (12.5%) and 56 females (20.5%) in their respective age groups living below the poverty level.
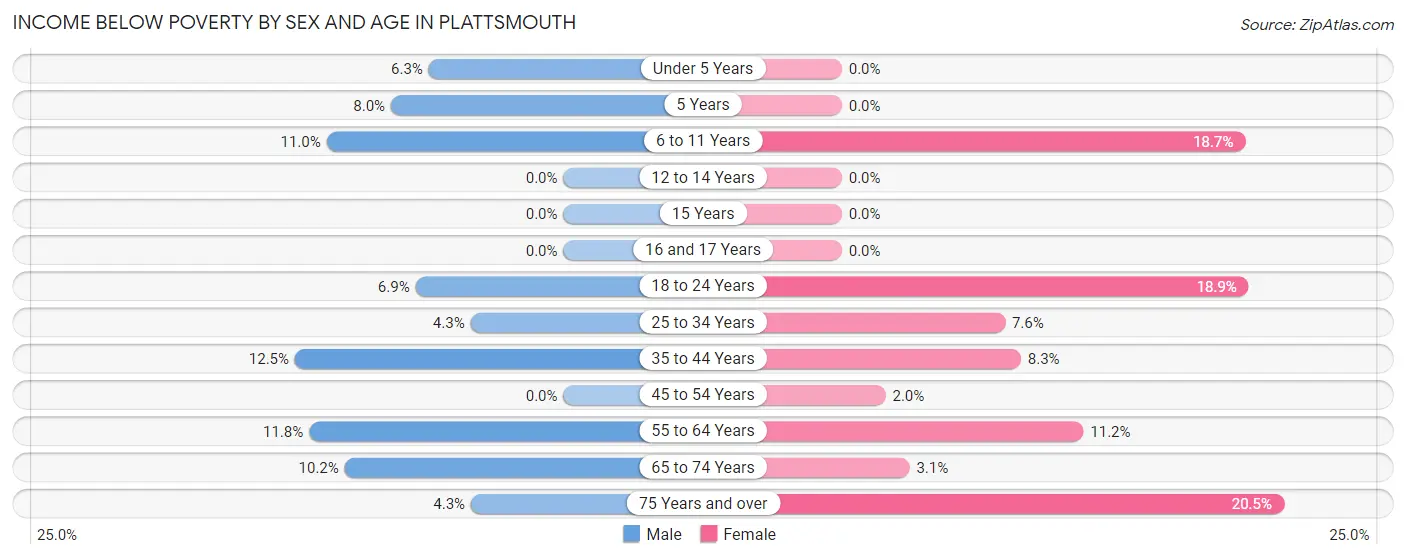
| Age Bracket | Male | Female |
| Under 5 Years | 15 (6.2%) | 0 (0.0%) |
| 5 Years | 4 (8.0%) | 0 (0.0%) |
| 6 to 11 Years | 30 (11.0%) | 38 (18.7%) |
| 12 to 14 Years | 0 (0.0%) | 0 (0.0%) |
| 15 Years | 0 (0.0%) | 0 (0.0%) |
| 16 and 17 Years | 0 (0.0%) | 0 (0.0%) |
| 18 to 24 Years | 21 (6.9%) | 54 (18.9%) |
| 25 to 34 Years | 24 (4.3%) | 32 (7.6%) |
| 35 to 44 Years | 42 (12.5%) | 32 (8.3%) |
| 45 to 54 Years | 0 (0.0%) | 9 (2.0%) |
| 55 to 64 Years | 61 (11.8%) | 52 (11.2%) |
| 65 to 74 Years | 20 (10.2%) | 10 (3.1%) |
| 75 Years and over | 6 (4.3%) | 56 (20.5%) |
| Total | 223 (7.1%) | 283 (8.8%) |
Income Above Poverty by Sex and Age in Plattsmouth
According to the poverty statistics in Plattsmouth, males aged 12 to 14 years and females aged under 5 years are the age groups that are most secure financially, with 100.0% of males and 100.0% of females in these age groups living above the poverty line.
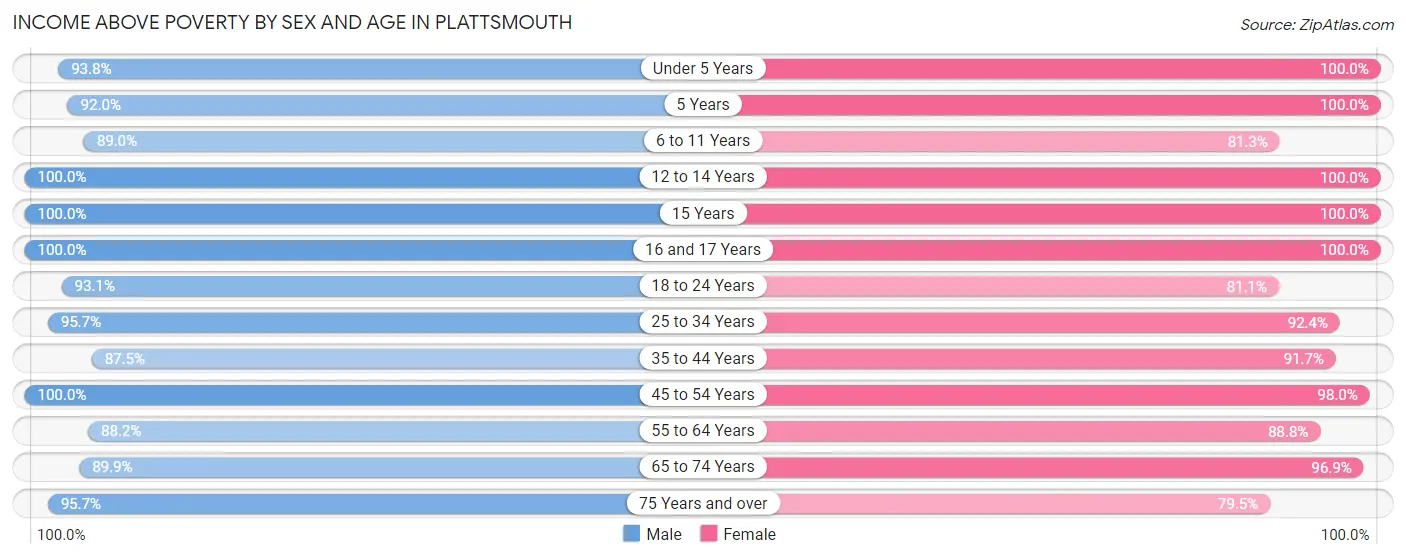
| Age Bracket | Male | Female |
| Under 5 Years | 225 (93.8%) | 272 (100.0%) |
| 5 Years | 46 (92.0%) | 21 (100.0%) |
| 6 to 11 Years | 243 (89.0%) | 165 (81.3%) |
| 12 to 14 Years | 28 (100.0%) | 89 (100.0%) |
| 15 Years | 23 (100.0%) | 27 (100.0%) |
| 16 and 17 Years | 67 (100.0%) | 15 (100.0%) |
| 18 to 24 Years | 285 (93.1%) | 232 (81.1%) |
| 25 to 34 Years | 533 (95.7%) | 391 (92.4%) |
| 35 to 44 Years | 295 (87.5%) | 353 (91.7%) |
| 45 to 54 Years | 415 (100.0%) | 434 (98.0%) |
| 55 to 64 Years | 456 (88.2%) | 412 (88.8%) |
| 65 to 74 Years | 177 (89.8%) | 308 (96.9%) |
| 75 Years and over | 134 (95.7%) | 217 (79.5%) |
| Total | 2,927 (92.9%) | 2,936 (91.2%) |
Income Below Poverty Among Married-Couple Families in Plattsmouth
The poverty statistics for married-couple families in Plattsmouth show that 4.4% or 54 of the total 1,236 families live below the poverty line. Families with 1 or 2 children have the highest poverty rate of 9.9%, comprising of 32 families. On the other hand, families with no children have the lowest poverty rate of 1.2%, which includes 9 families.
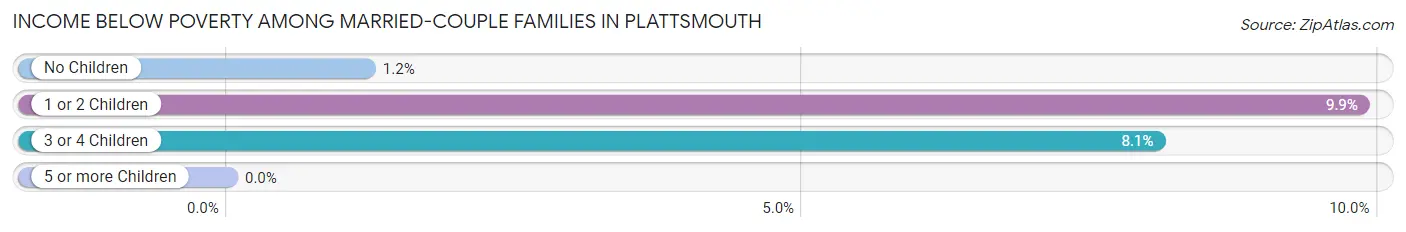
| Children | Above Poverty | Below Poverty |
| No Children | 741 (98.8%) | 9 (1.2%) |
| 1 or 2 Children | 293 (90.1%) | 32 (9.9%) |
| 3 or 4 Children | 148 (91.9%) | 13 (8.1%) |
| 5 or more Children | 0 (0.0%) | 0 (0.0%) |
| Total | 1,182 (95.6%) | 54 (4.4%) |
Income Below Poverty Among Single-Parent Households in Plattsmouth
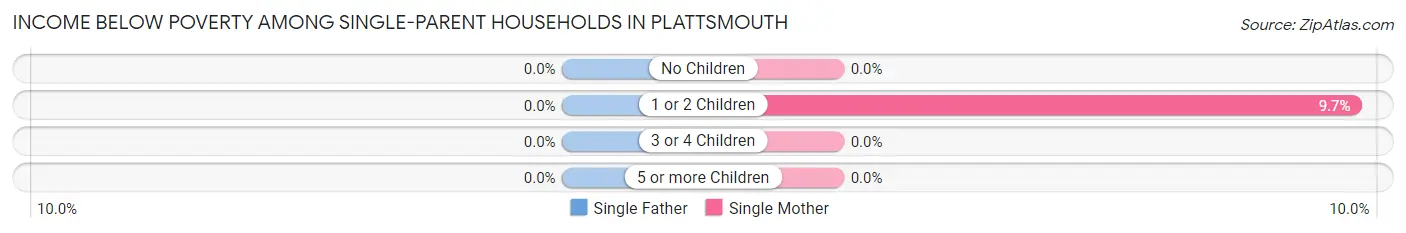
| Children | Single Father | Single Mother |
| No Children | 0 (0.0%) | 0 (0.0%) |
| 1 or 2 Children | 0 (0.0%) | 17 (9.7%) |
| 3 or 4 Children | 0 (0.0%) | 0 (0.0%) |
| 5 or more Children | 0 (0.0%) | 0 (0.0%) |
| Total | 0 (0.0%) | 17 (5.9%) |
Income Below Poverty Among Married-Couple vs Single-Parent Households in Plattsmouth
The poverty data for Plattsmouth shows that 54 of the married-couple family households (4.4%) and 17 of the single-parent households (3.5%) are living below the poverty level. Within the married-couple family households, those with 1 or 2 children have the highest poverty rate, with 32 households (9.9%) falling below the poverty line. Among the single-parent households, those with 1 or 2 children have the highest poverty rate, with 17 household (5.7%) living below poverty.
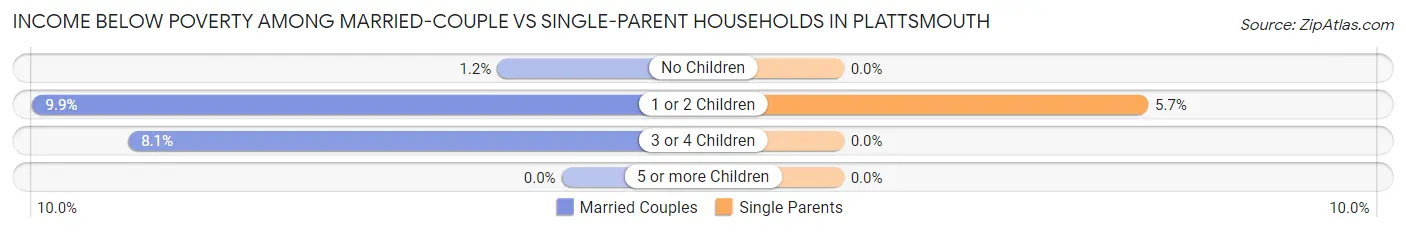
| Children | Married-Couple Families | Single-Parent Households |
| No Children | 9 (1.2%) | 0 (0.0%) |
| 1 or 2 Children | 32 (9.9%) | 17 (5.7%) |
| 3 or 4 Children | 13 (8.1%) | 0 (0.0%) |
| 5 or more Children | 0 (0.0%) | 0 (0.0%) |
| Total | 54 (4.4%) | 17 (3.5%) |
Race in Plattsmouth
The most populous races in Plattsmouth are White / Caucasian (5,776 | 87.7%), Hispanic or Latino (531 | 8.1%), and Two or more Races (503 | 7.6%).
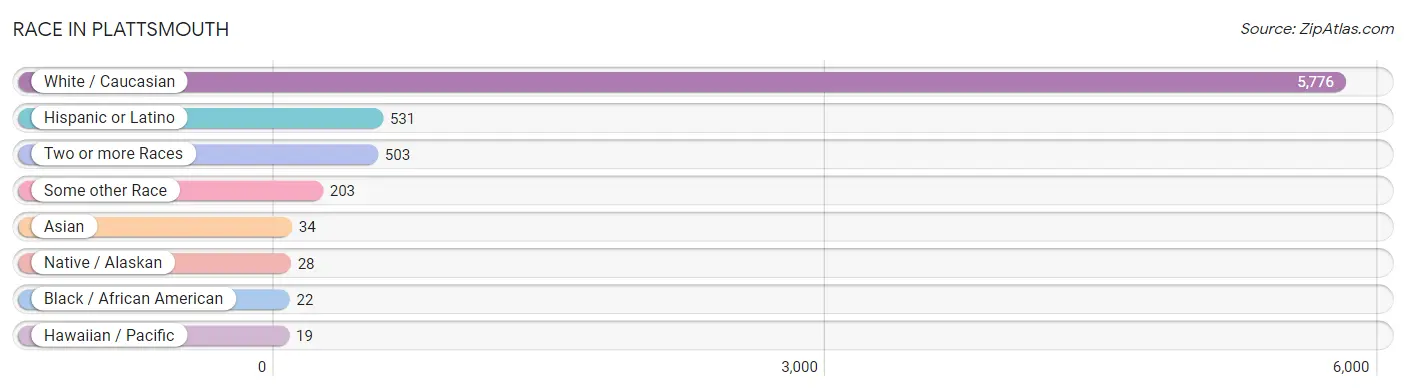
| Race | # Population | % Population |
| Asian | 34 | 0.5% |
| Black / African American | 22 | 0.3% |
| Hawaiian / Pacific | 19 | 0.3% |
| Hispanic or Latino | 531 | 8.1% |
| Native / Alaskan | 28 | 0.4% |
| White / Caucasian | 5,776 | 87.7% |
| Two or more Races | 503 | 7.6% |
| Some other Race | 203 | 3.1% |
| Total | 6,585 | 100.0% |
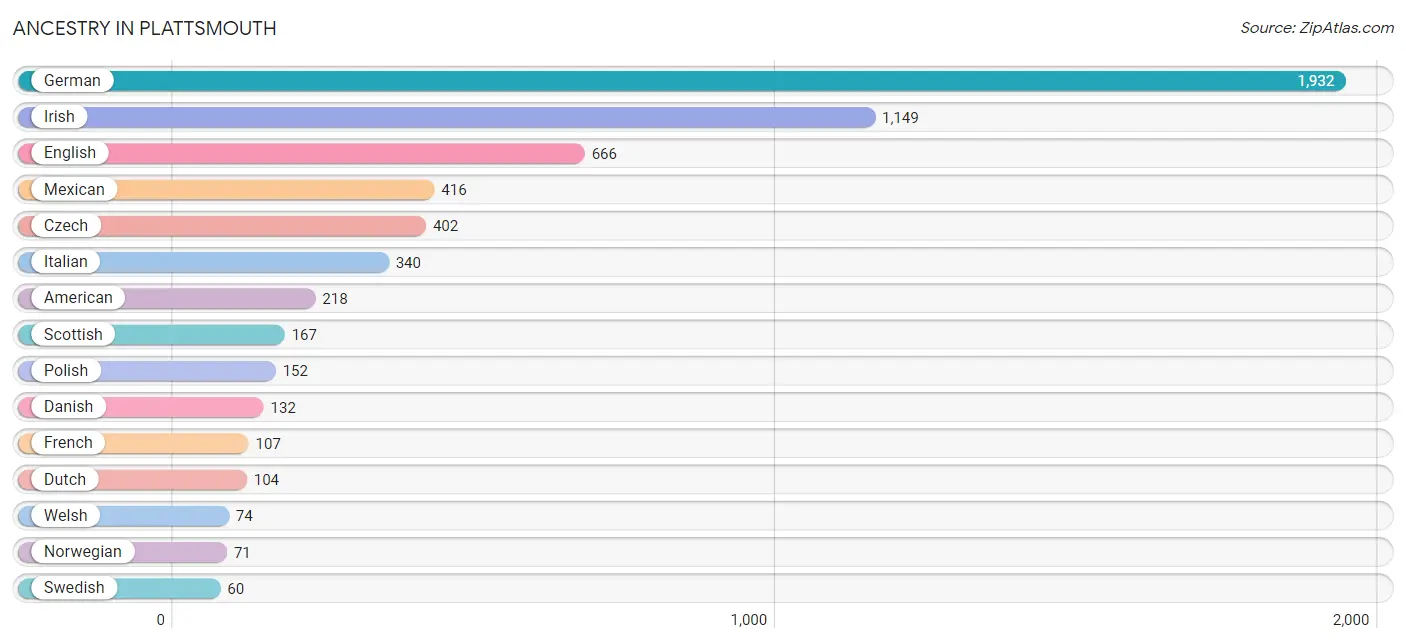
Ancestry in Plattsmouth
The most populous ancestries reported in Plattsmouth are German (1,932 | 29.3%), Irish (1,149 | 17.4%), English (666 | 10.1%), Mexican (416 | 6.3%), and Czech (402 | 6.1%), together accounting for 69.3% of all Plattsmouth residents.
| Ancestry | # Population | % Population |
| African | 45 | 0.7% |
| American | 218 | 3.3% |
| Apache | 15 | 0.2% |
| Arab | 12 | 0.2% |
| Austrian | 24 | 0.4% |
| Central American | 6 | 0.1% |
| Choctaw | 16 | 0.2% |
| Colombian | 28 | 0.4% |
| Croatian | 29 | 0.4% |
| Czech | 402 | 6.1% |
| Czechoslovakian | 34 | 0.5% |
| Danish | 132 | 2.0% |
| Dutch | 104 | 1.6% |
| Dutch West Indian | 14 | 0.2% |
| Eastern European | 21 | 0.3% |
| English | 666 | 10.1% |
| European | 58 | 0.9% |
| French | 107 | 1.6% |
| German | 1,932 | 29.3% |
| Greek | 35 | 0.5% |
| Guamanian / Chamorro | 19 | 0.3% |
| Guatemalan | 2 | 0.0% |
| Hungarian | 13 | 0.2% |
| Indian (Asian) | 34 | 0.5% |
| Iranian | 15 | 0.2% |
| Irish | 1,149 | 17.4% |
| Italian | 340 | 5.2% |
| Jamaican | 32 | 0.5% |
| Korean | 12 | 0.2% |
| Latvian | 10 | 0.2% |
| Lebanese | 12 | 0.2% |
| Lithuanian | 19 | 0.3% |
| Mexican | 416 | 6.3% |
| Mexican American Indian | 4 | 0.1% |
| Native Hawaiian | 26 | 0.4% |
| Nigerian | 2 | 0.0% |
| Northern European | 20 | 0.3% |
| Norwegian | 71 | 1.1% |
| Pennsylvania German | 16 | 0.2% |
| Polish | 152 | 2.3% |
| Puerto Rican | 37 | 0.6% |
| Russian | 25 | 0.4% |
| Salvadoran | 4 | 0.1% |
| Scandinavian | 15 | 0.2% |
| Scotch-Irish | 42 | 0.6% |
| Scottish | 167 | 2.5% |
| South American | 28 | 0.4% |
| Spanish | 7 | 0.1% |
| Subsaharan African | 49 | 0.7% |
| Sudanese | 2 | 0.0% |
| Swedish | 60 | 0.9% |
| Swiss | 13 | 0.2% |
| Welsh | 74 | 1.1% | View All 53 Rows |
Immigrants in Plattsmouth
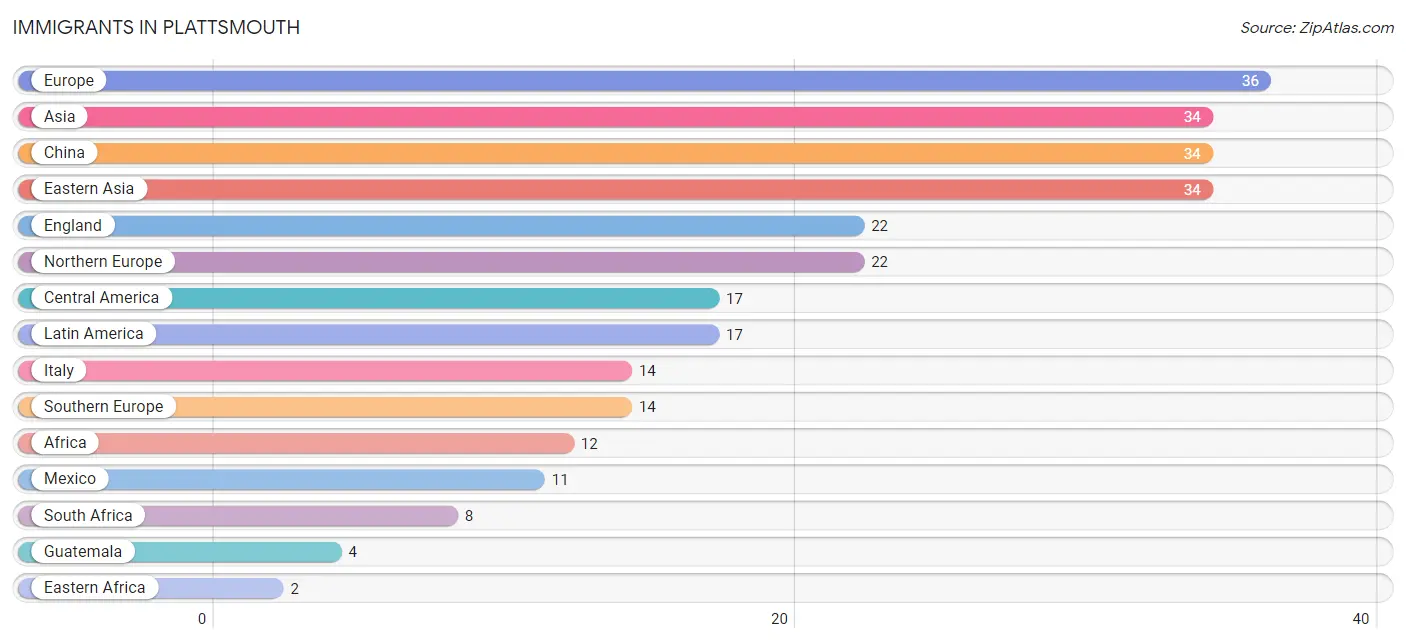
The most numerous immigrant groups reported in Plattsmouth came from Europe (36 | 0.5%), Asia (34 | 0.5%), China (34 | 0.5%), Eastern Asia (34 | 0.5%), and England (22 | 0.3%), together accounting for 2.4% of all Plattsmouth residents.
| Immigration Origin | # Population | % Population |
| Africa | 12 | 0.2% |
| Asia | 34 | 0.5% |
| Central America | 17 | 0.3% |
| China | 34 | 0.5% |
| Eastern Africa | 2 | 0.0% |
| Eastern Asia | 34 | 0.5% |
| El Salvador | 2 | 0.0% |
| England | 22 | 0.3% |
| Ethiopia | 2 | 0.0% |
| Europe | 36 | 0.5% |
| Guatemala | 4 | 0.1% |
| Italy | 14 | 0.2% |
| Latin America | 17 | 0.3% |
| Mexico | 11 | 0.2% |
| Nigeria | 2 | 0.0% |
| Northern Europe | 22 | 0.3% |
| South Africa | 8 | 0.1% |
| Southern Europe | 14 | 0.2% |
| Western Africa | 2 | 0.0% | View All 19 Rows |
Sex and Age in Plattsmouth
Sex and Age in Plattsmouth
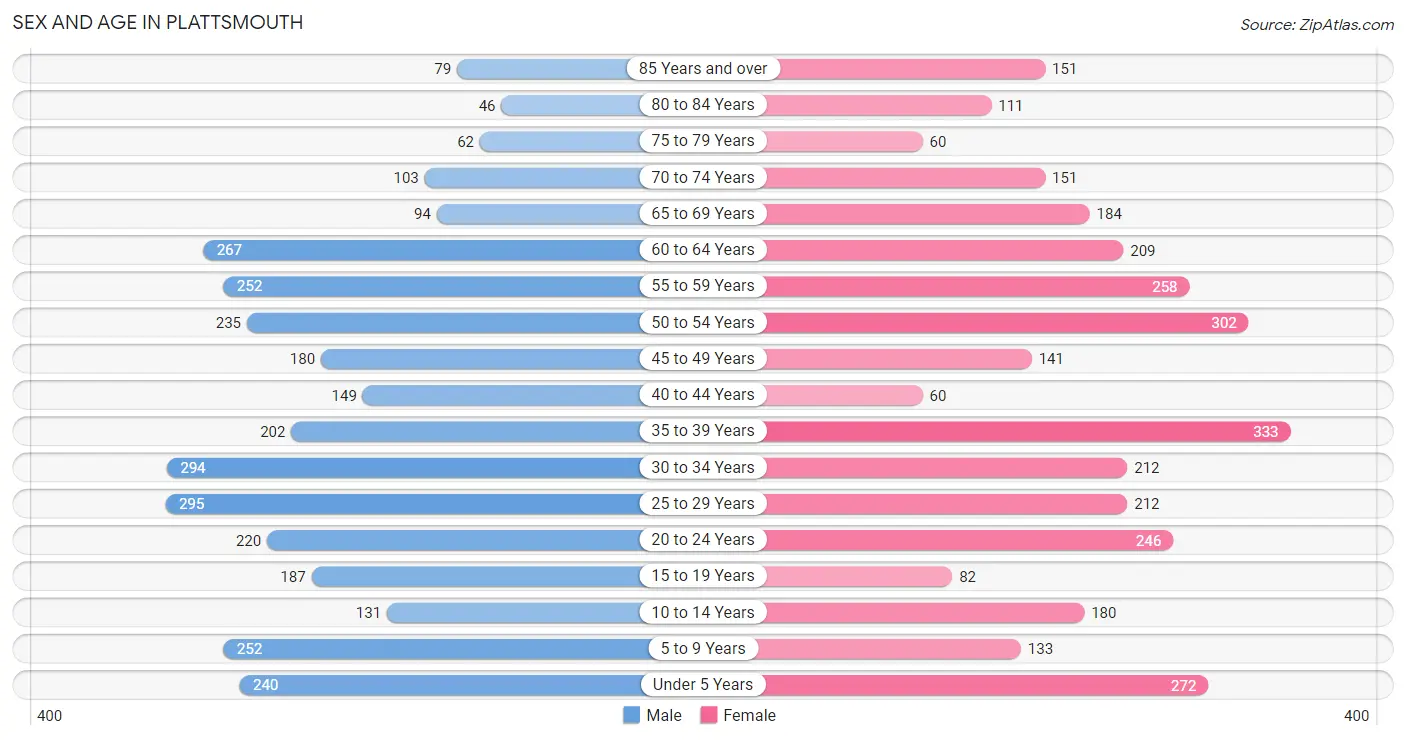
The most populous age groups in Plattsmouth are 25 to 29 Years (295 | 9.0%) for men and 35 to 39 Years (333 | 10.1%) for women.
| Age Bracket | Male | Female |
| Under 5 Years | 240 (7.3%) | 272 (8.3%) |
| 5 to 9 Years | 252 (7.7%) | 133 (4.0%) |
| 10 to 14 Years | 131 (4.0%) | 180 (5.5%) |
| 15 to 19 Years | 187 (5.7%) | 82 (2.5%) |
| 20 to 24 Years | 220 (6.7%) | 246 (7.5%) |
| 25 to 29 Years | 295 (9.0%) | 212 (6.4%) |
| 30 to 34 Years | 294 (8.9%) | 212 (6.4%) |
| 35 to 39 Years | 202 (6.1%) | 333 (10.1%) |
| 40 to 44 Years | 149 (4.5%) | 60 (1.8%) |
| 45 to 49 Years | 180 (5.5%) | 141 (4.3%) |
| 50 to 54 Years | 235 (7.1%) | 302 (9.2%) |
| 55 to 59 Years | 252 (7.7%) | 258 (7.8%) |
| 60 to 64 Years | 267 (8.1%) | 209 (6.3%) |
| 65 to 69 Years | 94 (2.9%) | 184 (5.6%) |
| 70 to 74 Years | 103 (3.1%) | 151 (4.6%) |
| 75 to 79 Years | 62 (1.9%) | 60 (1.8%) |
| 80 to 84 Years | 46 (1.4%) | 111 (3.4%) |
| 85 Years and over | 79 (2.4%) | 151 (4.6%) |
| Total | 3,288 (100.0%) | 3,297 (100.0%) |
Families and Households in Plattsmouth
Median Family Size in Plattsmouth
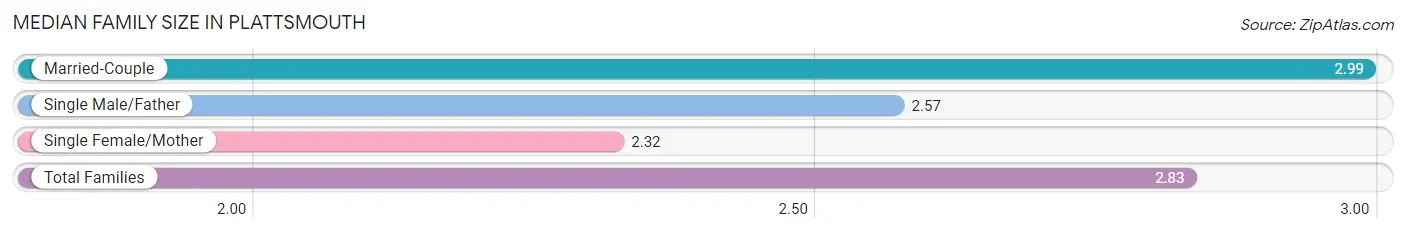
The median family size in Plattsmouth is 2.83 persons per family, with married-couple families (1,236 | 71.6%) accounting for the largest median family size of 2.99 persons per family. On the other hand, single female/mother families (287 | 16.6%) represent the smallest median family size with 2.32 persons per family.
| Family Type | # Families | Family Size |
| Married-Couple | 1,236 (71.6%) | 2.99 |
| Single Male/Father | 204 (11.8%) | 2.57 |
| Single Female/Mother | 287 (16.6%) | 2.32 |
| Total Families | 1,727 (100.0%) | 2.83 |
Median Household Size in Plattsmouth
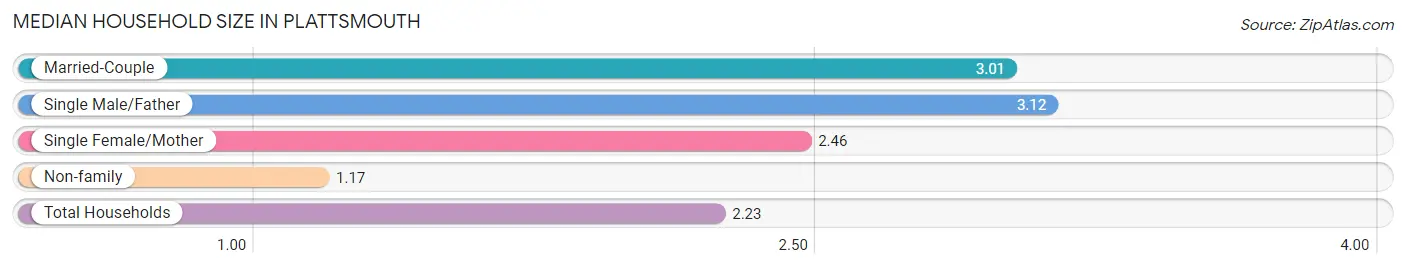
The median household size in Plattsmouth is 2.23 persons per household, with single male/father households (204 | 7.1%) accounting for the largest median household size of 3.12 persons per household. non-family households (1,146 | 39.9%) represent the smallest median household size with 1.17 persons per household.
| Household Type | # Households | Household Size |
| Married-Couple | 1,236 (43.0%) | 3.01 |
| Single Male/Father | 204 (7.1%) | 3.12 |
| Single Female/Mother | 287 (10.0%) | 2.46 |
| Non-family | 1,146 (39.9%) | 1.17 |
| Total Households | 2,873 (100.0%) | 2.23 |
Household Size by Marriage Status in Plattsmouth
Out of a total of 2,873 households in Plattsmouth, 1,727 (60.1%) are family households, while 1,146 (39.9%) are nonfamily households. The most numerous type of family households are 2-person households, comprising 829, and the most common type of nonfamily households are 1-person households, comprising 971.
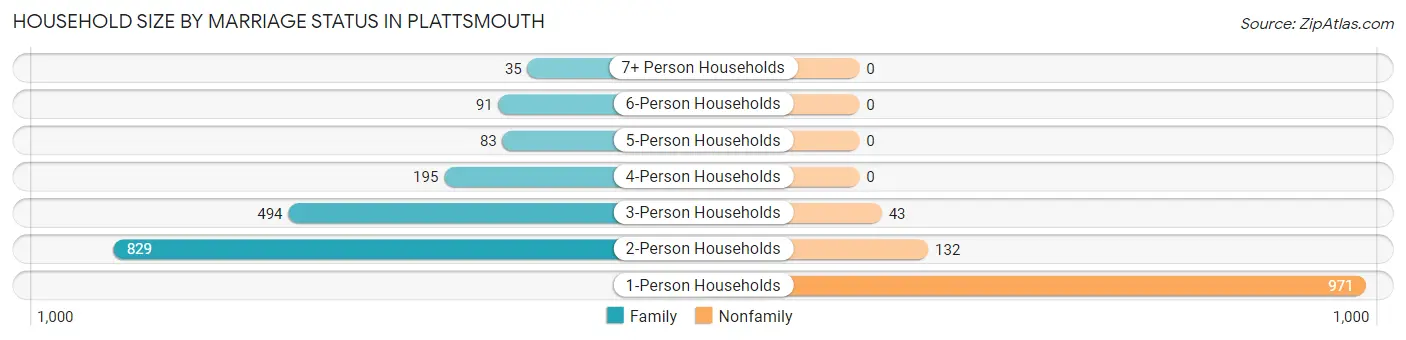
| Household Size | Family Households | Nonfamily Households |
| 1-Person Households | - | 971 (33.8%) |
| 2-Person Households | 829 (28.8%) | 132 (4.6%) |
| 3-Person Households | 494 (17.2%) | 43 (1.5%) |
| 4-Person Households | 195 (6.8%) | 0 (0.0%) |
| 5-Person Households | 83 (2.9%) | 0 (0.0%) |
| 6-Person Households | 91 (3.2%) | 0 (0.0%) |
| 7+ Person Households | 35 (1.2%) | 0 (0.0%) |
| Total | 1,727 (60.1%) | 1,146 (39.9%) |
Female Fertility in Plattsmouth
Fertility by Age in Plattsmouth
Average fertility rate in Plattsmouth is 66.0 births per 1,000 women. Women in the age bracket of 20 to 34 years have the highest fertility rate with 107.0 births per 1,000 women. Women in the age bracket of 20 to 34 years acount for 78.3% of all women with births.
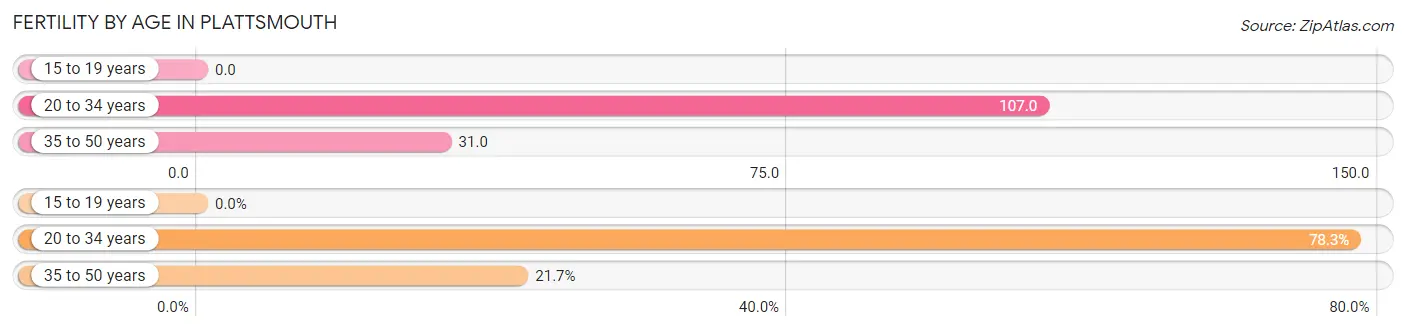
| Age Bracket | Women with Births | Births / 1,000 Women |
| 15 to 19 years | 0 (0.0%) | 0.0 |
| 20 to 34 years | 72 (78.3%) | 107.0 |
| 35 to 50 years | 20 (21.7%) | 31.0 |
| Total | 92 (100.0%) | 66.0 |
Fertility by Age by Marriage Status in Plattsmouth
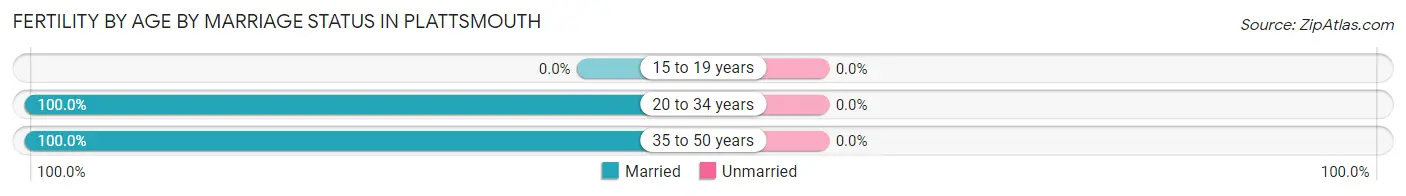
| Age Bracket | Married | Unmarried |
| 15 to 19 years | 0 (0.0%) | 0 (0.0%) |
| 20 to 34 years | 72 (100.0%) | 0 (0.0%) |
| 35 to 50 years | 20 (100.0%) | 0 (0.0%) |
| Total | 92 (100.0%) | 0 (0.0%) |
Fertility by Education in Plattsmouth
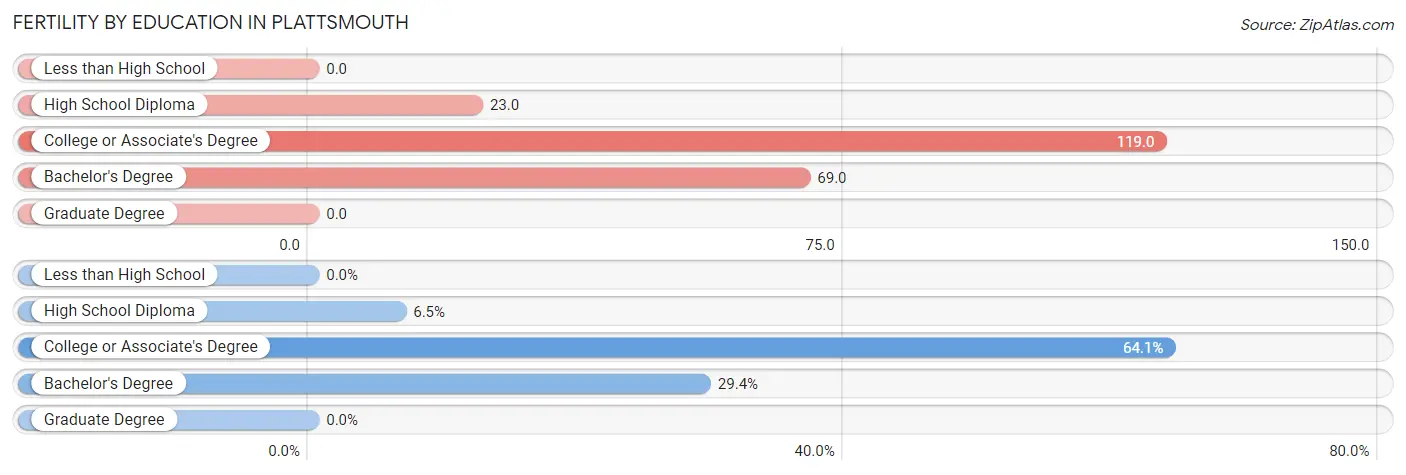
| Educational Attainment | Women with Births | Births / 1,000 Women |
| Less than High School | 0 (0.0%) | 0.0 |
| High School Diploma | 6 (6.5%) | 23.0 |
| College or Associate's Degree | 59 (64.1%) | 119.0 |
| Bachelor's Degree | 27 (29.3%) | 69.0 |
| Graduate Degree | 0 (0.0%) | 0.0 |
| Total | 92 (100.0%) | 66.0 |
Fertility by Education by Marriage Status in Plattsmouth
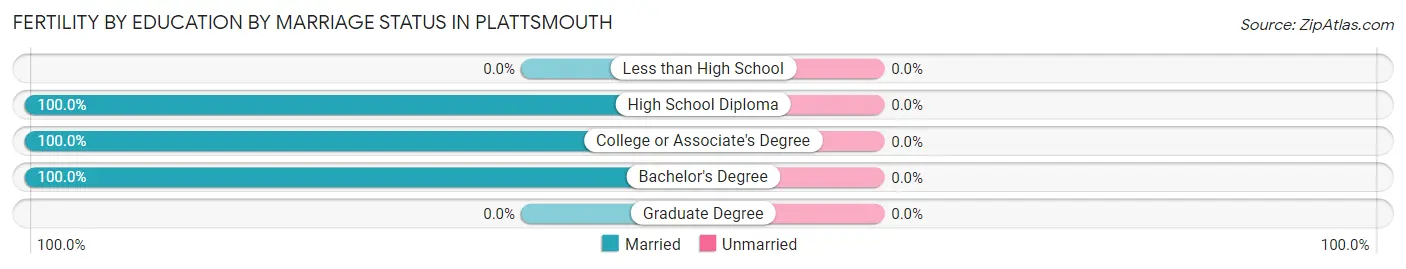
| Educational Attainment | Married | Unmarried |
| Less than High School | 0 (0.0%) | 0 (0.0%) |
| High School Diploma | 6 (100.0%) | 0 (0.0%) |
| College or Associate's Degree | 59 (100.0%) | 0 (0.0%) |
| Bachelor's Degree | 27 (100.0%) | 0 (0.0%) |
| Graduate Degree | 0 (0.0%) | 0 (0.0%) |
| Total | 92 (100.0%) | 0 (0.0%) |
Employment Characteristics in Plattsmouth
Employment by Class of Employer in Plattsmouth
Among the 3,424 employed individuals in Plattsmouth, private company employees (2,486 | 72.6%), not-for-profit organizations (238 | 7.0%), and self-employed (not incorporated) (217 | 6.3%) make up the most common classes of employment.
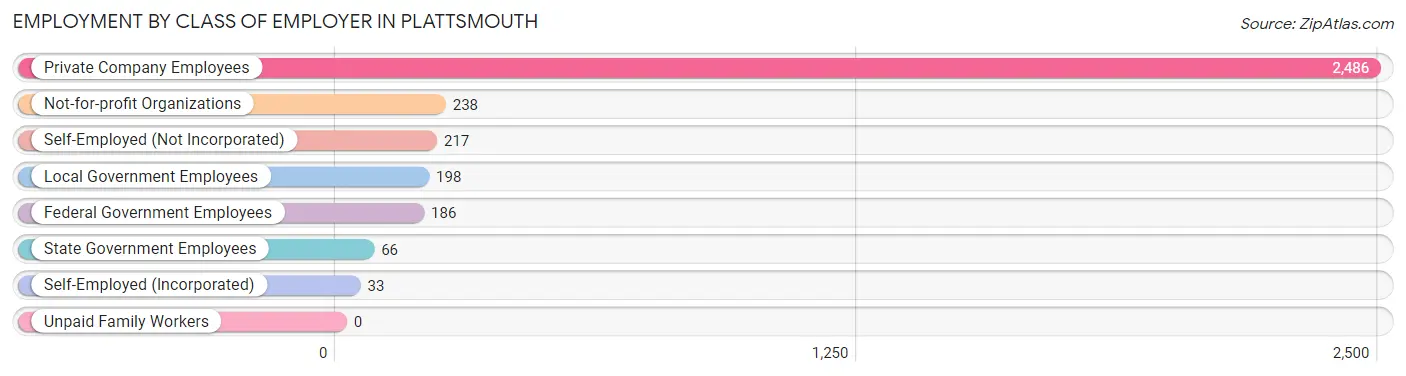
| Employer Class | # Employees | % Employees |
| Private Company Employees | 2,486 | 72.6% |
| Self-Employed (Incorporated) | 33 | 1.0% |
| Self-Employed (Not Incorporated) | 217 | 6.3% |
| Not-for-profit Organizations | 238 | 7.0% |
| Local Government Employees | 198 | 5.8% |
| State Government Employees | 66 | 1.9% |
| Federal Government Employees | 186 | 5.4% |
| Unpaid Family Workers | 0 | 0.0% |
| Total | 3,424 | 100.0% |
Employment Status by Age in Plattsmouth
According to the labor force statistics for Plattsmouth, out of the total population over 16 years of age (5,327), 65.9% or 3,510 individuals are in the labor force, with 0.7% or 25 of them unemployed. The age group with the highest labor force participation rate is 45 to 54 years, with 91.0% or 781 individuals in the labor force. Within the labor force, the 75 years and over age range has the highest percentage of unemployed individuals, with 100.0% or 14 of them being unemployed.
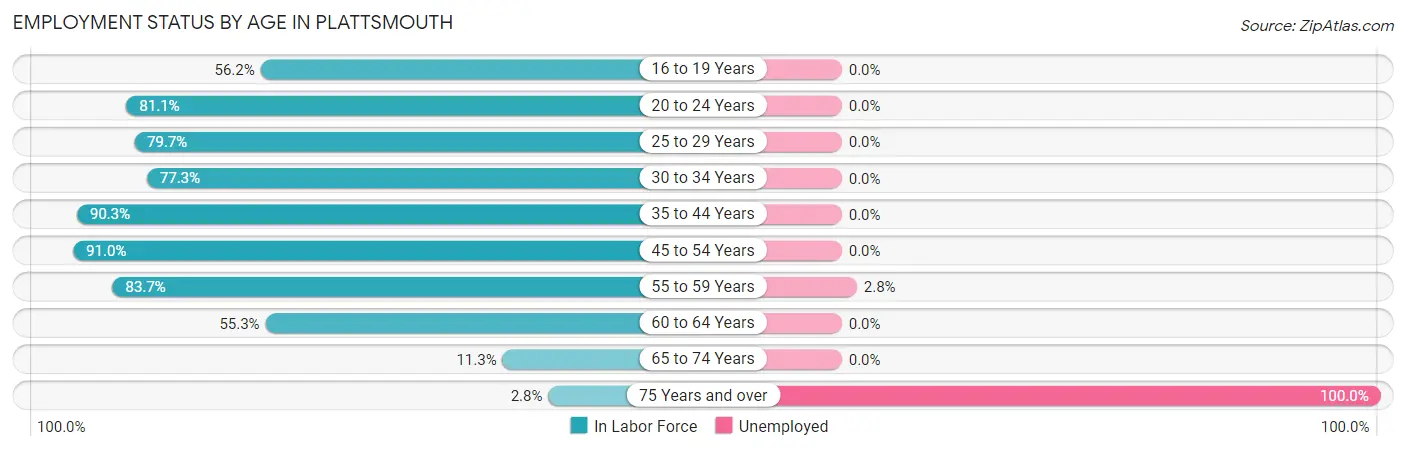
| Age Bracket | In Labor Force | Unemployed |
| 16 to 19 Years | 123 (56.2%) | 0 (0.0%) |
| 20 to 24 Years | 378 (81.1%) | 0 (0.0%) |
| 25 to 29 Years | 404 (79.7%) | 0 (0.0%) |
| 30 to 34 Years | 391 (77.3%) | 0 (0.0%) |
| 35 to 44 Years | 672 (90.3%) | 0 (0.0%) |
| 45 to 54 Years | 781 (91.0%) | 0 (0.0%) |
| 55 to 59 Years | 427 (83.7%) | 12 (2.8%) |
| 60 to 64 Years | 263 (55.3%) | 0 (0.0%) |
| 65 to 74 Years | 60 (11.3%) | 0 (0.0%) |
| 75 Years and over | 14 (2.8%) | 14 (100.0%) |
| Total | 3,510 (65.9%) | 25 (0.7%) |
Employment Status by Educational Attainment in Plattsmouth
According to labor force statistics for Plattsmouth, 81.6% of individuals (2,938) out of the total population between 25 and 64 years of age (3,601) are in the labor force, with 0.4% or 12 of them being unemployed. The group with the highest labor force participation rate are those with the educational attainment of bachelor's degree or higher, with 87.3% or 665 individuals in the labor force. Within the labor force, individuals with high school diploma education have the highest percentage of unemployment, with 1.3% or 12 of them being unemployed.
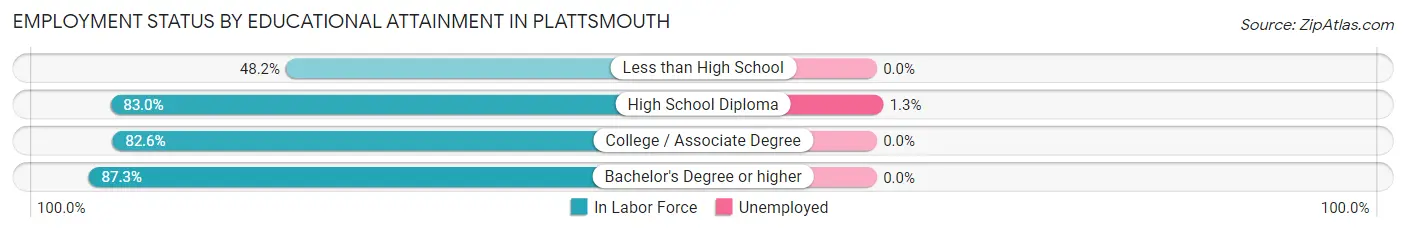
| Educational Attainment | In Labor Force | Unemployed |
| Less than High School | 107 (48.2%) | 0 (0.0%) |
| High School Diploma | 925 (83.0%) | 14 (1.3%) |
| College / Associate Degree | 1,241 (82.6%) | 0 (0.0%) |
| Bachelor's Degree or higher | 665 (87.3%) | 0 (0.0%) |
| Total | 2,938 (81.6%) | 14 (0.4%) |
Employment Occupations by Sex in Plattsmouth
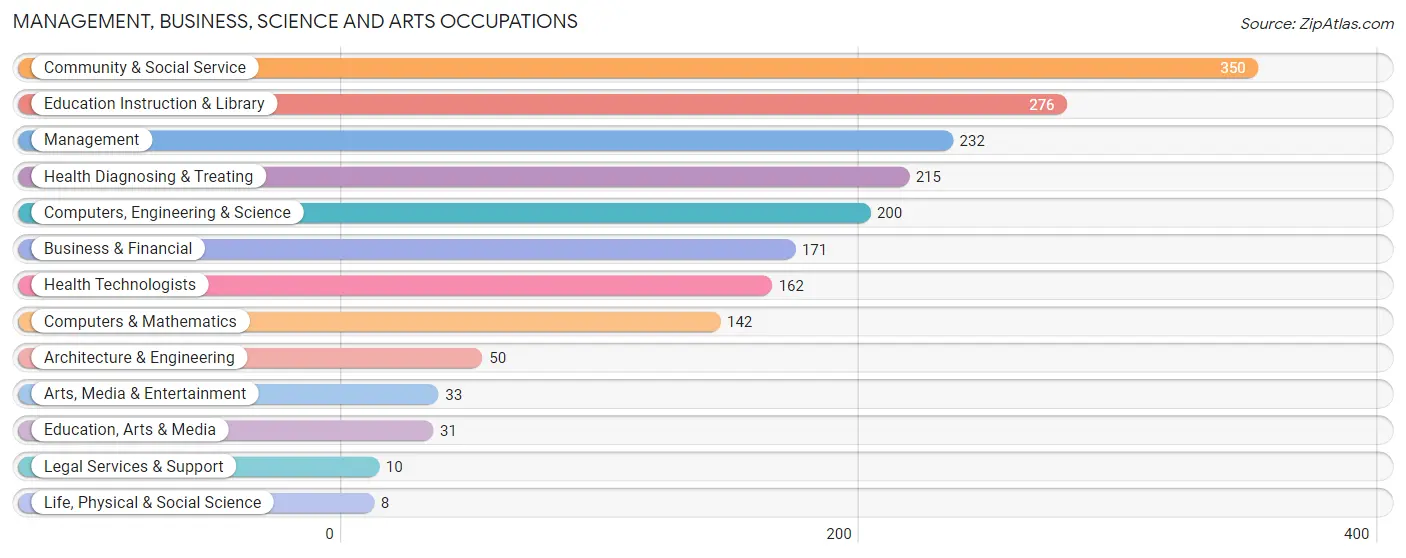
Management, Business, Science and Arts Occupations
The most common Management, Business, Science and Arts occupations in Plattsmouth are Community & Social Service (350 | 10.1%), Education Instruction & Library (276 | 8.0%), Management (232 | 6.7%), Health Diagnosing & Treating (215 | 6.2%), and Computers, Engineering & Science (200 | 5.8%).
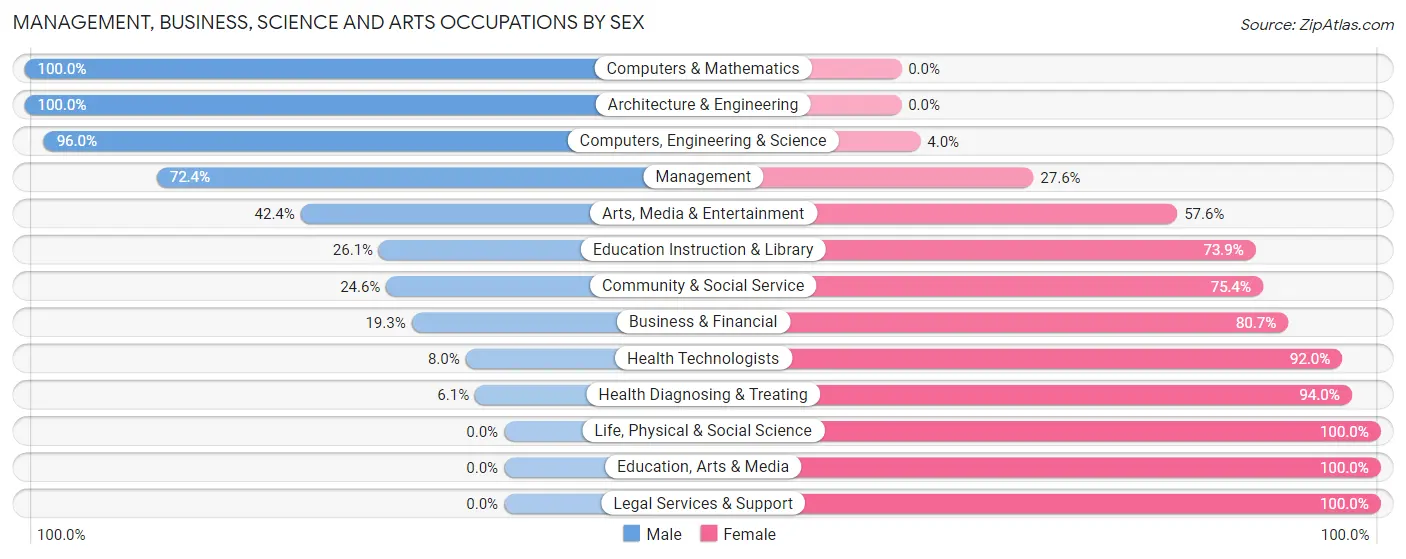
Management, Business, Science and Arts Occupations by Sex
Within the Management, Business, Science and Arts occupations in Plattsmouth, the most male-oriented occupations are Computers & Mathematics (100.0%), Architecture & Engineering (100.0%), and Computers, Engineering & Science (96.0%), while the most female-oriented occupations are Life, Physical & Social Science (100.0%), Education, Arts & Media (100.0%), and Legal Services & Support (100.0%).
| Occupation | Male | Female |
| Management | 168 (72.4%) | 64 (27.6%) |
| Business & Financial | 33 (19.3%) | 138 (80.7%) |
| Computers, Engineering & Science | 192 (96.0%) | 8 (4.0%) |
| Computers & Mathematics | 142 (100.0%) | 0 (0.0%) |
| Architecture & Engineering | 50 (100.0%) | 0 (0.0%) |
| Life, Physical & Social Science | 0 (0.0%) | 8 (100.0%) |
| Community & Social Service | 86 (24.6%) | 264 (75.4%) |
| Education, Arts & Media | 0 (0.0%) | 31 (100.0%) |
| Legal Services & Support | 0 (0.0%) | 10 (100.0%) |
| Education Instruction & Library | 72 (26.1%) | 204 (73.9%) |
| Arts, Media & Entertainment | 14 (42.4%) | 19 (57.6%) |
| Health Diagnosing & Treating | 13 (6.0%) | 202 (94.0%) |
| Health Technologists | 13 (8.0%) | 149 (92.0%) |
| Total (Category) | 492 (42.1%) | 676 (57.9%) |
| Total (Overall) | 1,875 (54.2%) | 1,584 (45.8%) |
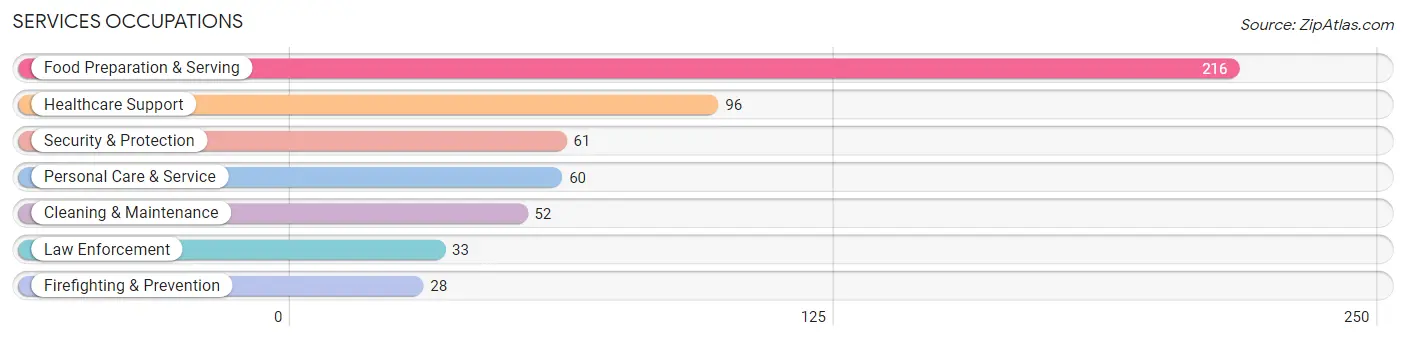
Services Occupations
The most common Services occupations in Plattsmouth are Food Preparation & Serving (216 | 6.2%), Healthcare Support (96 | 2.8%), Security & Protection (61 | 1.8%), Personal Care & Service (60 | 1.7%), and Cleaning & Maintenance (52 | 1.5%).
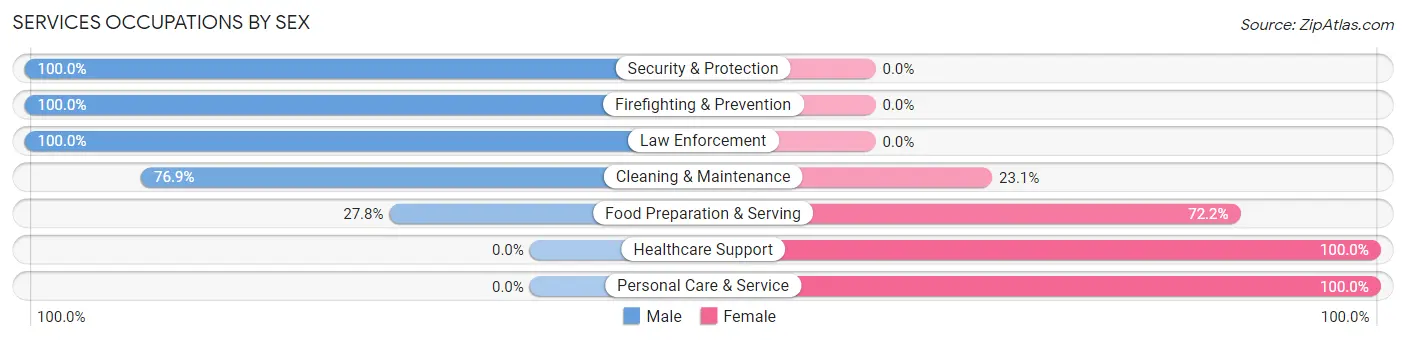
Services Occupations by Sex
Within the Services occupations in Plattsmouth, the most male-oriented occupations are Security & Protection (100.0%), Firefighting & Prevention (100.0%), and Law Enforcement (100.0%), while the most female-oriented occupations are Healthcare Support (100.0%), Personal Care & Service (100.0%), and Food Preparation & Serving (72.2%).
| Occupation | Male | Female |
| Healthcare Support | 0 (0.0%) | 96 (100.0%) |
| Security & Protection | 61 (100.0%) | 0 (0.0%) |
| Firefighting & Prevention | 28 (100.0%) | 0 (0.0%) |
| Law Enforcement | 33 (100.0%) | 0 (0.0%) |
| Food Preparation & Serving | 60 (27.8%) | 156 (72.2%) |
| Cleaning & Maintenance | 40 (76.9%) | 12 (23.1%) |
| Personal Care & Service | 0 (0.0%) | 60 (100.0%) |
| Total (Category) | 161 (33.2%) | 324 (66.8%) |
| Total (Overall) | 1,875 (54.2%) | 1,584 (45.8%) |
Sales and Office Occupations
The most common Sales and Office occupations in Plattsmouth are Office & Administration (378 | 10.9%), and Sales & Related (340 | 9.8%).
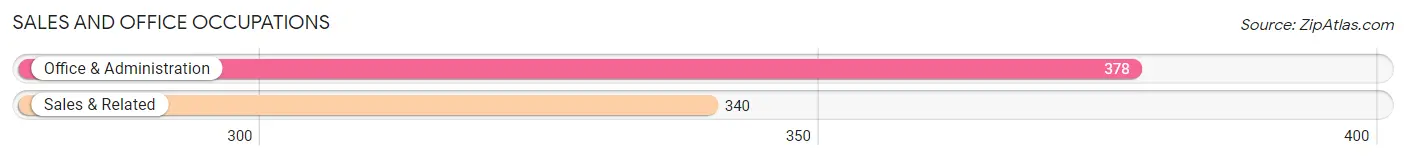
Sales and Office Occupations by Sex
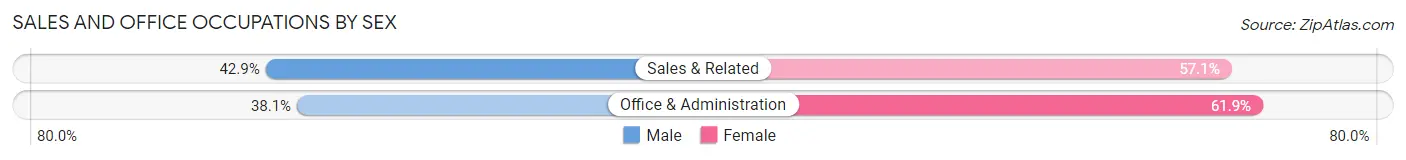
| Occupation | Male | Female |
| Sales & Related | 146 (42.9%) | 194 (57.1%) |
| Office & Administration | 144 (38.1%) | 234 (61.9%) |
| Total (Category) | 290 (40.4%) | 428 (59.6%) |
| Total (Overall) | 1,875 (54.2%) | 1,584 (45.8%) |
Natural Resources, Construction and Maintenance Occupations
The most common Natural Resources, Construction and Maintenance occupations in Plattsmouth are Installation, Maintenance & Repair (364 | 10.5%), and Construction & Extraction (177 | 5.1%).
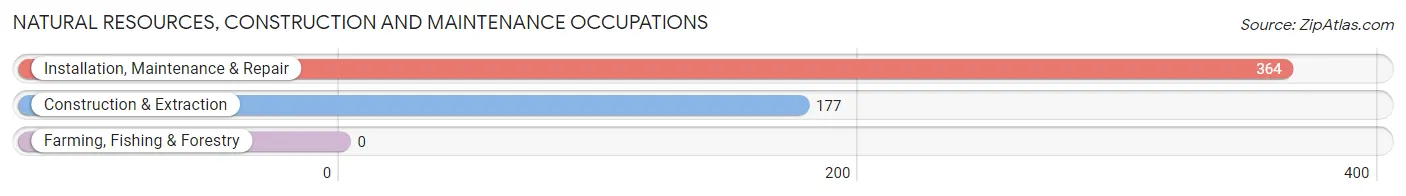
Natural Resources, Construction and Maintenance Occupations by Sex
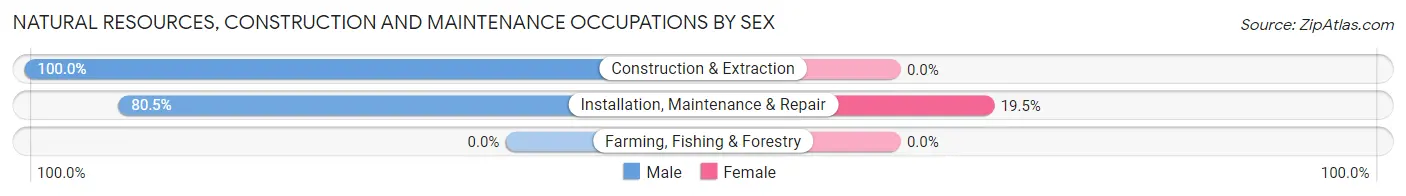
| Occupation | Male | Female |
| Farming, Fishing & Forestry | 0 (0.0%) | 0 (0.0%) |
| Construction & Extraction | 177 (100.0%) | 0 (0.0%) |
| Installation, Maintenance & Repair | 293 (80.5%) | 71 (19.5%) |
| Total (Category) | 470 (86.9%) | 71 (13.1%) |
| Total (Overall) | 1,875 (54.2%) | 1,584 (45.8%) |
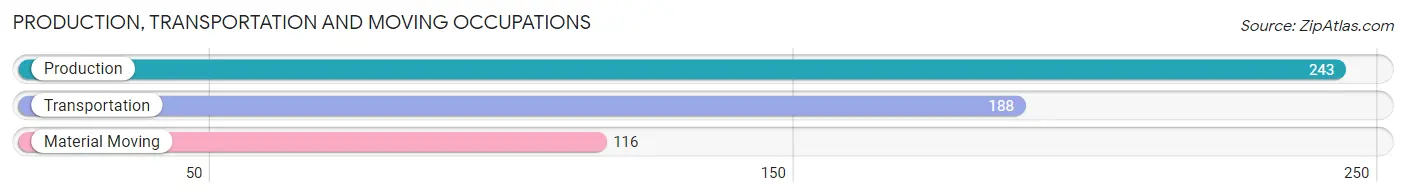
Production, Transportation and Moving Occupations
The most common Production, Transportation and Moving occupations in Plattsmouth are Production (243 | 7.0%), Transportation (188 | 5.4%), and Material Moving (116 | 3.4%).
Production, Transportation and Moving Occupations by Sex
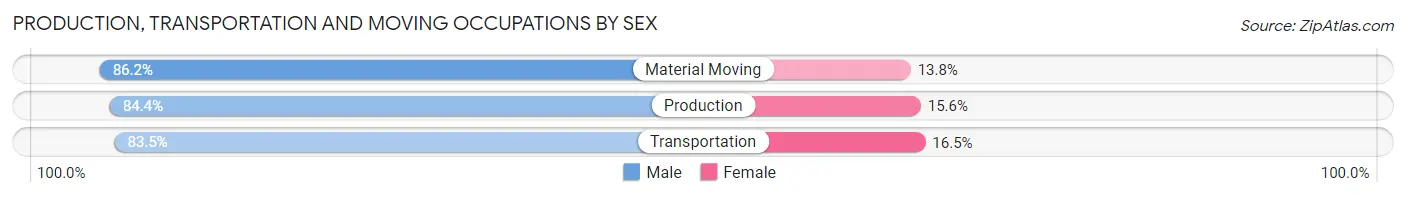
| Occupation | Male | Female |
| Production | 205 (84.4%) | 38 (15.6%) |
| Transportation | 157 (83.5%) | 31 (16.5%) |
| Material Moving | 100 (86.2%) | 16 (13.8%) |
| Total (Category) | 462 (84.5%) | 85 (15.5%) |
| Total (Overall) | 1,875 (54.2%) | 1,584 (45.8%) |
Employment Industries by Sex in Plattsmouth
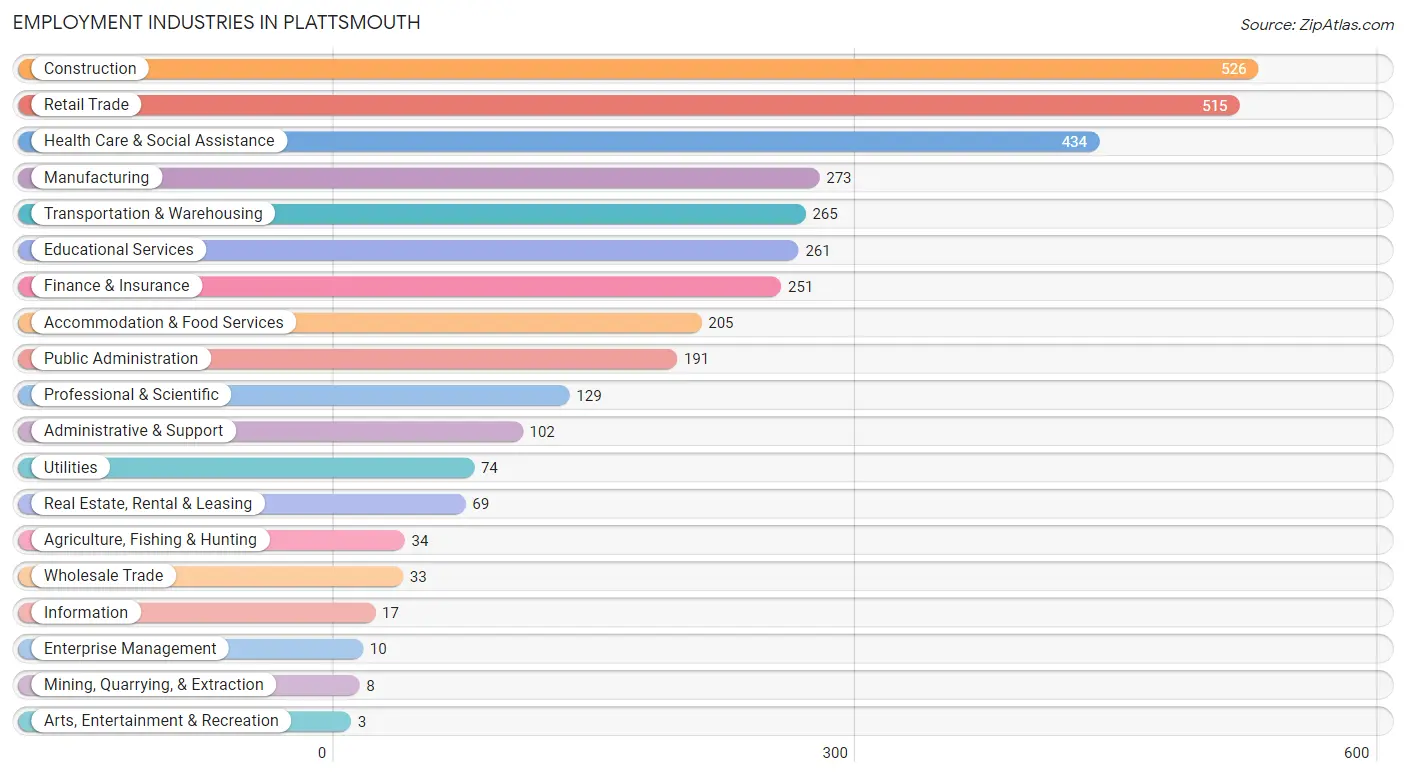
Employment Industries in Plattsmouth
The major employment industries in Plattsmouth include Construction (526 | 15.2%), Retail Trade (515 | 14.9%), Health Care & Social Assistance (434 | 12.6%), Manufacturing (273 | 7.9%), and Transportation & Warehousing (265 | 7.7%).
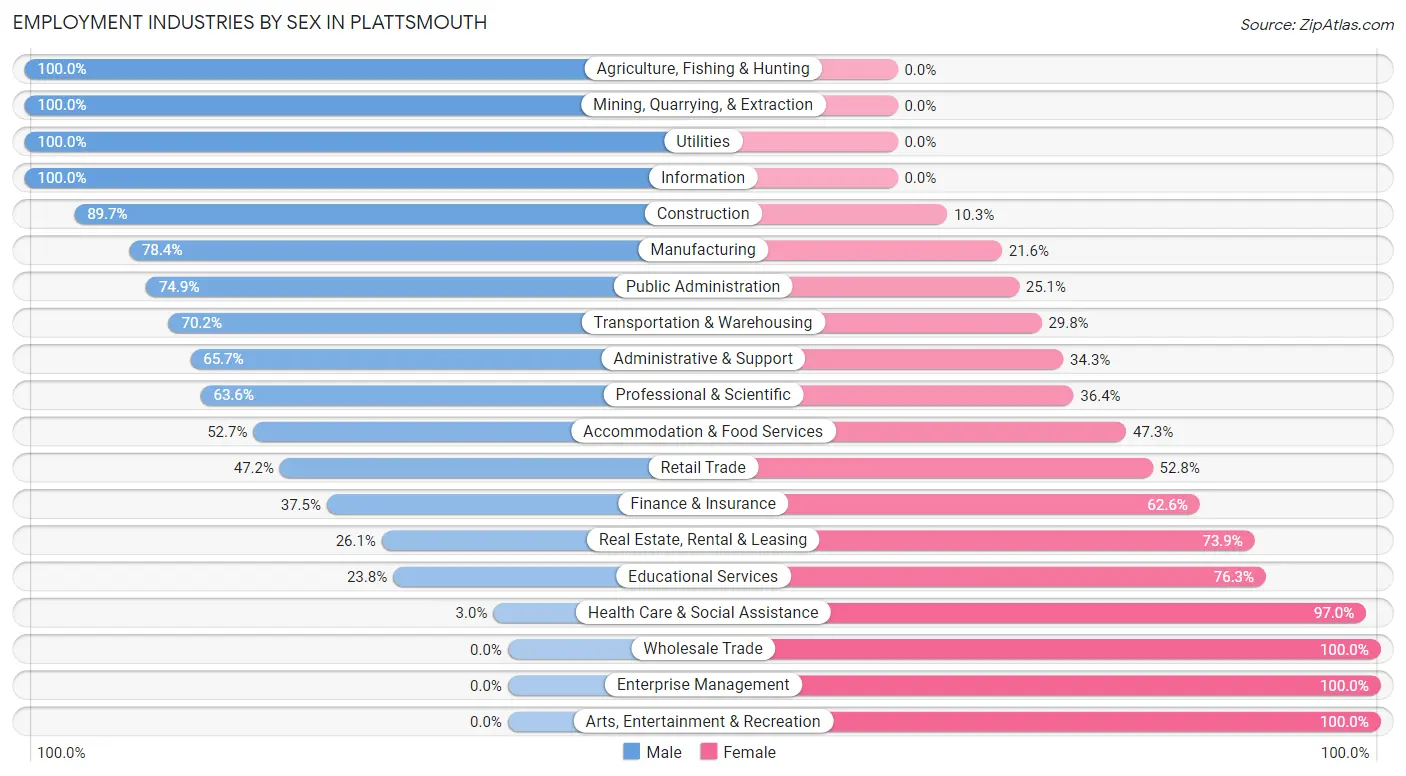
Employment Industries by Sex in Plattsmouth
The Plattsmouth industries that see more men than women are Agriculture, Fishing & Hunting (100.0%), Mining, Quarrying, & Extraction (100.0%), and Utilities (100.0%), whereas the industries that tend to have a higher number of women are Wholesale Trade (100.0%), Enterprise Management (100.0%), and Arts, Entertainment & Recreation (100.0%).
| Industry | Male | Female |
| Agriculture, Fishing & Hunting | 34 (100.0%) | 0 (0.0%) |
| Mining, Quarrying, & Extraction | 8 (100.0%) | 0 (0.0%) |
| Construction | 472 (89.7%) | 54 (10.3%) |
| Manufacturing | 214 (78.4%) | 59 (21.6%) |
| Wholesale Trade | 0 (0.0%) | 33 (100.0%) |
| Retail Trade | 243 (47.2%) | 272 (52.8%) |
| Transportation & Warehousing | 186 (70.2%) | 79 (29.8%) |
| Utilities | 74 (100.0%) | 0 (0.0%) |
| Information | 17 (100.0%) | 0 (0.0%) |
| Finance & Insurance | 94 (37.4%) | 157 (62.5%) |
| Real Estate, Rental & Leasing | 18 (26.1%) | 51 (73.9%) |
| Professional & Scientific | 82 (63.6%) | 47 (36.4%) |
| Enterprise Management | 0 (0.0%) | 10 (100.0%) |
| Administrative & Support | 67 (65.7%) | 35 (34.3%) |
| Educational Services | 62 (23.7%) | 199 (76.2%) |
| Health Care & Social Assistance | 13 (3.0%) | 421 (97.0%) |
| Arts, Entertainment & Recreation | 0 (0.0%) | 3 (100.0%) |
| Accommodation & Food Services | 108 (52.7%) | 97 (47.3%) |
| Public Administration | 143 (74.9%) | 48 (25.1%) |
| Total | 1,875 (54.2%) | 1,584 (45.8%) |
Education in Plattsmouth
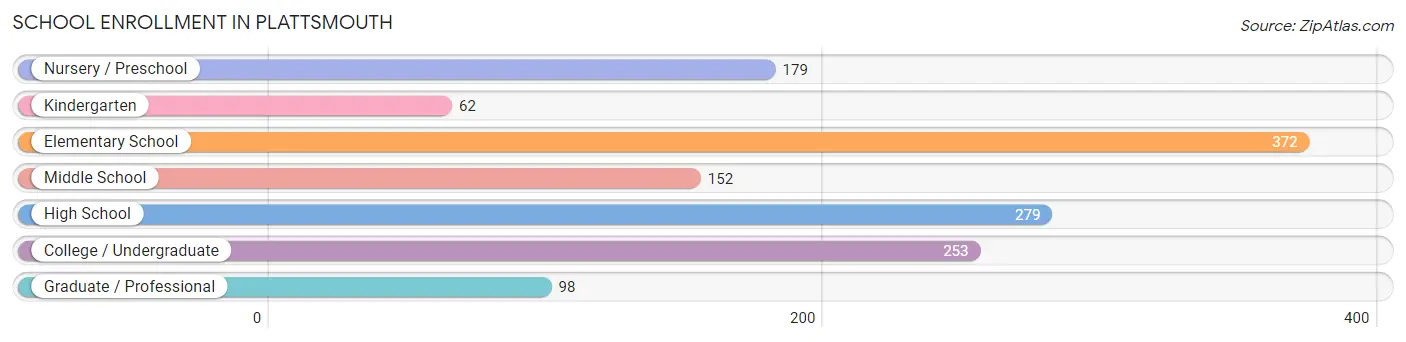
School Enrollment in Plattsmouth
The most common levels of schooling among the 1,395 students in Plattsmouth are elementary school (372 | 26.7%), high school (279 | 20.0%), and college / undergraduate (253 | 18.1%).
| School Level | # Students | % Students |
| Nursery / Preschool | 179 | 12.8% |
| Kindergarten | 62 | 4.4% |
| Elementary School | 372 | 26.7% |
| Middle School | 152 | 10.9% |
| High School | 279 | 20.0% |
| College / Undergraduate | 253 | 18.1% |
| Graduate / Professional | 98 | 7.0% |
| Total | 1,395 | 100.0% |
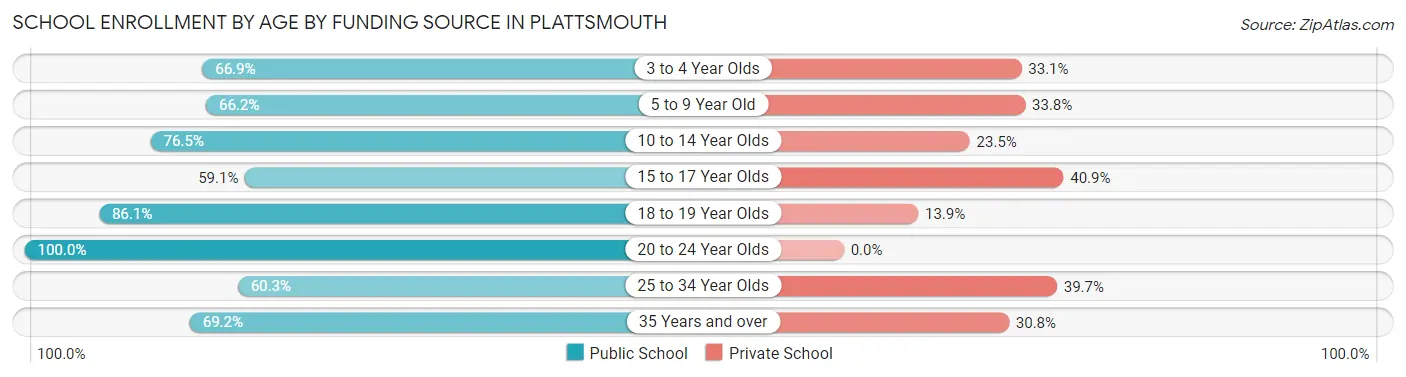
School Enrollment by Age by Funding Source in Plattsmouth
Out of a total of 1,395 students who are enrolled in schools in Plattsmouth, 400 (28.7%) attend a private institution, while the remaining 995 (71.3%) are enrolled in public schools. The age group of 15 to 17 year olds has the highest likelihood of being enrolled in private schools, with 54 (40.9% in the age bracket) enrolled. Conversely, the age group of 20 to 24 year olds has the lowest likelihood of being enrolled in a private school, with 113 (100.0% in the age bracket) attending a public institution.
| Age Bracket | Public School | Private School |
| 3 to 4 Year Olds | 97 (66.9%) | 48 (33.1%) |
| 5 to 9 Year Old | 235 (66.2%) | 120 (33.8%) |
| 10 to 14 Year Olds | 238 (76.5%) | 73 (23.5%) |
| 15 to 17 Year Olds | 78 (59.1%) | 54 (40.9%) |
| 18 to 19 Year Olds | 87 (86.1%) | 14 (13.9%) |
| 20 to 24 Year Olds | 113 (100.0%) | 0 (0.0%) |
| 25 to 34 Year Olds | 120 (60.3%) | 79 (39.7%) |
| 35 Years and over | 27 (69.2%) | 12 (30.8%) |
| Total | 995 (71.3%) | 400 (28.7%) |
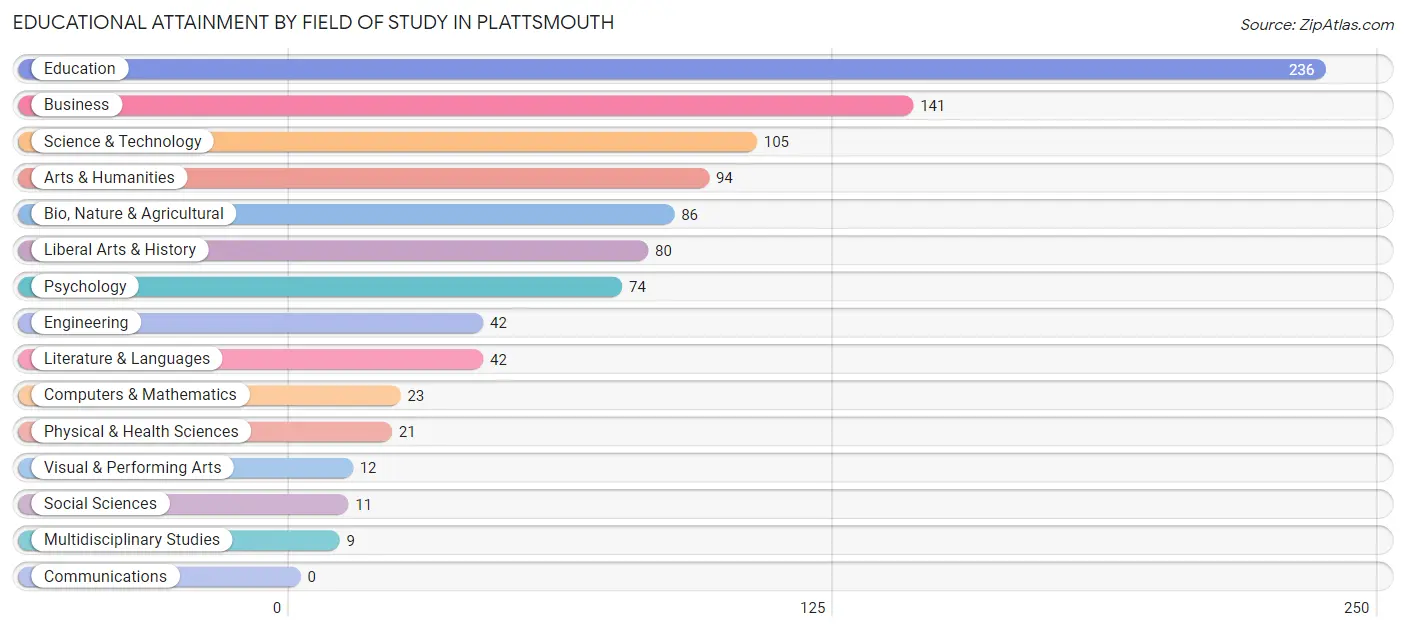
Educational Attainment by Field of Study in Plattsmouth
Education (236 | 24.2%), business (141 | 14.4%), science & technology (105 | 10.8%), arts & humanities (94 | 9.6%), and bio, nature & agricultural (86 | 8.8%) are the most common fields of study among 976 individuals in Plattsmouth who have obtained a bachelor's degree or higher.
| Field of Study | # Graduates | % Graduates |
| Computers & Mathematics | 23 | 2.4% |
| Bio, Nature & Agricultural | 86 | 8.8% |
| Physical & Health Sciences | 21 | 2.1% |
| Psychology | 74 | 7.6% |
| Social Sciences | 11 | 1.1% |
| Engineering | 42 | 4.3% |
| Multidisciplinary Studies | 9 | 0.9% |
| Science & Technology | 105 | 10.8% |
| Business | 141 | 14.4% |
| Education | 236 | 24.2% |
| Literature & Languages | 42 | 4.3% |
| Liberal Arts & History | 80 | 8.2% |
| Visual & Performing Arts | 12 | 1.2% |
| Communications | 0 | 0.0% |
| Arts & Humanities | 94 | 9.6% |
| Total | 976 | 100.0% |
Transportation & Commute in Plattsmouth
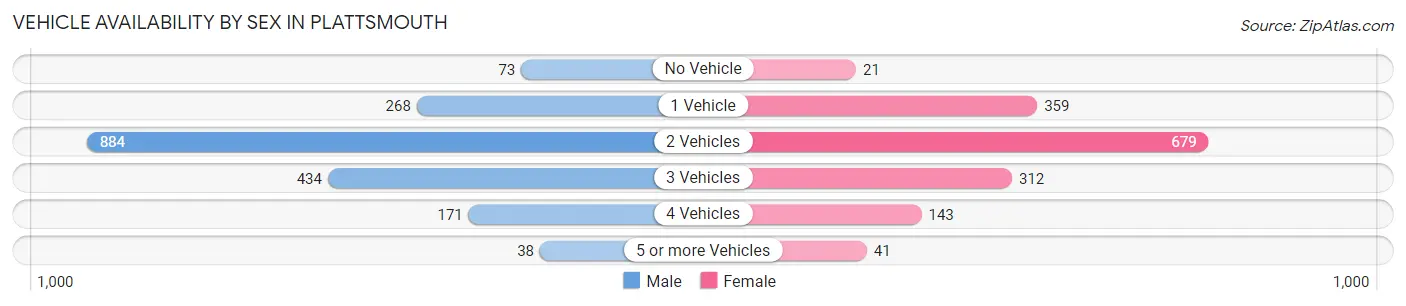
Vehicle Availability by Sex in Plattsmouth
The most prevalent vehicle ownership categories in Plattsmouth are males with 2 vehicles (884, accounting for 47.3%) and females with 2 vehicles (679, making up 56.9%).
| Vehicles Available | Male | Female |
| No Vehicle | 73 (3.9%) | 21 (1.3%) |
| 1 Vehicle | 268 (14.3%) | 359 (23.1%) |
| 2 Vehicles | 884 (47.3%) | 679 (43.7%) |
| 3 Vehicles | 434 (23.2%) | 312 (20.1%) |
| 4 Vehicles | 171 (9.1%) | 143 (9.2%) |
| 5 or more Vehicles | 38 (2.0%) | 41 (2.6%) |
| Total | 1,868 (100.0%) | 1,555 (100.0%) |
Commute Time in Plattsmouth
The most frequently occuring commute durations in Plattsmouth are 30 to 34 minutes (579 commuters, 17.9%), 5 to 9 minutes (455 commuters, 14.1%), and 45 to 59 minutes (447 commuters, 13.8%).
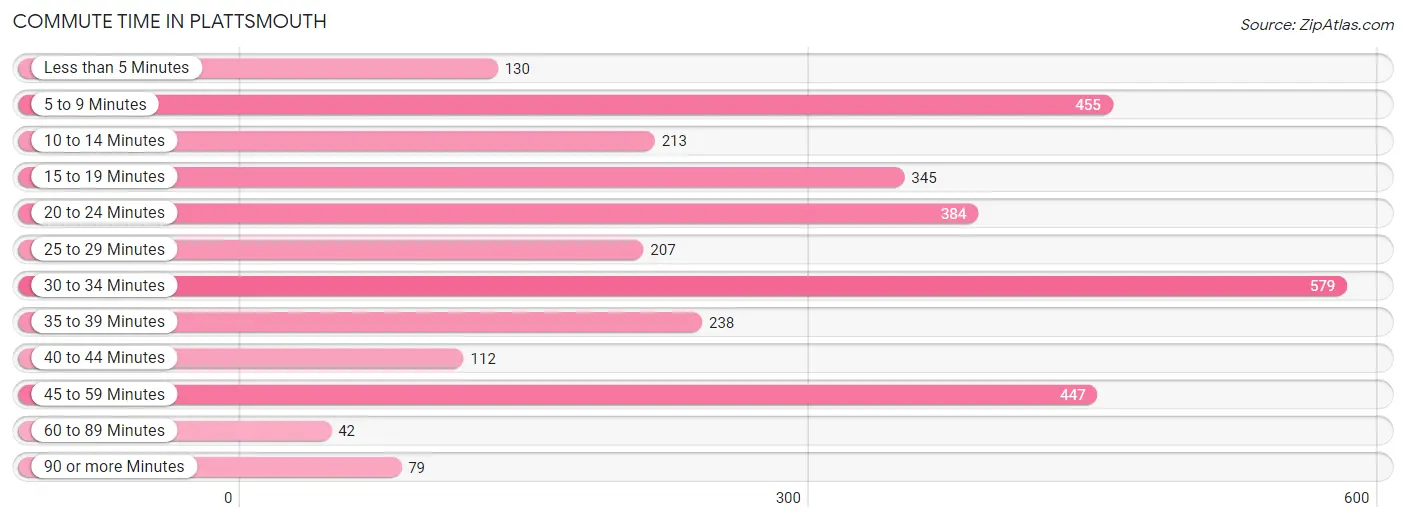
| Commute Time | # Commuters | % Commuters |
| Less than 5 Minutes | 130 | 4.0% |
| 5 to 9 Minutes | 455 | 14.1% |
| 10 to 14 Minutes | 213 | 6.6% |
| 15 to 19 Minutes | 345 | 10.7% |
| 20 to 24 Minutes | 384 | 11.9% |
| 25 to 29 Minutes | 207 | 6.4% |
| 30 to 34 Minutes | 579 | 17.9% |
| 35 to 39 Minutes | 238 | 7.4% |
| 40 to 44 Minutes | 112 | 3.5% |
| 45 to 59 Minutes | 447 | 13.8% |
| 60 to 89 Minutes | 42 | 1.3% |
| 90 or more Minutes | 79 | 2.5% |
Commute Time by Sex in Plattsmouth
The most common commute times in Plattsmouth are 30 to 34 minutes (358 commuters, 19.9%) for males and 5 to 9 minutes (279 commuters, 19.5%) for females.
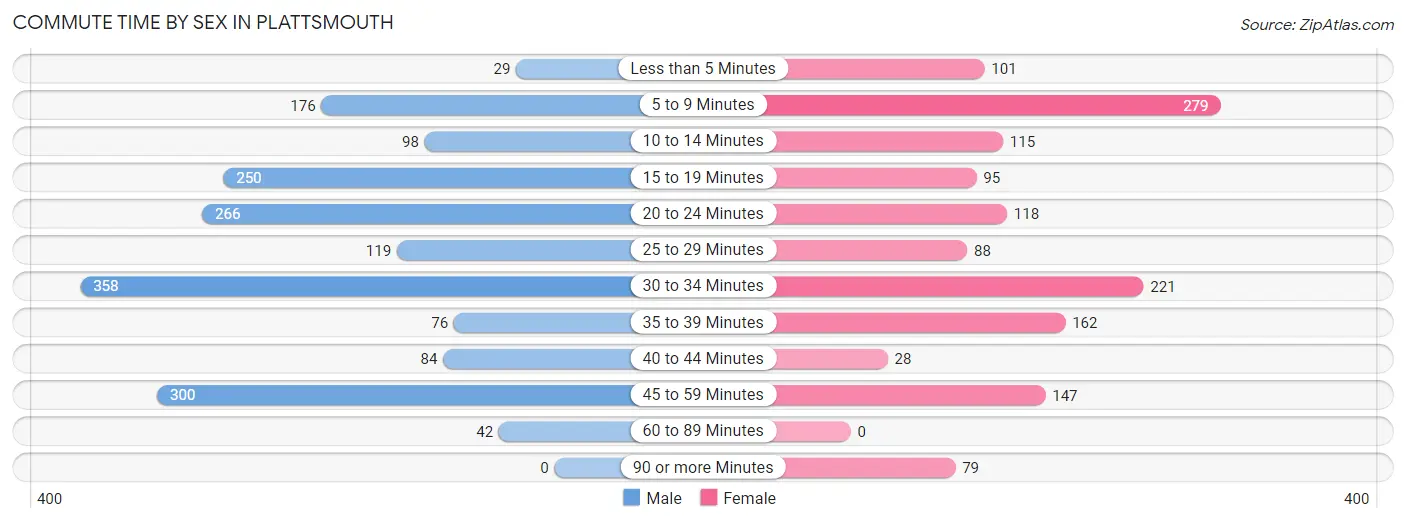
| Commute Time | Male | Female |
| Less than 5 Minutes | 29 (1.6%) | 101 (7.0%) |
| 5 to 9 Minutes | 176 (9.8%) | 279 (19.5%) |
| 10 to 14 Minutes | 98 (5.4%) | 115 (8.0%) |
| 15 to 19 Minutes | 250 (13.9%) | 95 (6.6%) |
| 20 to 24 Minutes | 266 (14.8%) | 118 (8.2%) |
| 25 to 29 Minutes | 119 (6.6%) | 88 (6.1%) |
| 30 to 34 Minutes | 358 (19.9%) | 221 (15.4%) |
| 35 to 39 Minutes | 76 (4.2%) | 162 (11.3%) |
| 40 to 44 Minutes | 84 (4.7%) | 28 (1.9%) |
| 45 to 59 Minutes | 300 (16.7%) | 147 (10.3%) |
| 60 to 89 Minutes | 42 (2.3%) | 0 (0.0%) |
| 90 or more Minutes | 0 (0.0%) | 79 (5.5%) |
Time of Departure to Work by Sex in Plattsmouth
The most frequent times of departure to work in Plattsmouth are 7:00 AM to 7:29 AM (392, 21.8%) for males and 7:00 AM to 7:29 AM (319, 22.3%) for females.
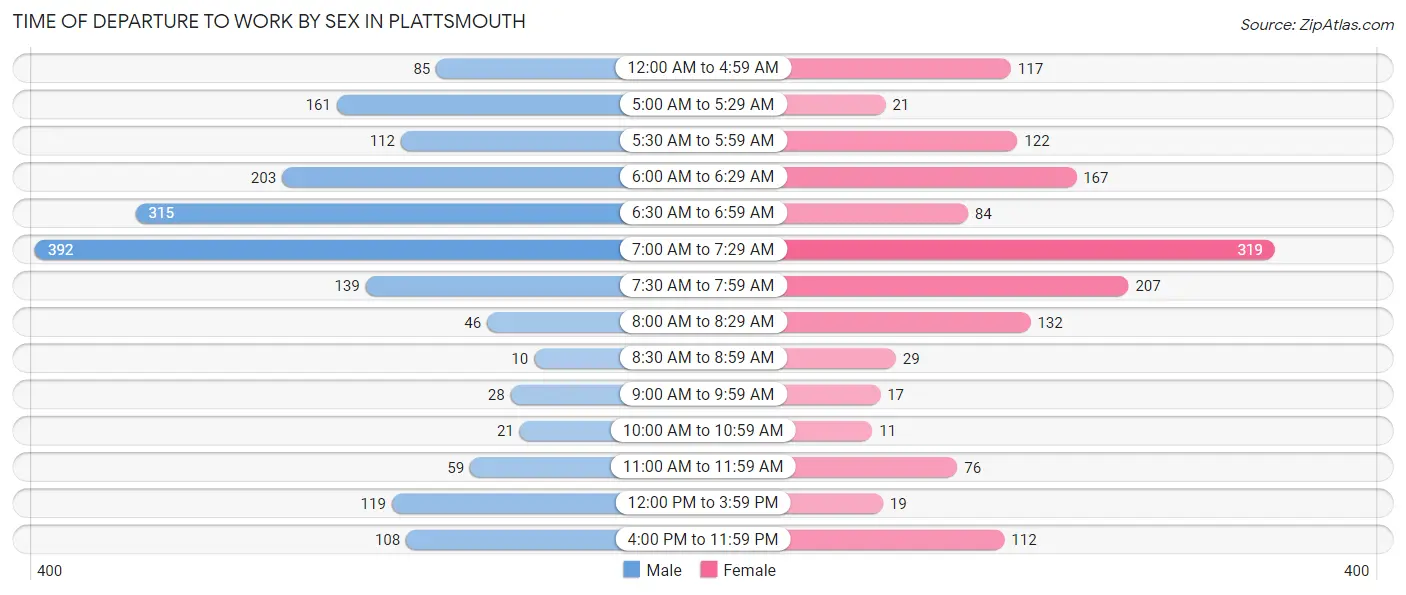
| Time of Departure | Male | Female |
| 12:00 AM to 4:59 AM | 85 (4.7%) | 117 (8.2%) |
| 5:00 AM to 5:29 AM | 161 (8.9%) | 21 (1.5%) |
| 5:30 AM to 5:59 AM | 112 (6.2%) | 122 (8.5%) |
| 6:00 AM to 6:29 AM | 203 (11.3%) | 167 (11.7%) |
| 6:30 AM to 6:59 AM | 315 (17.5%) | 84 (5.9%) |
| 7:00 AM to 7:29 AM | 392 (21.8%) | 319 (22.3%) |
| 7:30 AM to 7:59 AM | 139 (7.7%) | 207 (14.4%) |
| 8:00 AM to 8:29 AM | 46 (2.6%) | 132 (9.2%) |
| 8:30 AM to 8:59 AM | 10 (0.6%) | 29 (2.0%) |
| 9:00 AM to 9:59 AM | 28 (1.6%) | 17 (1.2%) |
| 10:00 AM to 10:59 AM | 21 (1.2%) | 11 (0.8%) |
| 11:00 AM to 11:59 AM | 59 (3.3%) | 76 (5.3%) |
| 12:00 PM to 3:59 PM | 119 (6.6%) | 19 (1.3%) |
| 4:00 PM to 11:59 PM | 108 (6.0%) | 112 (7.8%) |
| Total | 1,798 (100.0%) | 1,433 (100.0%) |
Housing Occupancy in Plattsmouth
Occupancy by Ownership in Plattsmouth
Of the total 2,873 dwellings in Plattsmouth, owner-occupied units account for 1,891 (65.8%), while renter-occupied units make up 982 (34.2%).
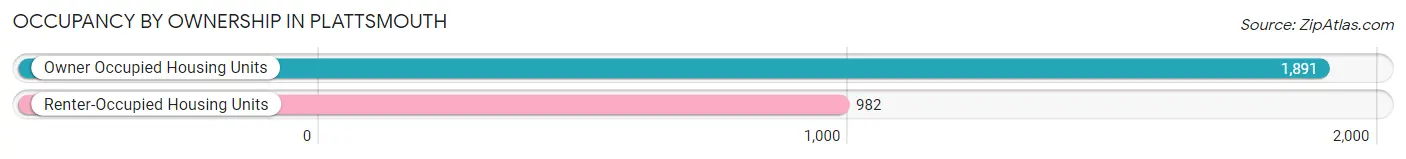
| Occupancy | # Housing Units | % Housing Units |
| Owner Occupied Housing Units | 1,891 | 65.8% |
| Renter-Occupied Housing Units | 982 | 34.2% |
| Total Occupied Housing Units | 2,873 | 100.0% |
Occupancy by Household Size in Plattsmouth
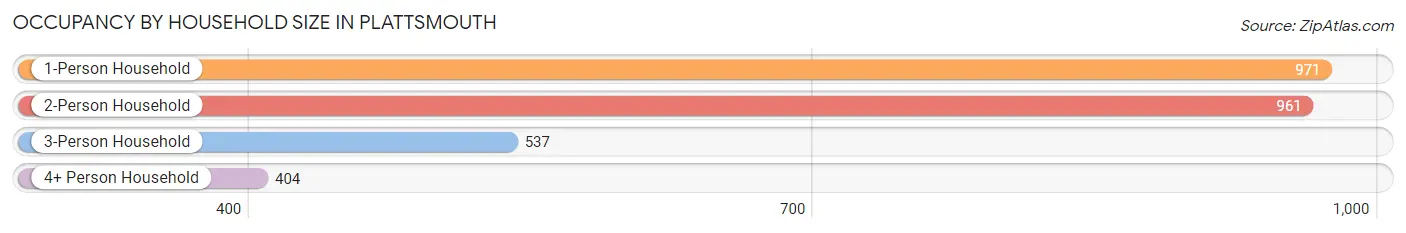
| Household Size | # Housing Units | % Housing Units |
| 1-Person Household | 971 | 33.8% |
| 2-Person Household | 961 | 33.5% |
| 3-Person Household | 537 | 18.7% |
| 4+ Person Household | 404 | 14.1% |
| Total Housing Units | 2,873 | 100.0% |
Occupancy by Ownership by Household Size in Plattsmouth
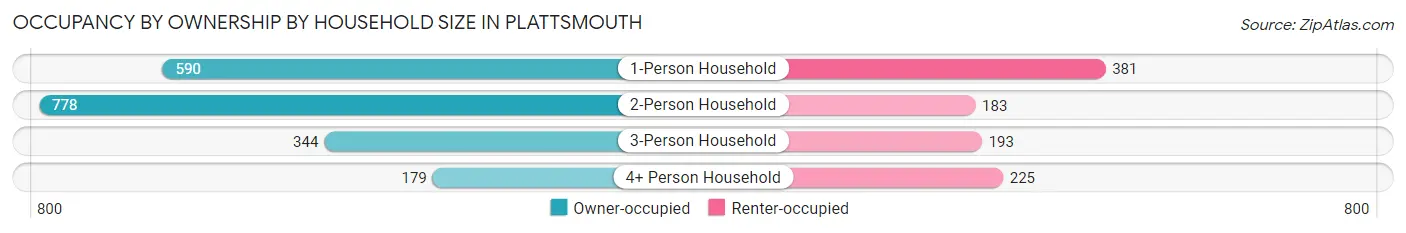
| Household Size | Owner-occupied | Renter-occupied |
| 1-Person Household | 590 (60.8%) | 381 (39.2%) |
| 2-Person Household | 778 (81.0%) | 183 (19.0%) |
| 3-Person Household | 344 (64.1%) | 193 (35.9%) |
| 4+ Person Household | 179 (44.3%) | 225 (55.7%) |
| Total Housing Units | 1,891 (65.8%) | 982 (34.2%) |
Occupancy by Educational Attainment in Plattsmouth
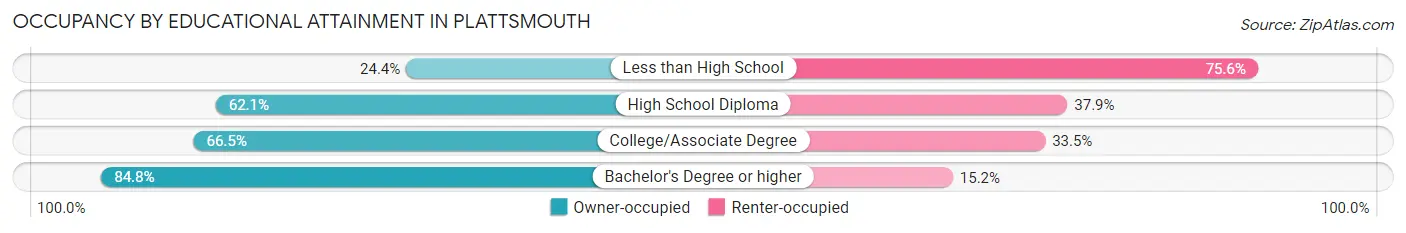
| Household Size | Owner-occupied | Renter-occupied |
| Less than High School | 38 (24.4%) | 118 (75.6%) |
| High School Diploma | 583 (62.1%) | 356 (37.9%) |
| College/Associate Degree | 863 (66.5%) | 435 (33.5%) |
| Bachelor's Degree or higher | 407 (84.8%) | 73 (15.2%) |
Occupancy by Age of Householder in Plattsmouth
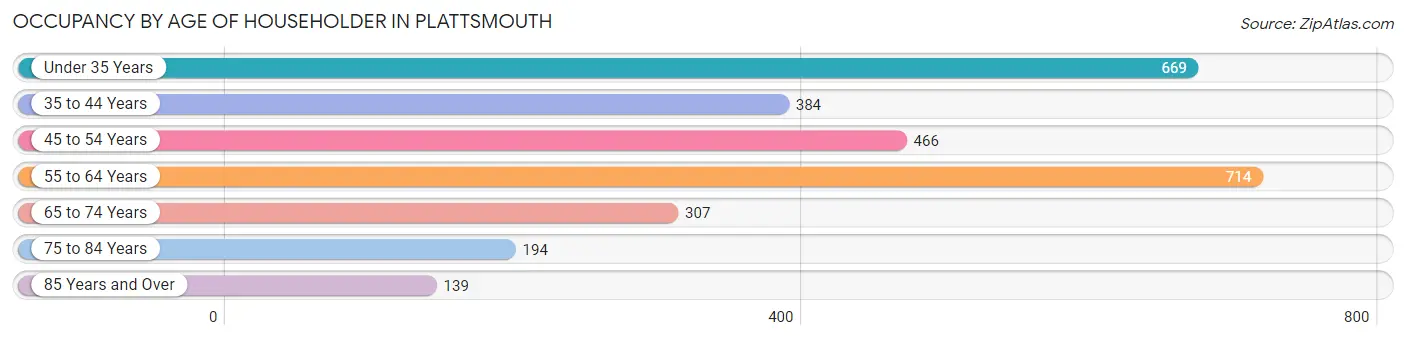
| Age Bracket | # Households | % Households |
| Under 35 Years | 669 | 23.3% |
| 35 to 44 Years | 384 | 13.4% |
| 45 to 54 Years | 466 | 16.2% |
| 55 to 64 Years | 714 | 24.8% |
| 65 to 74 Years | 307 | 10.7% |
| 75 to 84 Years | 194 | 6.8% |
| 85 Years and Over | 139 | 4.8% |
| Total | 2,873 | 100.0% |
Housing Finances in Plattsmouth
Median Income by Occupancy in Plattsmouth
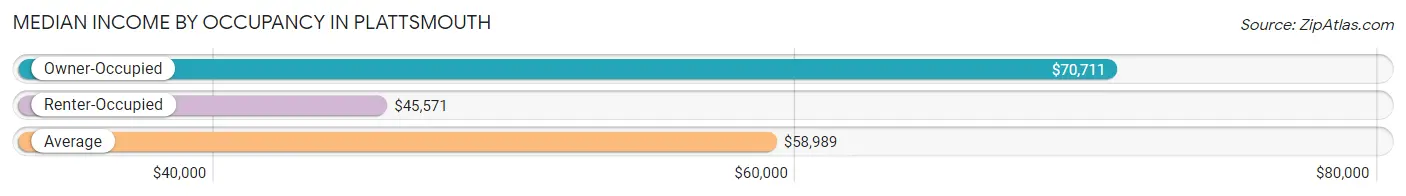
| Occupancy Type | # Households | Median Income |
| Owner-Occupied | 1,891 (65.8%) | $70,711 |
| Renter-Occupied | 982 (34.2%) | $45,571 |
| Average | 2,873 (100.0%) | $58,989 |
Occupancy by Householder Income Bracket in Plattsmouth
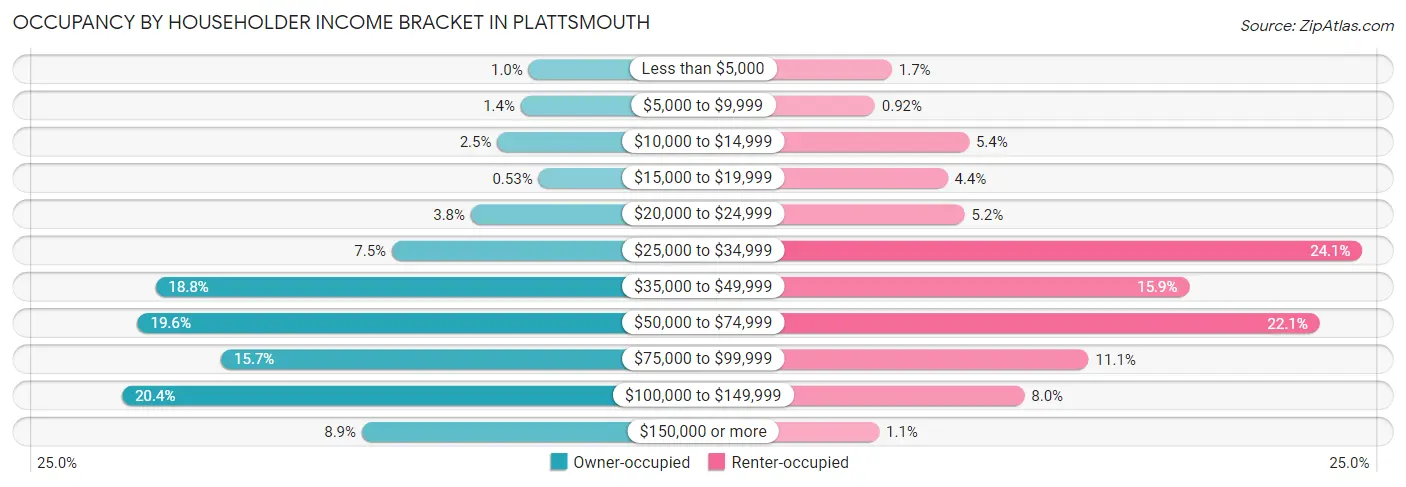
| Income Bracket | Owner-occupied | Renter-occupied |
| Less than $5,000 | 19 (1.0%) | 17 (1.7%) |
| $5,000 to $9,999 | 26 (1.4%) | 9 (0.9%) |
| $10,000 to $14,999 | 47 (2.5%) | 53 (5.4%) |
| $15,000 to $19,999 | 10 (0.5%) | 43 (4.4%) |
| $20,000 to $24,999 | 71 (3.7%) | 51 (5.2%) |
| $25,000 to $34,999 | 142 (7.5%) | 237 (24.1%) |
| $35,000 to $49,999 | 355 (18.8%) | 156 (15.9%) |
| $50,000 to $74,999 | 371 (19.6%) | 217 (22.1%) |
| $75,000 to $99,999 | 296 (15.7%) | 109 (11.1%) |
| $100,000 to $149,999 | 385 (20.4%) | 79 (8.0%) |
| $150,000 or more | 169 (8.9%) | 11 (1.1%) |
| Total | 1,891 (100.0%) | 982 (100.0%) |
Monthly Housing Cost Tiers in Plattsmouth
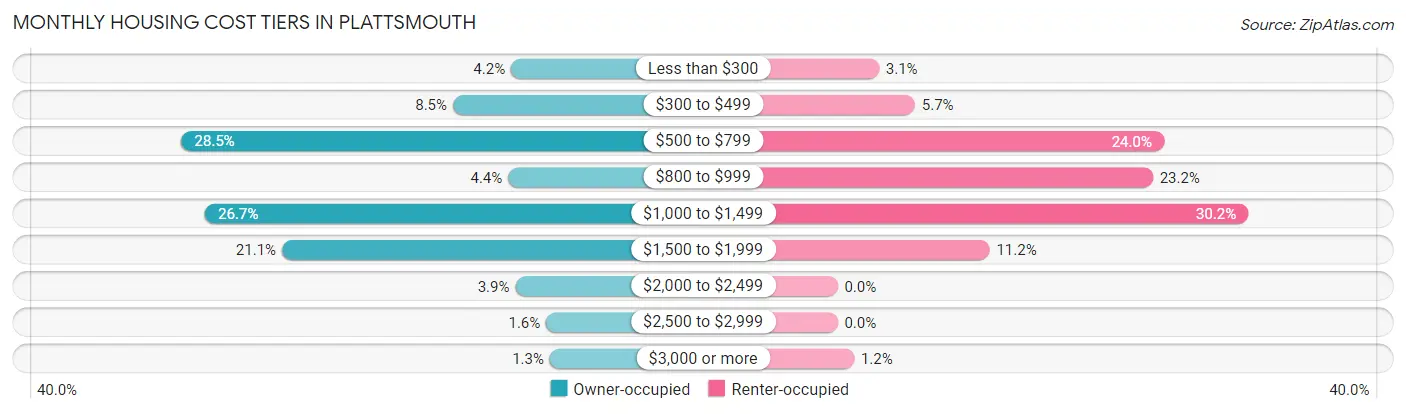
| Monthly Cost | Owner-occupied | Renter-occupied |
| Less than $300 | 79 (4.2%) | 30 (3.0%) |
| $300 to $499 | 160 (8.5%) | 56 (5.7%) |
| $500 to $799 | 538 (28.4%) | 236 (24.0%) |
| $800 to $999 | 83 (4.4%) | 228 (23.2%) |
| $1,000 to $1,499 | 505 (26.7%) | 297 (30.2%) |
| $1,500 to $1,999 | 398 (21.0%) | 110 (11.2%) |
| $2,000 to $2,499 | 73 (3.9%) | 0 (0.0%) |
| $2,500 to $2,999 | 30 (1.6%) | 0 (0.0%) |
| $3,000 or more | 25 (1.3%) | 12 (1.2%) |
| Total | 1,891 (100.0%) | 982 (100.0%) |
Physical Housing Characteristics in Plattsmouth
Housing Structures in Plattsmouth
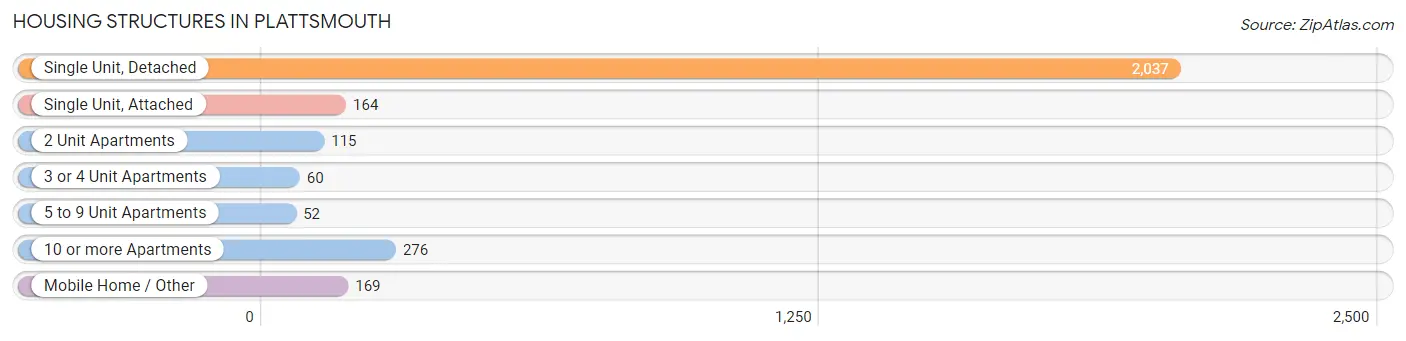
| Structure Type | # Housing Units | % Housing Units |
| Single Unit, Detached | 2,037 | 70.9% |
| Single Unit, Attached | 164 | 5.7% |
| 2 Unit Apartments | 115 | 4.0% |
| 3 or 4 Unit Apartments | 60 | 2.1% |
| 5 to 9 Unit Apartments | 52 | 1.8% |
| 10 or more Apartments | 276 | 9.6% |
| Mobile Home / Other | 169 | 5.9% |
| Total | 2,873 | 100.0% |
Housing Structures by Occupancy in Plattsmouth
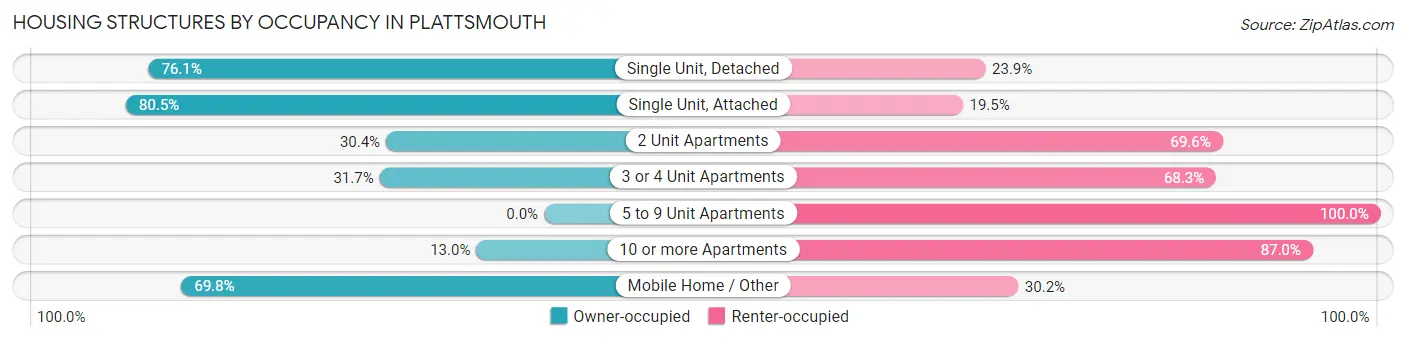
| Structure Type | Owner-occupied | Renter-occupied |
| Single Unit, Detached | 1,551 (76.1%) | 486 (23.9%) |
| Single Unit, Attached | 132 (80.5%) | 32 (19.5%) |
| 2 Unit Apartments | 35 (30.4%) | 80 (69.6%) |
| 3 or 4 Unit Apartments | 19 (31.7%) | 41 (68.3%) |
| 5 to 9 Unit Apartments | 0 (0.0%) | 52 (100.0%) |
| 10 or more Apartments | 36 (13.0%) | 240 (87.0%) |
| Mobile Home / Other | 118 (69.8%) | 51 (30.2%) |
| Total | 1,891 (65.8%) | 982 (34.2%) |
Housing Structures by Number of Rooms in Plattsmouth
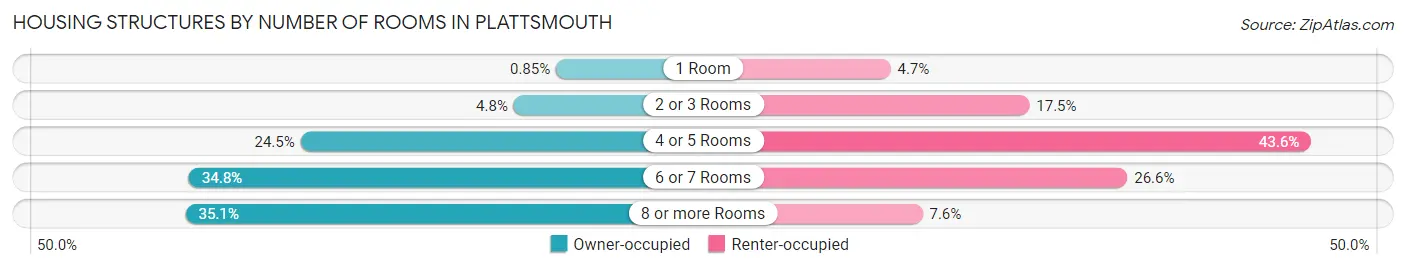
| Number of Rooms | Owner-occupied | Renter-occupied |
| 1 Room | 16 (0.9%) | 46 (4.7%) |
| 2 or 3 Rooms | 90 (4.8%) | 172 (17.5%) |
| 4 or 5 Rooms | 463 (24.5%) | 428 (43.6%) |
| 6 or 7 Rooms | 658 (34.8%) | 261 (26.6%) |
| 8 or more Rooms | 664 (35.1%) | 75 (7.6%) |
| Total | 1,891 (100.0%) | 982 (100.0%) |
Housing Structure by Heating Type in Plattsmouth
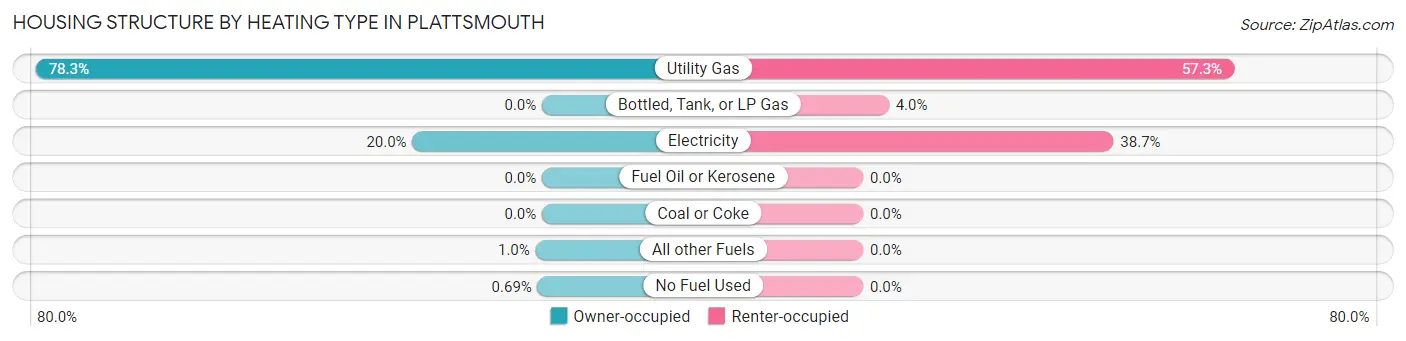
| Heating Type | Owner-occupied | Renter-occupied |
| Utility Gas | 1,480 (78.3%) | 563 (57.3%) |
| Bottled, Tank, or LP Gas | 0 (0.0%) | 39 (4.0%) |
| Electricity | 379 (20.0%) | 380 (38.7%) |
| Fuel Oil or Kerosene | 0 (0.0%) | 0 (0.0%) |
| Coal or Coke | 0 (0.0%) | 0 (0.0%) |
| All other Fuels | 19 (1.0%) | 0 (0.0%) |
| No Fuel Used | 13 (0.7%) | 0 (0.0%) |
| Total | 1,891 (100.0%) | 982 (100.0%) |
Household Vehicle Usage in Plattsmouth
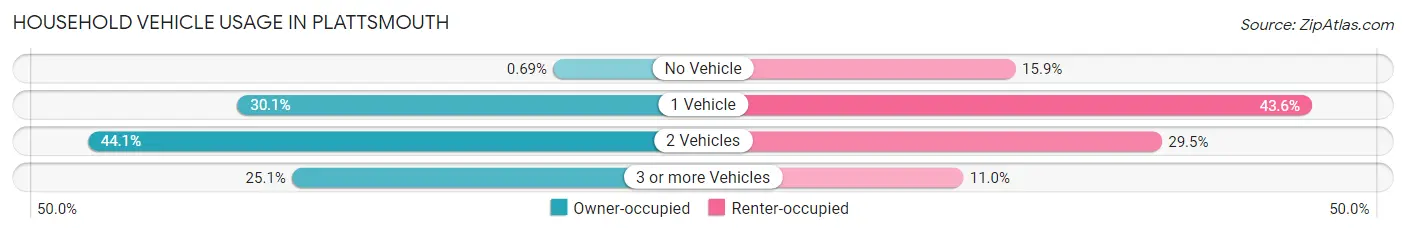
| Vehicles per Household | Owner-occupied | Renter-occupied |
| No Vehicle | 13 (0.7%) | 156 (15.9%) |
| 1 Vehicle | 570 (30.1%) | 428 (43.6%) |
| 2 Vehicles | 834 (44.1%) | 290 (29.5%) |
| 3 or more Vehicles | 474 (25.1%) | 108 (11.0%) |
| Total | 1,891 (100.0%) | 982 (100.0%) |
Real Estate & Mortgages in Plattsmouth
Real Estate and Mortgage Overview in Plattsmouth
| Characteristic | Without Mortgage | With Mortgage |
| Housing Units | 773 | 1,118 |
| Median Property Value | $135,300 | $175,000 |
| Median Household Income | $48,809 | $140 |
| Monthly Housing Costs | $589 | $25 |
| Real Estate Taxes | $2,560 | $22 |
Property Value by Mortgage Status in Plattsmouth
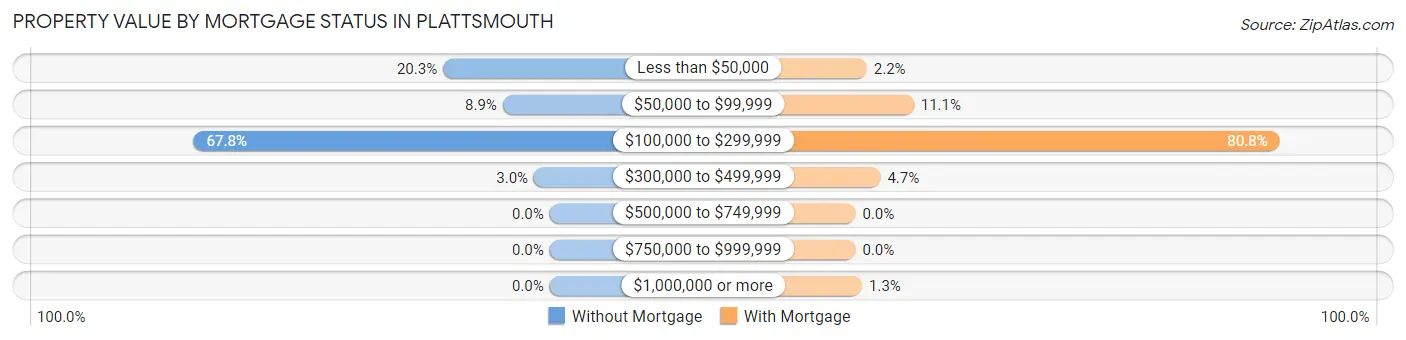
| Property Value | Without Mortgage | With Mortgage |
| Less than $50,000 | 157 (20.3%) | 24 (2.1%) |
| $50,000 to $99,999 | 69 (8.9%) | 124 (11.1%) |
| $100,000 to $299,999 | 524 (67.8%) | 903 (80.8%) |
| $300,000 to $499,999 | 23 (3.0%) | 53 (4.7%) |
| $500,000 to $749,999 | 0 (0.0%) | 0 (0.0%) |
| $750,000 to $999,999 | 0 (0.0%) | 0 (0.0%) |
| $1,000,000 or more | 0 (0.0%) | 14 (1.3%) |
| Total | 773 (100.0%) | 1,118 (100.0%) |
Household Income by Mortgage Status in Plattsmouth
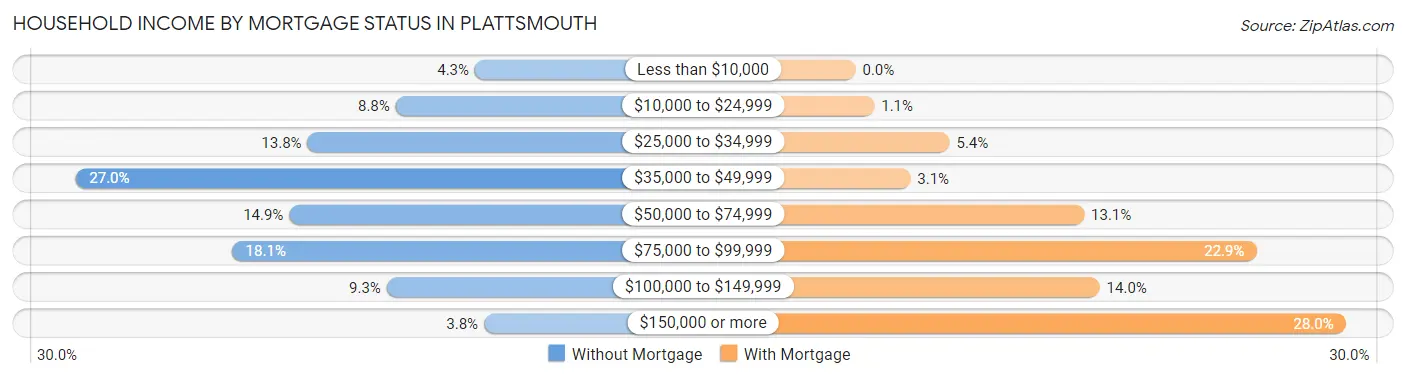
| Household Income | Without Mortgage | With Mortgage |
| Less than $10,000 | 33 (4.3%) | 0 (0.0%) |
| $10,000 to $24,999 | 68 (8.8%) | 12 (1.1%) |
| $25,000 to $34,999 | 107 (13.8%) | 60 (5.4%) |
| $35,000 to $49,999 | 209 (27.0%) | 35 (3.1%) |
| $50,000 to $74,999 | 115 (14.9%) | 146 (13.1%) |
| $75,000 to $99,999 | 140 (18.1%) | 256 (22.9%) |
| $100,000 to $149,999 | 72 (9.3%) | 156 (14.0%) |
| $150,000 or more | 29 (3.7%) | 313 (28.0%) |
| Total | 773 (100.0%) | 1,118 (100.0%) |
Property Value to Household Income Ratio in Plattsmouth
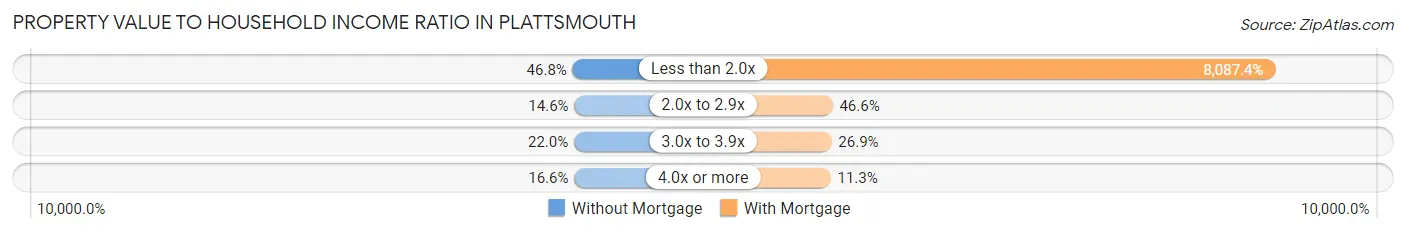
| Value-to-Income Ratio | Without Mortgage | With Mortgage |
| Less than 2.0x | 362 (46.8%) | 90,417 (8,087.4%) |
| 2.0x to 2.9x | 113 (14.6%) | 521 (46.6%) |
| 3.0x to 3.9x | 170 (22.0%) | 301 (26.9%) |
| 4.0x or more | 128 (16.6%) | 126 (11.3%) |
| Total | 773 (100.0%) | 1,118 (100.0%) |
Real Estate Taxes by Mortgage Status in Plattsmouth
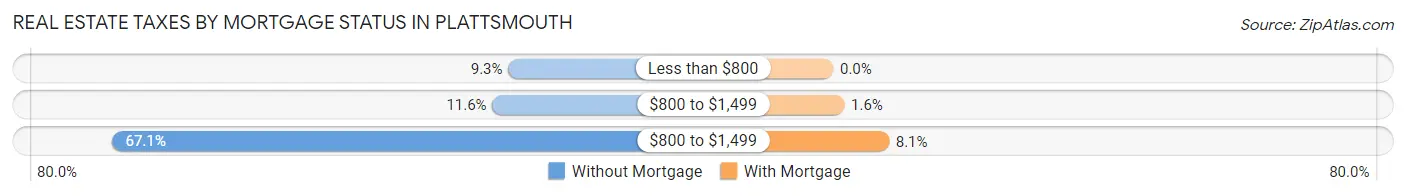
| Property Taxes | Without Mortgage | With Mortgage |
| Less than $800 | 72 (9.3%) | 0 (0.0%) |
| $800 to $1,499 | 90 (11.6%) | 18 (1.6%) |
| $800 to $1,499 | 519 (67.1%) | 91 (8.1%) |
| Total | 773 (100.0%) | 1,118 (100.0%) |
Health & Disability in Plattsmouth
Health Insurance Coverage by Age in Plattsmouth
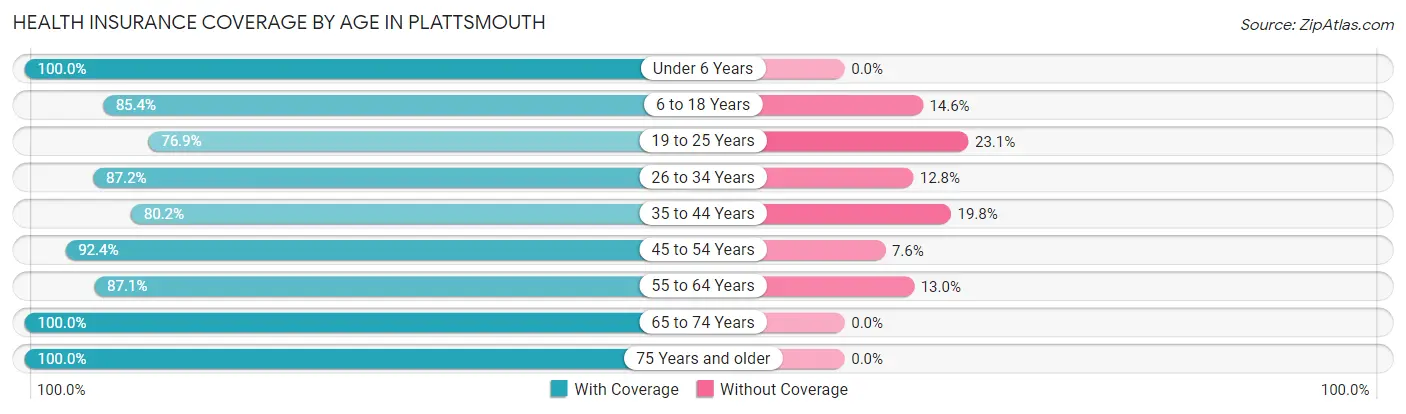
| Age Bracket | With Coverage | Without Coverage |
| Under 6 Years | 583 (100.0%) | 0 (0.0%) |
| 6 to 18 Years | 727 (85.4%) | 124 (14.6%) |
| 19 to 25 Years | 460 (76.9%) | 138 (23.1%) |
| 26 to 34 Years | 743 (87.2%) | 109 (12.8%) |
| 35 to 44 Years | 579 (80.2%) | 143 (19.8%) |
| 45 to 54 Years | 793 (92.4%) | 65 (7.6%) |
| 55 to 64 Years | 854 (87.1%) | 127 (13.0%) |
| 65 to 74 Years | 515 (100.0%) | 0 (0.0%) |
| 75 Years and older | 413 (100.0%) | 0 (0.0%) |
| Total | 5,667 (88.9%) | 706 (11.1%) |
Health Insurance Coverage by Citizenship Status in Plattsmouth
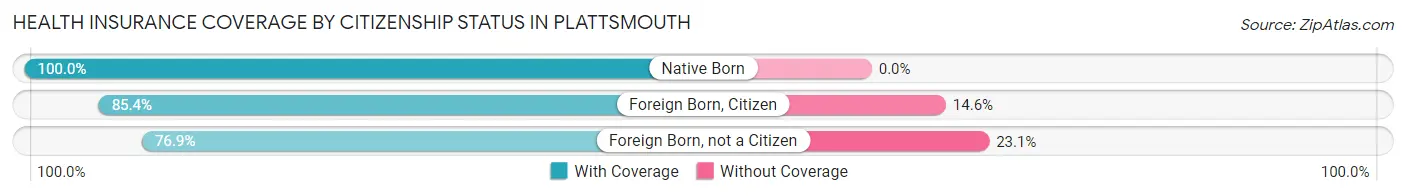
| Citizenship Status | With Coverage | Without Coverage |
| Native Born | 583 (100.0%) | 0 (0.0%) |
| Foreign Born, Citizen | 727 (85.4%) | 124 (14.6%) |
| Foreign Born, not a Citizen | 460 (76.9%) | 138 (23.1%) |
Health Insurance Coverage by Household Income in Plattsmouth
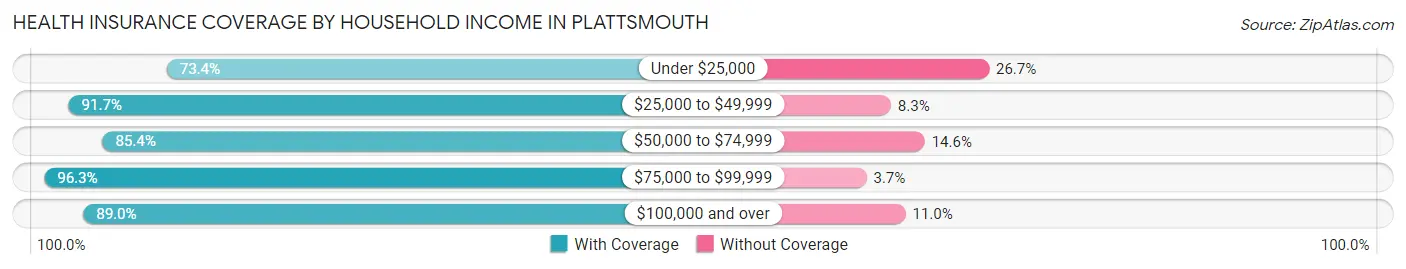
| Household Income | With Coverage | Without Coverage |
| Under $25,000 | 333 (73.4%) | 121 (26.7%) |
| $25,000 to $49,999 | 1,566 (91.7%) | 141 (8.3%) |
| $50,000 to $74,999 | 1,240 (85.4%) | 212 (14.6%) |
| $75,000 to $99,999 | 937 (96.3%) | 36 (3.7%) |
| $100,000 and over | 1,586 (89.0%) | 196 (11.0%) |
Public vs Private Health Insurance Coverage by Age in Plattsmouth
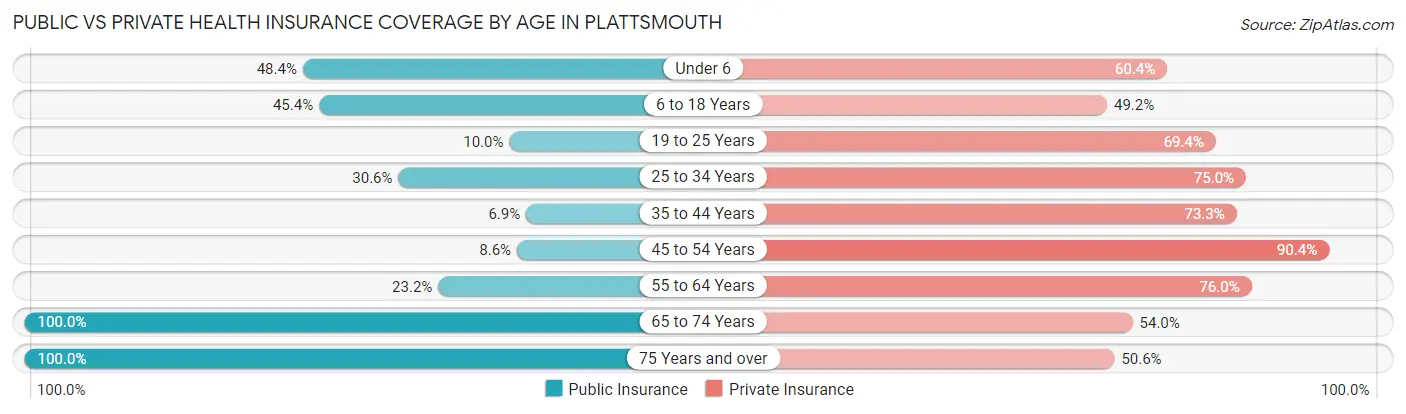
| Age Bracket | Public Insurance | Private Insurance |
| Under 6 | 282 (48.4%) | 352 (60.4%) |
| 6 to 18 Years | 386 (45.4%) | 419 (49.2%) |
| 19 to 25 Years | 60 (10.0%) | 415 (69.4%) |
| 25 to 34 Years | 261 (30.6%) | 639 (75.0%) |
| 35 to 44 Years | 50 (6.9%) | 529 (73.3%) |
| 45 to 54 Years | 74 (8.6%) | 776 (90.4%) |
| 55 to 64 Years | 228 (23.2%) | 746 (76.0%) |
| 65 to 74 Years | 515 (100.0%) | 278 (54.0%) |
| 75 Years and over | 413 (100.0%) | 209 (50.6%) |
| Total | 2,269 (35.6%) | 4,363 (68.5%) |
Disability Status by Sex by Age in Plattsmouth
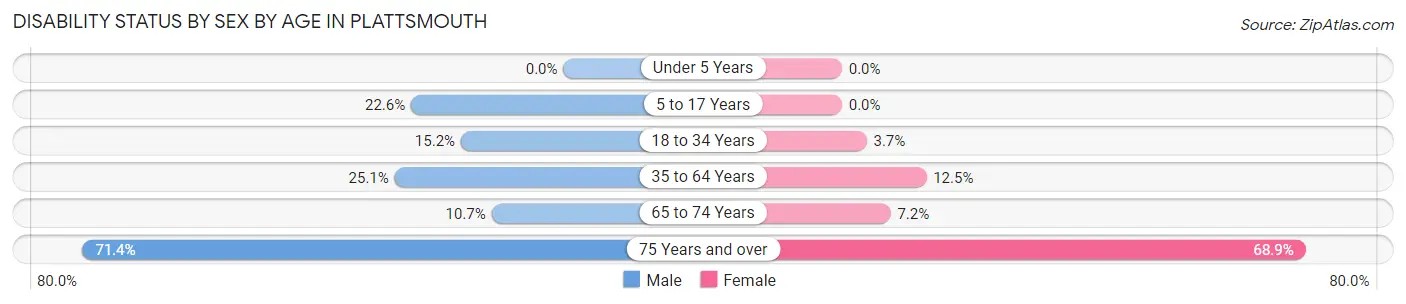
| Age Bracket | Male | Female |
| Under 5 Years | 0 (0.0%) | 0 (0.0%) |
| 5 to 17 Years | 107 (22.6%) | 0 (0.0%) |
| 18 to 34 Years | 127 (15.2%) | 26 (3.7%) |
| 35 to 64 Years | 318 (25.1%) | 162 (12.5%) |
| 65 to 74 Years | 21 (10.7%) | 23 (7.2%) |
| 75 Years and over | 100 (71.4%) | 188 (68.9%) |
Disability Class by Sex by Age in Plattsmouth
Disability Class: Hearing Difficulty
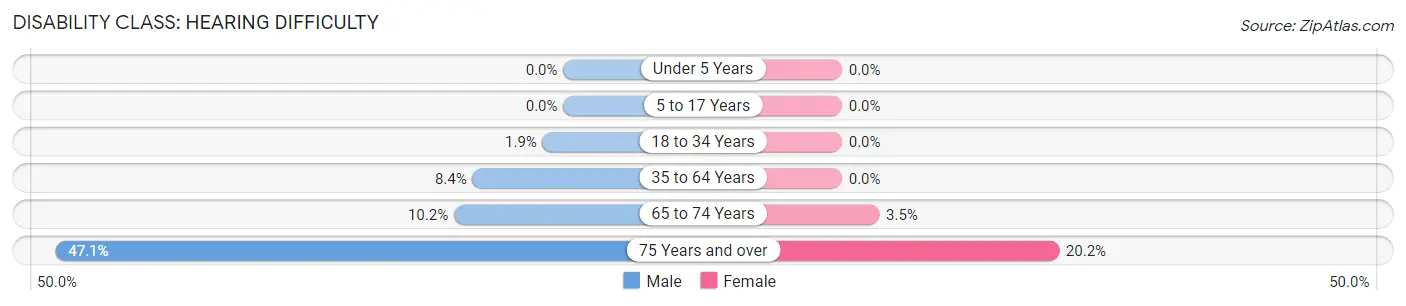
| Age Bracket | Male | Female |
| Under 5 Years | 0 (0.0%) | 0 (0.0%) |
| 5 to 17 Years | 0 (0.0%) | 0 (0.0%) |
| 18 to 34 Years | 16 (1.9%) | 0 (0.0%) |
| 35 to 64 Years | 107 (8.4%) | 0 (0.0%) |
| 65 to 74 Years | 20 (10.2%) | 11 (3.5%) |
| 75 Years and over | 66 (47.1%) | 55 (20.2%) |
Disability Class: Vision Difficulty
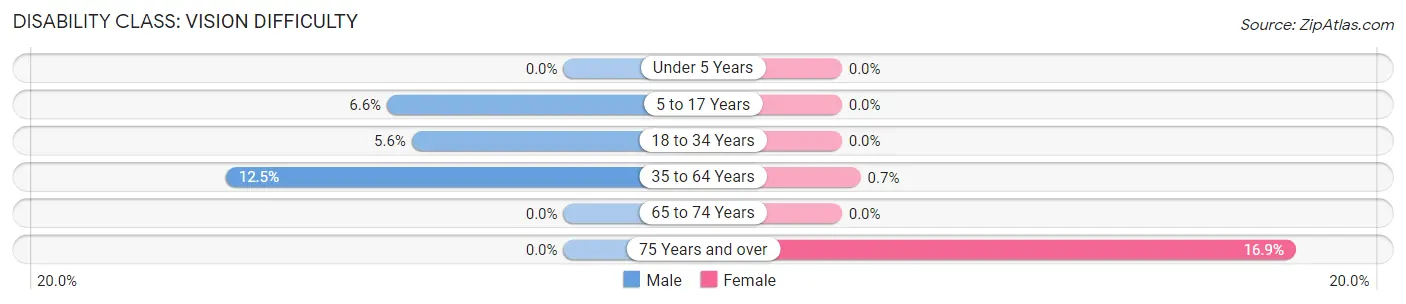
| Age Bracket | Male | Female |
| Under 5 Years | 0 (0.0%) | 0 (0.0%) |
| 5 to 17 Years | 31 (6.6%) | 0 (0.0%) |
| 18 to 34 Years | 47 (5.6%) | 0 (0.0%) |
| 35 to 64 Years | 159 (12.5%) | 9 (0.7%) |
| 65 to 74 Years | 0 (0.0%) | 0 (0.0%) |
| 75 Years and over | 0 (0.0%) | 46 (16.9%) |
Disability Class: Cognitive Difficulty
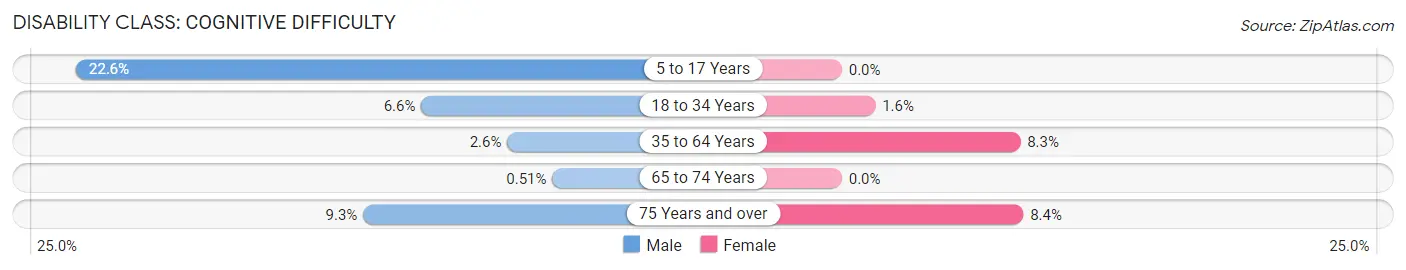
| Age Bracket | Male | Female |
| 5 to 17 Years | 107 (22.6%) | 0 (0.0%) |
| 18 to 34 Years | 55 (6.6%) | 11 (1.5%) |
| 35 to 64 Years | 33 (2.6%) | 107 (8.3%) |
| 65 to 74 Years | 1 (0.5%) | 0 (0.0%) |
| 75 Years and over | 13 (9.3%) | 23 (8.4%) |
Disability Class: Ambulatory Difficulty
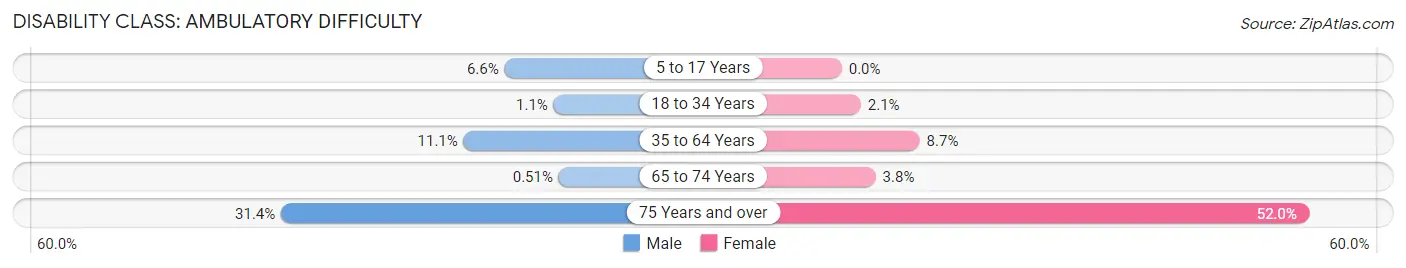
| Age Bracket | Male | Female |
| 5 to 17 Years | 31 (6.6%) | 0 (0.0%) |
| 18 to 34 Years | 9 (1.1%) | 15 (2.1%) |
| 35 to 64 Years | 141 (11.1%) | 112 (8.7%) |
| 65 to 74 Years | 1 (0.5%) | 12 (3.8%) |
| 75 Years and over | 44 (31.4%) | 142 (52.0%) |
Disability Class: Self-Care Difficulty
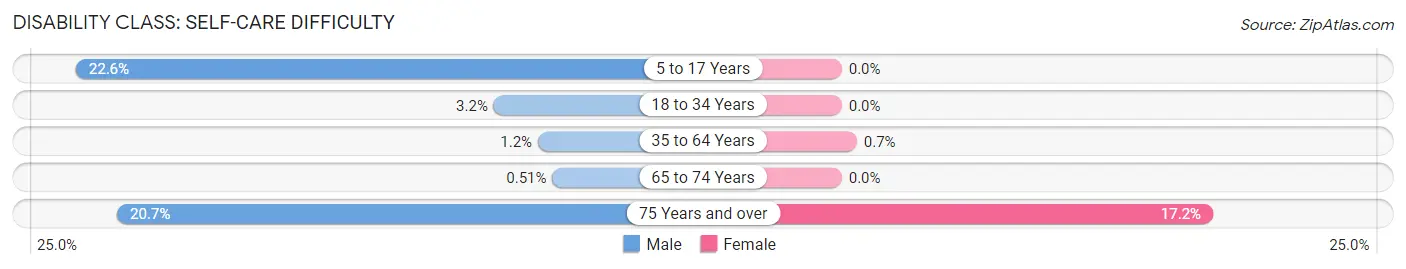
| Age Bracket | Male | Female |
| 5 to 17 Years | 107 (22.6%) | 0 (0.0%) |
| 18 to 34 Years | 27 (3.2%) | 0 (0.0%) |
| 35 to 64 Years | 15 (1.2%) | 9 (0.7%) |
| 65 to 74 Years | 1 (0.5%) | 0 (0.0%) |
| 75 Years and over | 29 (20.7%) | 47 (17.2%) |
Technology Access in Plattsmouth
Computing Device Access in Plattsmouth
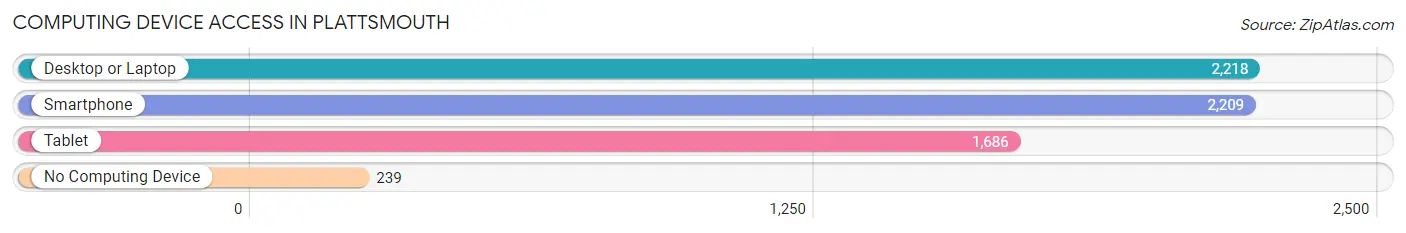
| Device Type | # Households | % Households |
| Desktop or Laptop | 2,218 | 77.2% |
| Smartphone | 2,209 | 76.9% |
| Tablet | 1,686 | 58.7% |
| No Computing Device | 239 | 8.3% |
| Total | 2,873 | 100.0% |
Internet Access in Plattsmouth
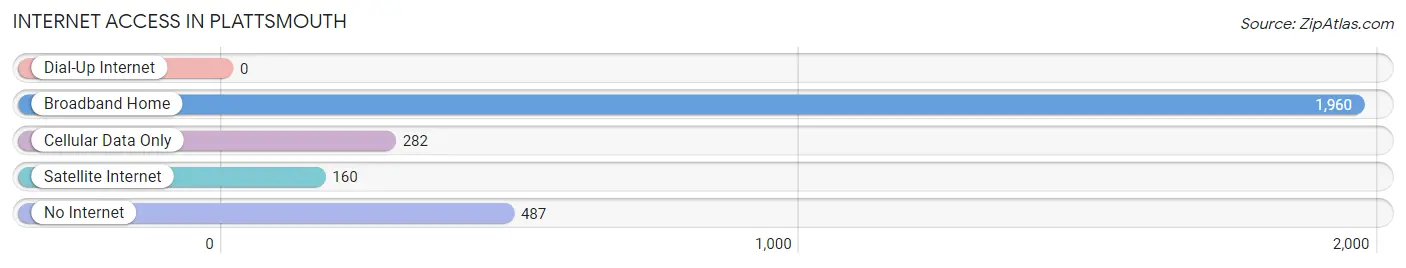
| Internet Type | # Households | % Households |
| Dial-Up Internet | 0 | 0.0% |
| Broadband Home | 1,960 | 68.2% |
| Cellular Data Only | 282 | 9.8% |
| Satellite Internet | 160 | 5.6% |
| No Internet | 487 | 17.0% |
| Total | 2,873 | 100.0% |
Plattsmouth Summary
Plattsmouth, Nebraska is a small city located in Cass County, Nebraska, United States. It is situated on the Platte River, approximately 25 miles south of Omaha. The city has a population of 6,719 as of the 2010 census.
History
Plattsmouth was founded in 1855 by a group of settlers from Ohio. The city was named after the nearby Platte River, which was named after the French explorer Pierre-Charles Le Sueur. The city was incorporated in 1857 and was the first city in Cass County.
In the late 19th century, Plattsmouth was a major shipping point for goods traveling up and down the Platte River. The city was also home to a number of industries, including a flour mill, a sawmill, a brickyard, and a brewery.
Geography
Plattsmouth is located in southeastern Nebraska, approximately 25 miles south of Omaha. The city is situated on the Platte River, which is a major tributary of the Missouri River. The city has a total area of 4.2 square miles, all of which is land.
The city has a humid continental climate, with hot summers and cold winters. The average annual temperature is 50.2°F, with an average high of 68.2°F in July and an average low of 32.2°F in January. The average annual precipitation is 33.2 inches.
Economy
Plattsmouth’s economy is largely based on agriculture and manufacturing. The city is home to a number of manufacturing companies, including a plastics manufacturer, a metal fabricator, and a food processor. The city is also home to a number of agricultural businesses, including a dairy farm, a feed mill, and a grain elevator.
The city is also home to a number of retail businesses, including a grocery store, a hardware store, and a number of restaurants. The city is also home to a number of service businesses, including a bank, a post office, and a number of medical offices.
Demographics
As of the 2010 census, Plattsmouth had a population of 6,719. The racial makeup of the city was 95.2% White, 0.7% African American, 0.3% Native American, 0.7% Asian, 0.1% Pacific Islander, 1.2% from other races, and 1.8% from two or more races. Hispanic or Latino of any race were 3.2% of the population.
The median income for a household in the city was $45,938, and the median income for a family was $54,938. The per capita income for the city was $20,938. About 8.2% of families and 10.2% of the population were below the poverty line, including 14.2% of those under age 18 and 6.2% of those age 65 or over.
Common Questions
What is Per Capita Income in Plattsmouth?
Per Capita income in Plattsmouth is $33,181.
What is the Median Family Income in Plattsmouth?
Median Family Income in Plattsmouth is $67,188.
What is the Median Household income in Plattsmouth?
Median Household Income in Plattsmouth is $58,989.
What is Income or Wage Gap in Plattsmouth?
Income or Wage Gap in Plattsmouth is 26.2%.
Women in Plattsmouth earn 73.8 cents for every dollar earned by a man.
What is Inequality or Gini Index in Plattsmouth?
Inequality or Gini Index in Plattsmouth is 0.38.
What is the Total Population of Plattsmouth?
Total Population of Plattsmouth is 6,585.
What is the Total Male Population of Plattsmouth?
Total Male Population of Plattsmouth is 3,288.
What is the Total Female Population of Plattsmouth?
Total Female Population of Plattsmouth is 3,297.
What is the Ratio of Males per 100 Females in Plattsmouth?
There are 99.73 Males per 100 Females in Plattsmouth.
What is the Ratio of Females per 100 Males in Plattsmouth?
There are 100.27 Females per 100 Males in Plattsmouth.
What is the Median Population Age in Plattsmouth?
Median Population Age in Plattsmouth is 37.2 Years.
What is the Average Family Size in Plattsmouth
Average Family Size in Plattsmouth is 2.8 People.
What is the Average Household Size in Plattsmouth
Average Household Size in Plattsmouth is 2.2 People.
How Large is the Labor Force in Plattsmouth?
There are 3,510 People in the Labor Forcein in Plattsmouth.
What is the Percentage of People in the Labor Force in Plattsmouth?
65.9% of People are in the Labor Force in Plattsmouth.
What is the Unemployment Rate in Plattsmouth?
Unemployment Rate in Plattsmouth is 0.7%.