Santee, NE Map & Demographics
Santee Map
Santee Overview
$13,870
PER CAPITA INCOME
$31,250
AVG FAMILY INCOME
$38,333
AVG HOUSEHOLD INCOME
1.0%
WAGE / INCOME GAP [ % ]
99.0¢/ $1
WAGE / INCOME GAP [ $ ]
$15,063
FAMILY INCOME DEFICIT
0.45
INEQUALITY / GINI INDEX
262
TOTAL POPULATION
136
MALE POPULATION
126
FEMALE POPULATION
107.94
MALES / 100 FEMALES
92.65
FEMALES / 100 MALES
20.9
MEDIAN AGE
4.0
AVG FAMILY SIZE
3.5
AVG HOUSEHOLD SIZE
101
LABOR FORCE [ PEOPLE ]
64.3%
PERCENT IN LABOR FORCE
23.8%
UNEMPLOYMENT RATE
Income in Santee
Income Overview in Santee
Per Capita Income in Santee is $13,870, while median incomes of families and households are $31,250 and $38,333 respectively.
| Characteristic | Number | Measure |
| Per Capita Income | 262 | $13,870 |
| Median Family Income | 55 | $31,250 |
| Mean Family Income | 55 | $43,200 |
| Median Household Income | 74 | $38,333 |
| Mean Household Income | 74 | $45,954 |
| Income Deficit | 55 | $15,063 |
| Wage / Income Gap (%) | 262 | 0.99% |
| Wage / Income Gap ($) | 262 | 99.01¢ per $1 |
| Gini / Inequality Index | 262 | 0.45 |
Earnings by Sex in Santee
Average Earnings in Santee are $32,885, $33,036 for men and $32,708 for women, a difference of 1.0%.
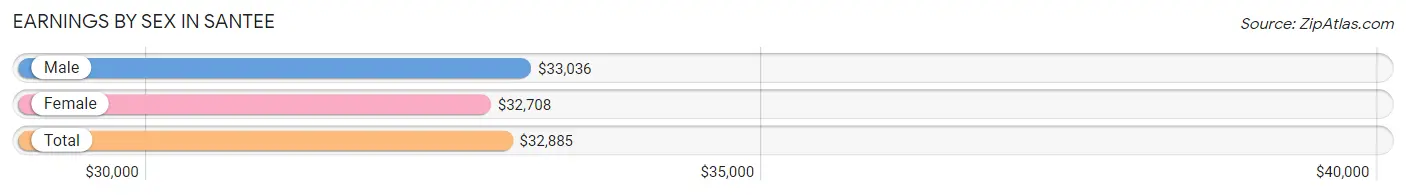
| Sex | Number | Average Earnings |
| Male | 43 (48.9%) | $33,036 |
| Female | 45 (51.1%) | $32,708 |
| Total | 88 (100.0%) | $32,885 |
Earnings by Sex by Income Bracket in Santee
The most common earnings brackets in Santee are $30,000 to $34,999 for men (9 | 20.9%) and $30,000 to $34,999 for women (7 | 15.6%).
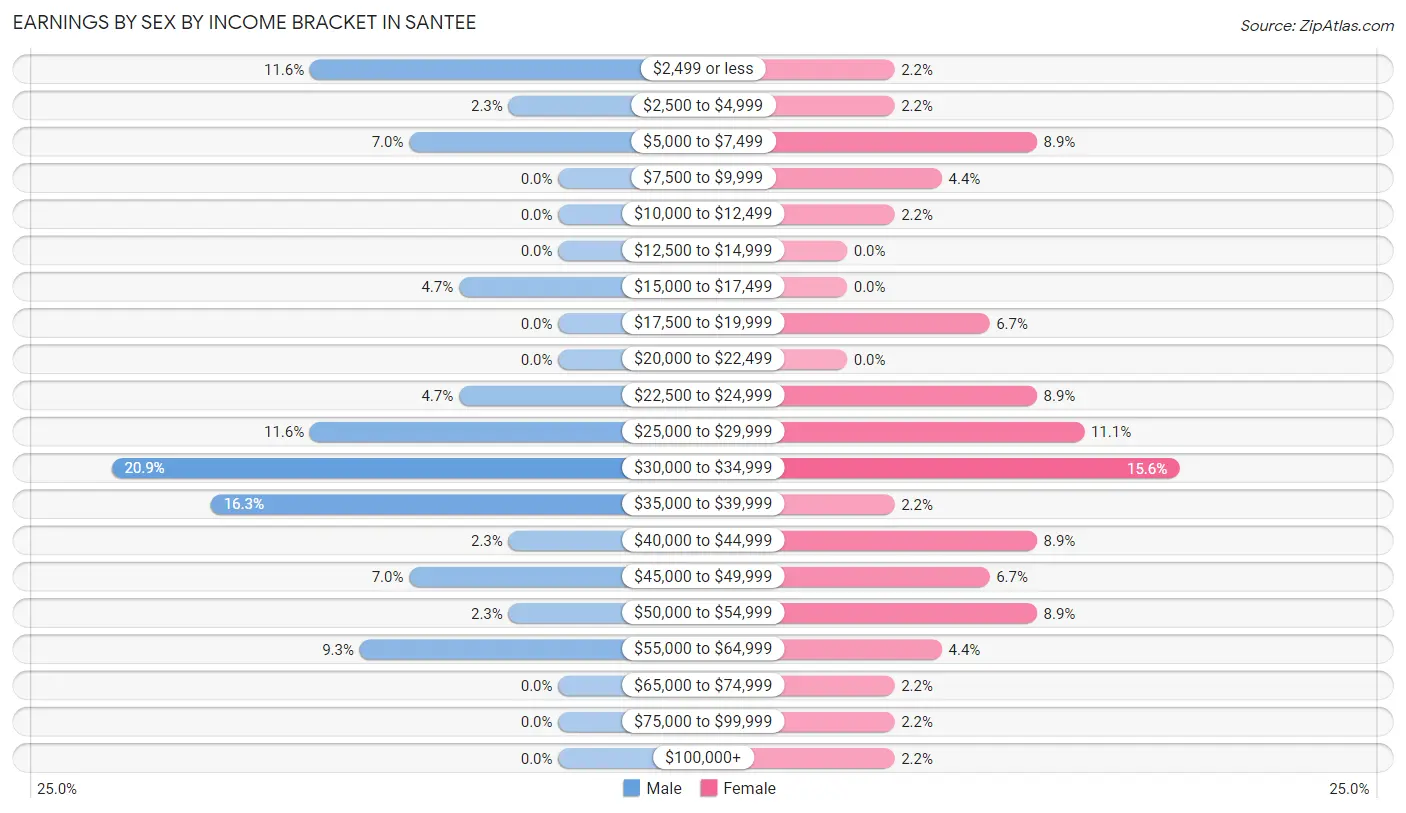
| Income | Male | Female |
| $2,499 or less | 5 (11.6%) | 1 (2.2%) |
| $2,500 to $4,999 | 1 (2.3%) | 1 (2.2%) |
| $5,000 to $7,499 | 3 (7.0%) | 4 (8.9%) |
| $7,500 to $9,999 | 0 (0.0%) | 2 (4.4%) |
| $10,000 to $12,499 | 0 (0.0%) | 1 (2.2%) |
| $12,500 to $14,999 | 0 (0.0%) | 0 (0.0%) |
| $15,000 to $17,499 | 2 (4.6%) | 0 (0.0%) |
| $17,500 to $19,999 | 0 (0.0%) | 3 (6.7%) |
| $20,000 to $22,499 | 0 (0.0%) | 0 (0.0%) |
| $22,500 to $24,999 | 2 (4.6%) | 4 (8.9%) |
| $25,000 to $29,999 | 5 (11.6%) | 5 (11.1%) |
| $30,000 to $34,999 | 9 (20.9%) | 7 (15.6%) |
| $35,000 to $39,999 | 7 (16.3%) | 1 (2.2%) |
| $40,000 to $44,999 | 1 (2.3%) | 4 (8.9%) |
| $45,000 to $49,999 | 3 (7.0%) | 3 (6.7%) |
| $50,000 to $54,999 | 1 (2.3%) | 4 (8.9%) |
| $55,000 to $64,999 | 4 (9.3%) | 2 (4.4%) |
| $65,000 to $74,999 | 0 (0.0%) | 1 (2.2%) |
| $75,000 to $99,999 | 0 (0.0%) | 1 (2.2%) |
| $100,000+ | 0 (0.0%) | 1 (2.2%) |
| Total | 43 (100.0%) | 45 (100.0%) |
Earnings by Sex by Educational Attainment in Santee
Average earnings in Santee are $34,375 for men and $33,333 for women, a difference of 3.0%. Men with an educational attainment of college or associate's degree enjoy the highest average annual earnings of $33,750, while those with high school diploma education earn the least with $25,000. Women with an educational attainment of bachelor's degree earn the most with the average annual earnings of $51,250, while those with high school diploma education have the smallest earnings of $27,917.
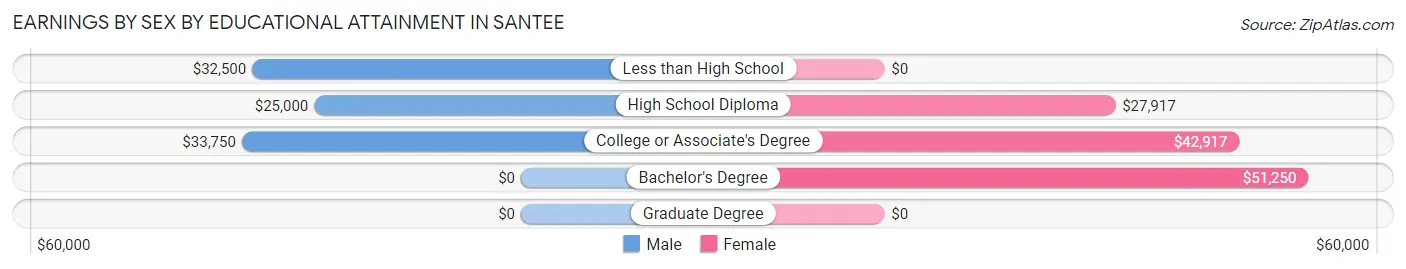
| Educational Attainment | Male Income | Female Income |
| Less than High School | $32,500 | $0 |
| High School Diploma | $25,000 | $27,917 |
| College or Associate's Degree | $33,750 | $42,917 |
| Bachelor's Degree | - | - |
| Graduate Degree | - | - |
| Total | $34,375 | $33,333 |
Family Income in Santee
Family Income Brackets in Santee
According to the Santee family income data, there are 11 families falling into the $35,000 to $49,999 income range, which is the most common income bracket and makes up 20.0% of all families. Conversely, the $100,000 to $149,999 income bracket is the least frequent group with only 1 families (1.8%) belonging to this category.
| Income Bracket | # Families | % Families |
| Less than $10,000 | 9 | 16.4% |
| $10,000 to $14,999 | 5 | 9.1% |
| $15,000 to $24,999 | 7 | 12.7% |
| $25,000 to $34,999 | 8 | 14.5% |
| $35,000 to $49,999 | 11 | 20.0% |
| $50,000 to $74,999 | 8 | 14.5% |
| $75,000 to $99,999 | 3 | 5.5% |
| $100,000 to $149,999 | 1 | 1.8% |
| $150,000 to $199,999 | 2 | 3.6% |
| $200,000+ | 1 | 1.8% |
Family Income by Famaliy Size in Santee
4-person families (11 | 20.0%) account for the highest median family income in Santee with $29,583 per family, while 3-person families (17 | 30.9%) have the highest median income of $8,958 per family member.
| Income Bracket | # Families | Median Income |
| 2-Person Families | 11 (20.0%) | $0 |
| 3-Person Families | 17 (30.9%) | $26,875 |
| 4-Person Families | 11 (20.0%) | $29,583 |
| 5-Person Families | 12 (21.8%) | $0 |
| 6-Person Families | 2 (3.6%) | $0 |
| 7+ Person Families | 2 (3.6%) | $0 |
| Total | 55 (100.0%) | $31,250 |
Family Income by Number of Earners in Santee
| Number of Earners | # Families | Median Income |
| No Earners | 15 (27.3%) | $0 |
| 1 Earner | 26 (47.3%) | $32,500 |
| 2 Earners | 9 (16.4%) | $68,125 |
| 3+ Earners | 5 (9.1%) | $168,125 |
| Total | 55 (100.0%) | $31,250 |
Household Income in Santee
Household Income Brackets in Santee
With 16 households falling in the category, the $50,000 to $74,999 income range is the most frequent in Santee, accounting for 21.6% of all households. In contrast, only 1 households (1.3%) fall into the $100,000 to $149,999 income bracket, making it the least populous group.
| Income Bracket | # Households | % Households |
| Less than $10,000 | 7 | 9.5% |
| $10,000 to $14,999 | 9 | 12.2% |
| $15,000 to $24,999 | 8 | 10.8% |
| $25,000 to $34,999 | 11 | 14.9% |
| $35,000 to $49,999 | 14 | 18.9% |
| $50,000 to $74,999 | 16 | 21.6% |
| $75,000 to $99,999 | 4 | 5.4% |
| $100,000 to $149,999 | 1 | 1.4% |
| $150,000 to $199,999 | 3 | 4.1% |
| $200,000+ | 1 | 1.4% |
Household Income by Householder Age in Santee
The median household income in Santee is $38,333, with the highest median household income of $42,500 found in the 25 to 44 years age bracket for the primary householder. A total of 32 households (43.2%) fall into this category. Meanwhile, the 15 to 24 years age bracket for the primary householder has the lowest median household income of $0, with 5 households (6.8%) in this group.
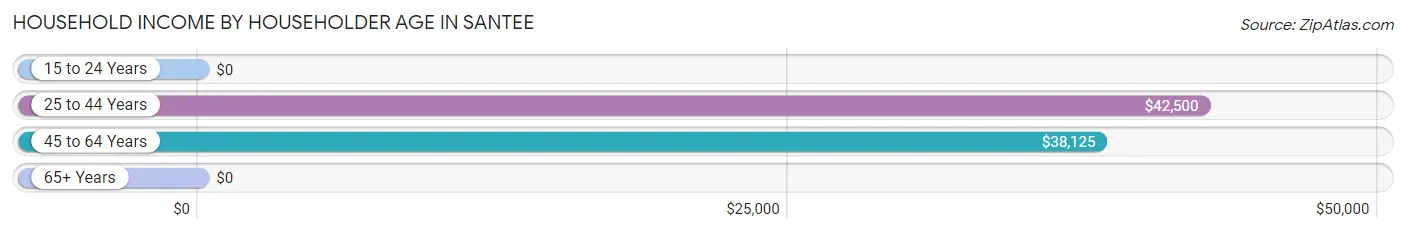
| Income Bracket | # Households | Median Income |
| 15 to 24 Years | 5 (6.8%) | $0 |
| 25 to 44 Years | 32 (43.2%) | $42,500 |
| 45 to 64 Years | 27 (36.5%) | $38,125 |
| 65+ Years | 10 (13.5%) | $0 |
| Total | 74 (100.0%) | $38,333 |
Poverty in Santee
Income Below Poverty by Sex and Age in Santee
With 41.7% poverty level for males and 35.2% for females among the residents of Santee, 15 year old males and 6 to 11 year old females are the most vulnerable to poverty, with 3 males (100.0%) and 10 females (55.6%) in their respective age groups living below the poverty level.
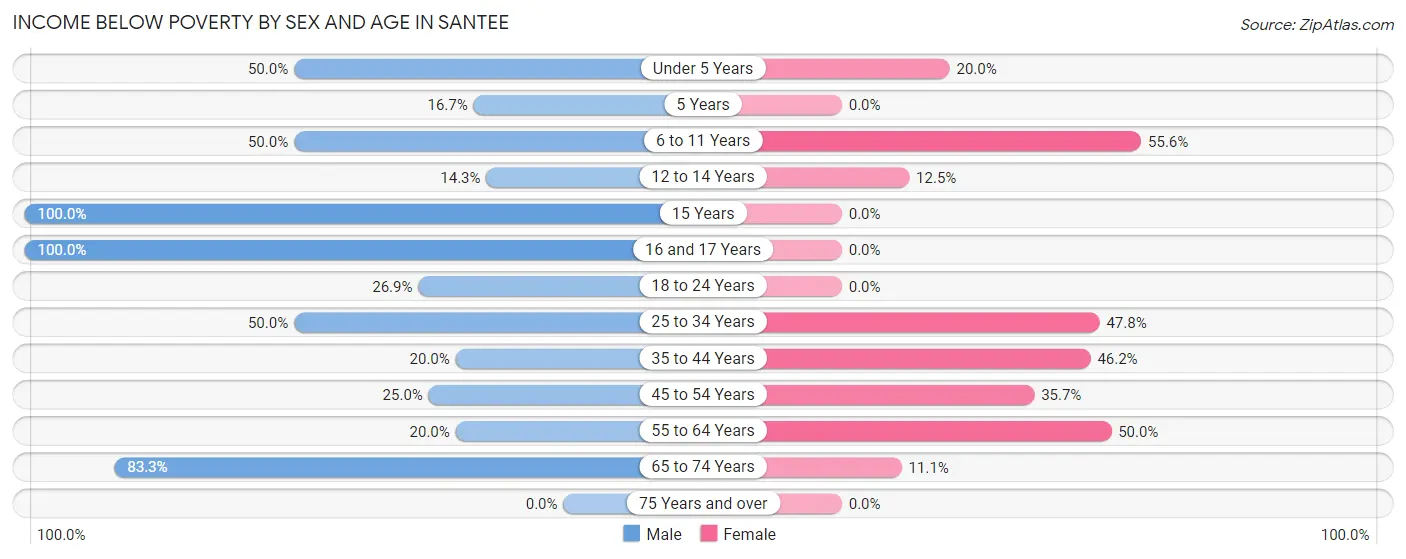
| Age Bracket | Male | Female |
| Under 5 Years | 6 (50.0%) | 3 (20.0%) |
| 5 Years | 1 (16.7%) | 0 (0.0%) |
| 6 to 11 Years | 13 (50.0%) | 10 (55.6%) |
| 12 to 14 Years | 1 (14.3%) | 1 (12.5%) |
| 15 Years | 3 (100.0%) | 0 (0.0%) |
| 16 and 17 Years | 8 (100.0%) | 0 (0.0%) |
| 18 to 24 Years | 7 (26.9%) | 0 (0.0%) |
| 25 to 34 Years | 6 (50.0%) | 11 (47.8%) |
| 35 to 44 Years | 2 (20.0%) | 6 (46.2%) |
| 45 to 54 Years | 2 (25.0%) | 5 (35.7%) |
| 55 to 64 Years | 1 (20.0%) | 6 (50.0%) |
| 65 to 74 Years | 5 (83.3%) | 1 (11.1%) |
| 75 Years and over | 0 (0.0%) | 0 (0.0%) |
| Total | 55 (41.7%) | 43 (35.2%) |
Income Above Poverty by Sex and Age in Santee
According to the poverty statistics in Santee, males aged 75 years and over and females aged 5 years are the age groups that are most secure financially, with 100.0% of males and 100.0% of females in these age groups living above the poverty line.
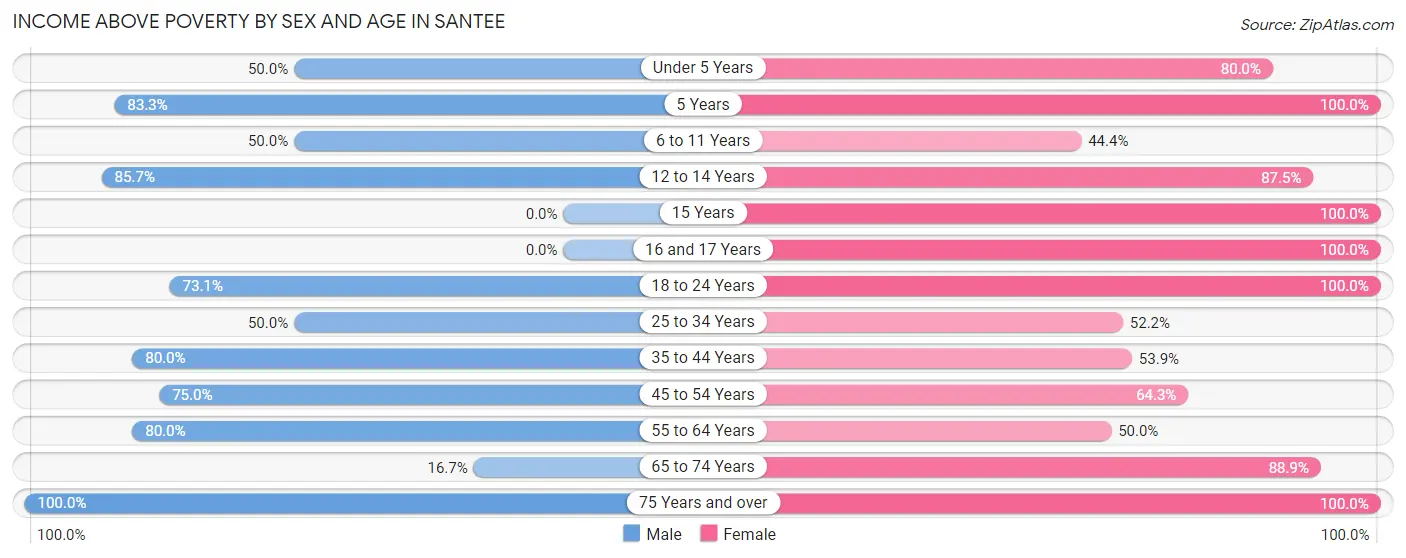
| Age Bracket | Male | Female |
| Under 5 Years | 6 (50.0%) | 12 (80.0%) |
| 5 Years | 5 (83.3%) | 1 (100.0%) |
| 6 to 11 Years | 13 (50.0%) | 8 (44.4%) |
| 12 to 14 Years | 6 (85.7%) | 7 (87.5%) |
| 15 Years | 0 (0.0%) | 1 (100.0%) |
| 16 and 17 Years | 0 (0.0%) | 4 (100.0%) |
| 18 to 24 Years | 19 (73.1%) | 3 (100.0%) |
| 25 to 34 Years | 6 (50.0%) | 12 (52.2%) |
| 35 to 44 Years | 8 (80.0%) | 7 (53.8%) |
| 45 to 54 Years | 6 (75.0%) | 9 (64.3%) |
| 55 to 64 Years | 4 (80.0%) | 6 (50.0%) |
| 65 to 74 Years | 1 (16.7%) | 8 (88.9%) |
| 75 Years and over | 3 (100.0%) | 1 (100.0%) |
| Total | 77 (58.3%) | 79 (64.7%) |
Income Below Poverty Among Married-Couple Families in Santee
The poverty statistics for married-couple families in Santee show that 33.3% or 6 of the total 18 families live below the poverty line. Families with 1 or 2 children have the highest poverty rate of 71.4%, comprising of 5 families. On the other hand, families with 3 or 4 children have the lowest poverty rate of 0.0%, which includes 0 families.
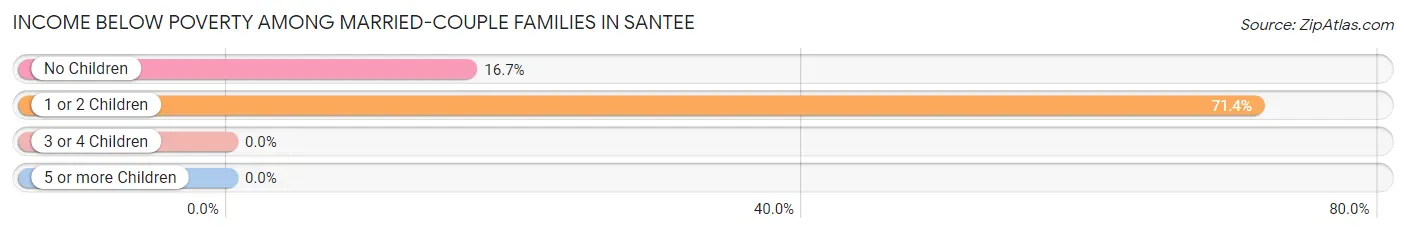
| Children | Above Poverty | Below Poverty |
| No Children | 5 (83.3%) | 1 (16.7%) |
| 1 or 2 Children | 2 (28.6%) | 5 (71.4%) |
| 3 or 4 Children | 4 (100.0%) | 0 (0.0%) |
| 5 or more Children | 1 (100.0%) | 0 (0.0%) |
| Total | 12 (66.7%) | 6 (33.3%) |
Income Below Poverty Among Single-Parent Households in Santee
According to the poverty data in Santee, 26.7% or 4 single-father households and 63.6% or 14 single-mother households are living below the poverty line. Among single-father households, those with 3 or 4 children have the highest poverty rate, with 2 households (50.0%) experiencing poverty. Likewise, among single-mother households, those with 3 or 4 children have the highest poverty rate, with 5 households (71.4%) falling below the poverty line.
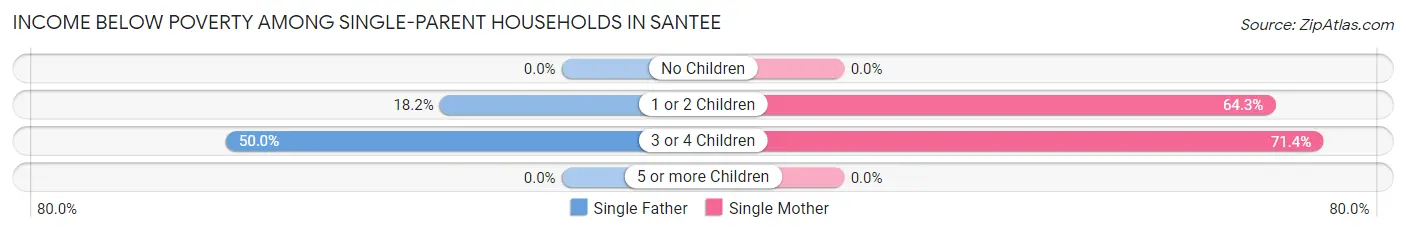
| Children | Single Father | Single Mother |
| No Children | 0 (0.0%) | 0 (0.0%) |
| 1 or 2 Children | 2 (18.2%) | 9 (64.3%) |
| 3 or 4 Children | 2 (50.0%) | 5 (71.4%) |
| 5 or more Children | 0 (0.0%) | 0 (0.0%) |
| Total | 4 (26.7%) | 14 (63.6%) |
Income Below Poverty Among Married-Couple vs Single-Parent Households in Santee
The poverty data for Santee shows that 6 of the married-couple family households (33.3%) and 18 of the single-parent households (48.6%) are living below the poverty level. Within the married-couple family households, those with 1 or 2 children have the highest poverty rate, with 5 households (71.4%) falling below the poverty line. Among the single-parent households, those with 3 or 4 children have the highest poverty rate, with 7 household (63.6%) living below poverty.
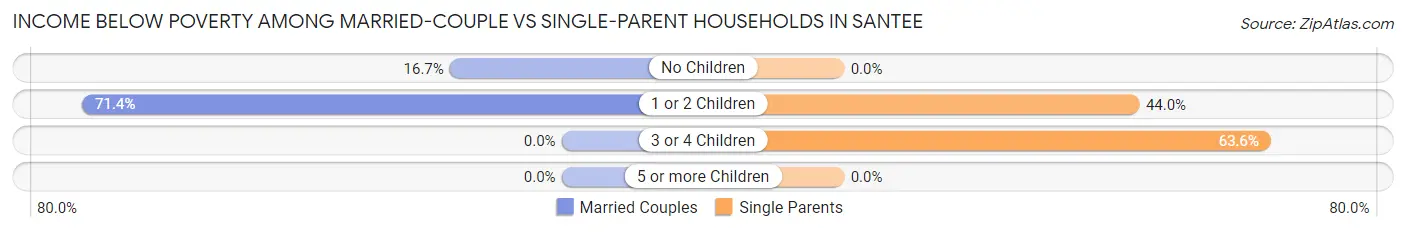
| Children | Married-Couple Families | Single-Parent Households |
| No Children | 1 (16.7%) | 0 (0.0%) |
| 1 or 2 Children | 5 (71.4%) | 11 (44.0%) |
| 3 or 4 Children | 0 (0.0%) | 7 (63.6%) |
| 5 or more Children | 0 (0.0%) | 0 (0.0%) |
| Total | 6 (33.3%) | 18 (48.6%) |
Race in Santee
The most populous races in Santee are Native / Alaskan (226 | 86.3%), Hispanic or Latino (38 | 14.5%), and White / Caucasian (13 | 5.0%).
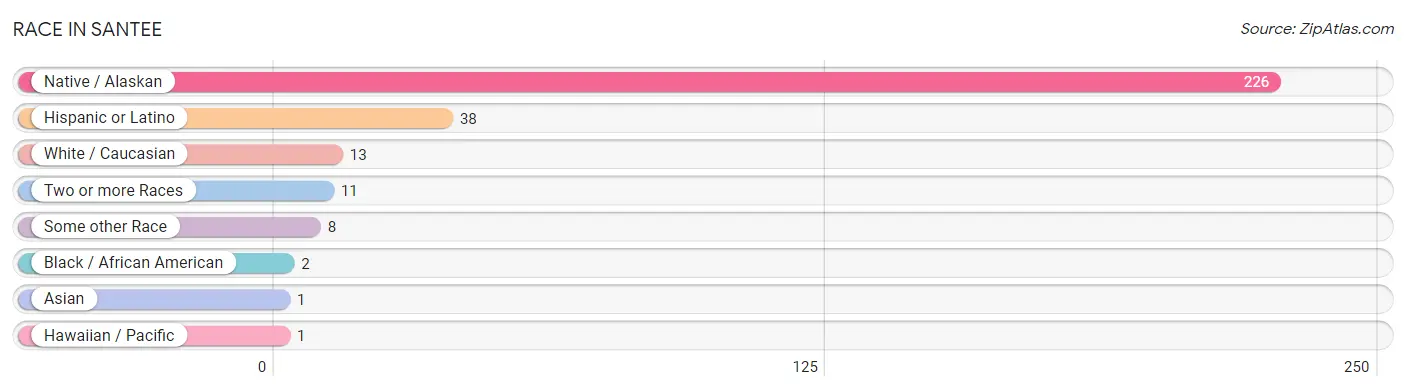
| Race | # Population | % Population |
| Asian | 1 | 0.4% |
| Black / African American | 2 | 0.8% |
| Hawaiian / Pacific | 1 | 0.4% |
| Hispanic or Latino | 38 | 14.5% |
| Native / Alaskan | 226 | 86.3% |
| White / Caucasian | 13 | 5.0% |
| Two or more Races | 11 | 4.2% |
| Some other Race | 8 | 3.0% |
| Total | 262 | 100.0% |
Ancestry in Santee
The most populous ancestries reported in Santee are Sioux (202 | 77.1%), Mexican (38 | 14.5%), German (14 | 5.3%), Cree (5 | 1.9%), and Navajo (5 | 1.9%), together accounting for 100.8% of all Santee residents.
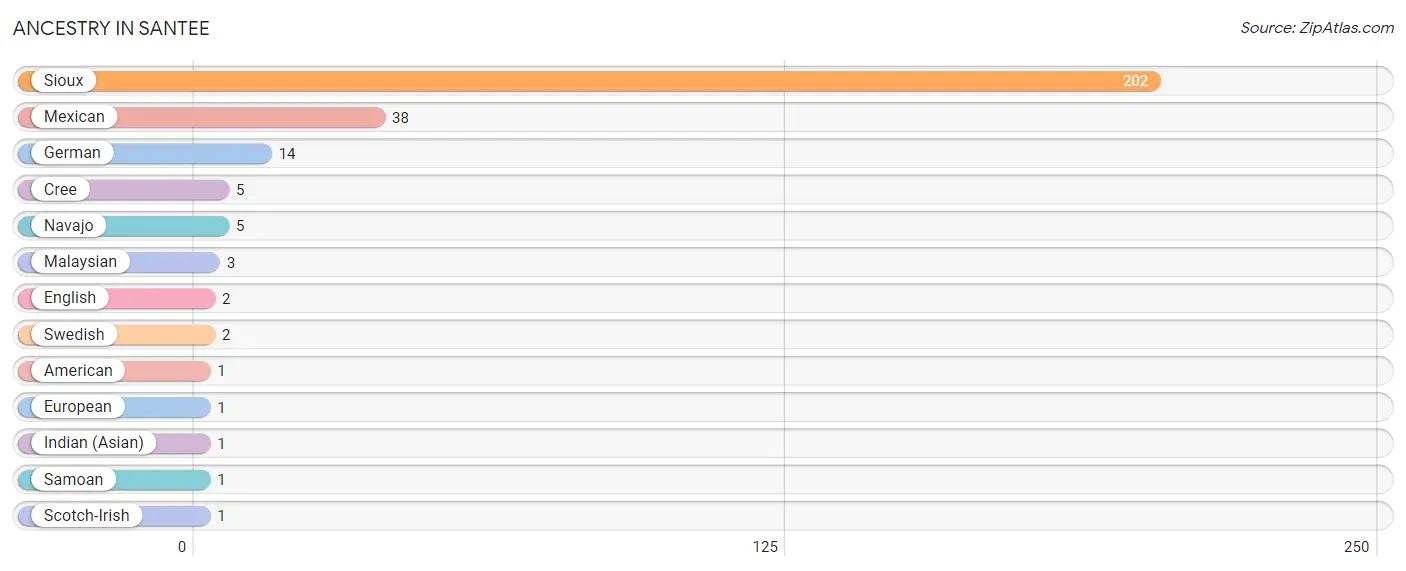
| Ancestry | # Population | % Population |
| American | 1 | 0.4% |
| Cree | 5 | 1.9% |
| English | 2 | 0.8% |
| European | 1 | 0.4% |
| German | 14 | 5.3% |
| Indian (Asian) | 1 | 0.4% |
| Malaysian | 3 | 1.1% |
| Mexican | 38 | 14.5% |
| Navajo | 5 | 1.9% |
| Samoan | 1 | 0.4% |
| Scotch-Irish | 1 | 0.4% |
| Sioux | 202 | 77.1% |
| Swedish | 2 | 0.8% | View All 13 Rows |
Immigrants in Santee
The most numerous immigrant groups reported in Santee came from Central America (3 | 1.1%), Latin America (3 | 1.1%), Mexico (3 | 1.1%), and Oceania (1 | 0.4%), together accounting for 3.8% of all Santee residents.
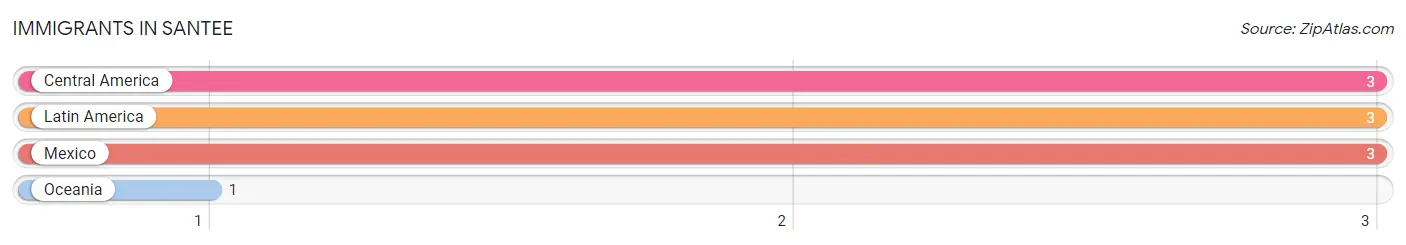
| Immigration Origin | # Population | % Population |
| Central America | 3 | 1.1% |
| Latin America | 3 | 1.1% |
| Mexico | 3 | 1.1% |
| Oceania | 1 | 0.4% | View All 4 Rows |
Sex and Age in Santee
Sex and Age in Santee
The most populous age groups in Santee are 5 to 9 Years (25 | 18.4%) for men and Under 5 Years (16 | 12.7%) for women.
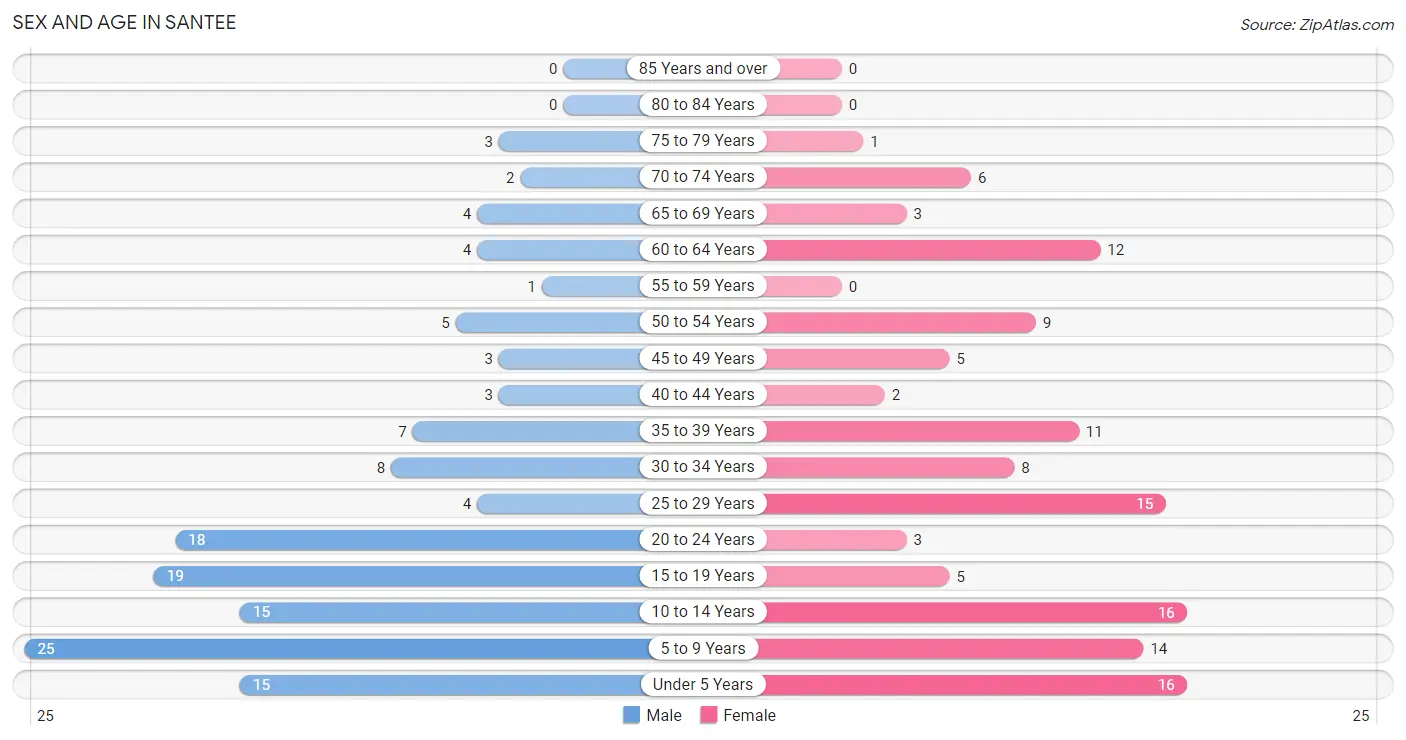
| Age Bracket | Male | Female |
| Under 5 Years | 15 (11.0%) | 16 (12.7%) |
| 5 to 9 Years | 25 (18.4%) | 14 (11.1%) |
| 10 to 14 Years | 15 (11.0%) | 16 (12.7%) |
| 15 to 19 Years | 19 (14.0%) | 5 (4.0%) |
| 20 to 24 Years | 18 (13.2%) | 3 (2.4%) |
| 25 to 29 Years | 4 (2.9%) | 15 (11.9%) |
| 30 to 34 Years | 8 (5.9%) | 8 (6.4%) |
| 35 to 39 Years | 7 (5.1%) | 11 (8.7%) |
| 40 to 44 Years | 3 (2.2%) | 2 (1.6%) |
| 45 to 49 Years | 3 (2.2%) | 5 (4.0%) |
| 50 to 54 Years | 5 (3.7%) | 9 (7.1%) |
| 55 to 59 Years | 1 (0.7%) | 0 (0.0%) |
| 60 to 64 Years | 4 (2.9%) | 12 (9.5%) |
| 65 to 69 Years | 4 (2.9%) | 3 (2.4%) |
| 70 to 74 Years | 2 (1.5%) | 6 (4.8%) |
| 75 to 79 Years | 3 (2.2%) | 1 (0.8%) |
| 80 to 84 Years | 0 (0.0%) | 0 (0.0%) |
| 85 Years and over | 0 (0.0%) | 0 (0.0%) |
| Total | 136 (100.0%) | 126 (100.0%) |
Families and Households in Santee
Median Family Size in Santee
The median family size in Santee is 4.04 persons per family, with married-couple families (18 | 32.7%) accounting for the largest median family size of 5.06 persons per family. On the other hand, single male/father families (15 | 27.3%) represent the smallest median family size with 3.00 persons per family.
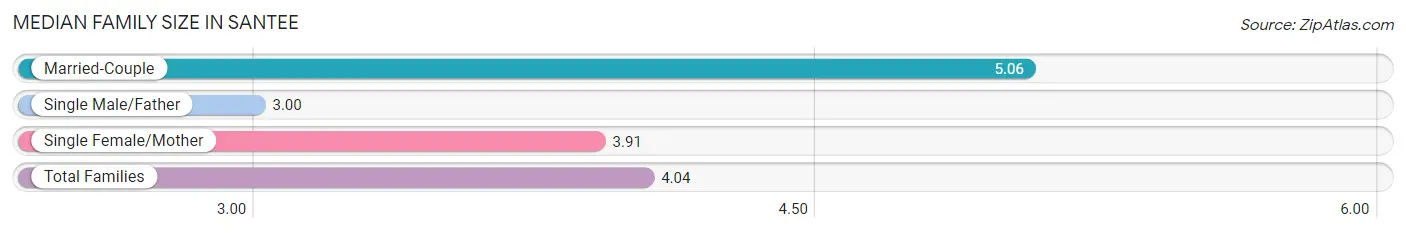
| Family Type | # Families | Family Size |
| Married-Couple | 18 (32.7%) | 5.06 |
| Single Male/Father | 15 (27.3%) | 3.00 |
| Single Female/Mother | 22 (40.0%) | 3.91 |
| Total Families | 55 (100.0%) | 4.04 |
Median Household Size in Santee
The median household size in Santee is 3.50 persons per household, with married-couple households (18 | 24.3%) accounting for the largest median household size of 5.06 persons per household. non-family households (19 | 25.7%) represent the smallest median household size with 1.11 persons per household.
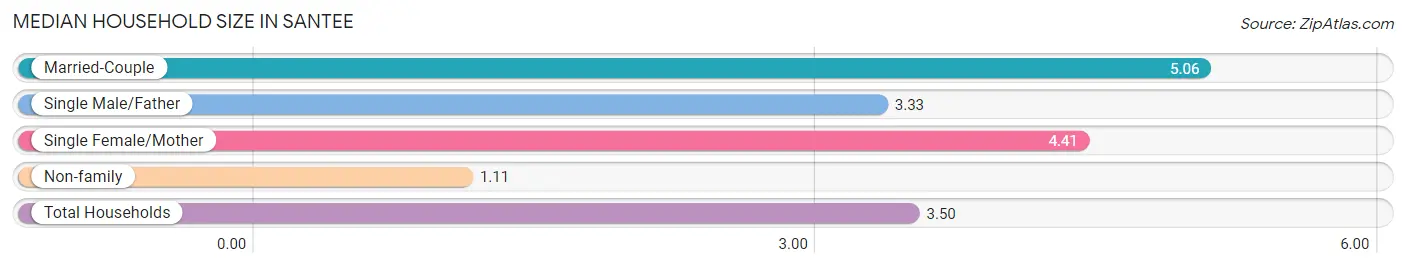
| Household Type | # Households | Household Size |
| Married-Couple | 18 (24.3%) | 5.06 |
| Single Male/Father | 15 (20.3%) | 3.33 |
| Single Female/Mother | 22 (29.7%) | 4.41 |
| Non-family | 19 (25.7%) | 1.11 |
| Total Households | 74 (100.0%) | 3.50 |
Household Size by Marriage Status in Santee
Out of a total of 74 households in Santee, 55 (74.3%) are family households, while 19 (25.7%) are nonfamily households. The most numerous type of family households are 4-person households, comprising 17, and the most common type of nonfamily households are 1-person households, comprising 17.
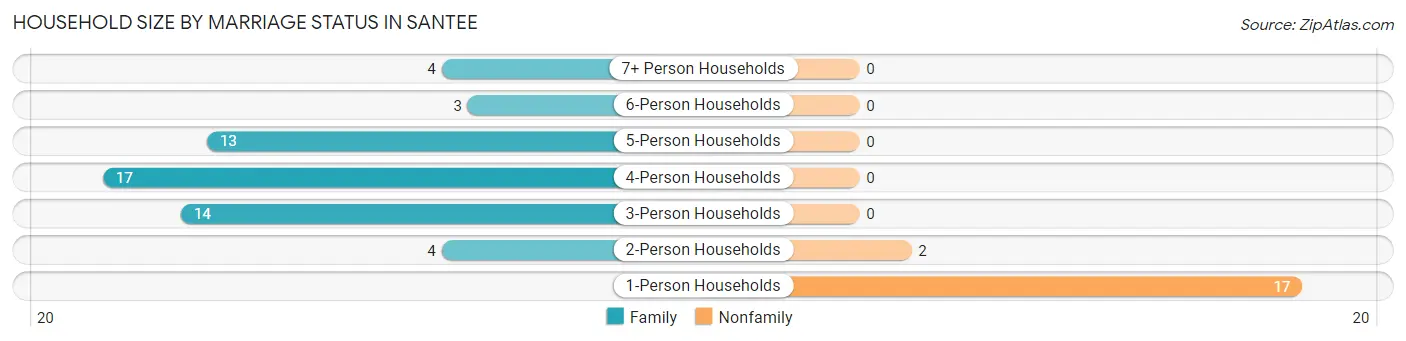
| Household Size | Family Households | Nonfamily Households |
| 1-Person Households | - | 17 (23.0%) |
| 2-Person Households | 4 (5.4%) | 2 (2.7%) |
| 3-Person Households | 14 (18.9%) | 0 (0.0%) |
| 4-Person Households | 17 (23.0%) | 0 (0.0%) |
| 5-Person Households | 13 (17.6%) | 0 (0.0%) |
| 6-Person Households | 3 (4.1%) | 0 (0.0%) |
| 7+ Person Households | 4 (5.4%) | 0 (0.0%) |
| Total | 55 (74.3%) | 19 (25.7%) |
Female Fertility in Santee
Fertility by Age in Santee
Average fertility rate in Santee is 82.0 births per 1,000 women. Women in the age bracket of 20 to 34 years have the highest fertility rate with 154.0 births per 1,000 women. Women in the age bracket of 20 to 34 years acount for 100.0% of all women with births.
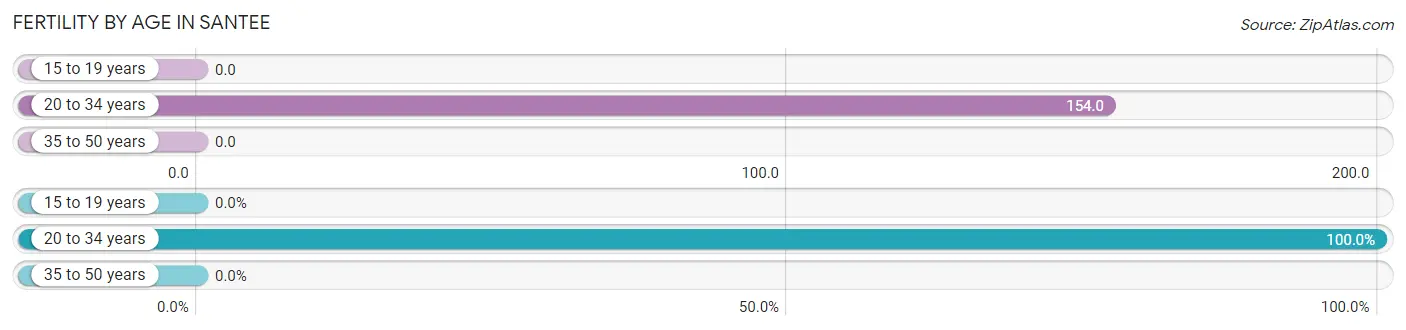
| Age Bracket | Women with Births | Births / 1,000 Women |
| 15 to 19 years | 0 (0.0%) | 0.0 |
| 20 to 34 years | 4 (100.0%) | 154.0 |
| 35 to 50 years | 0 (0.0%) | 0.0 |
| Total | 4 (100.0%) | 82.0 |
Fertility by Age by Marriage Status in Santee
25.0% of women with births (4) in Santee are married. The highest percentage of unmarried women with births falls into 20 to 34 years age bracket with 75.0% of them unmarried at the time of birth, while the lowest percentage of unmarried women with births belong to 20 to 34 years age bracket with 75.0% of them unmarried.
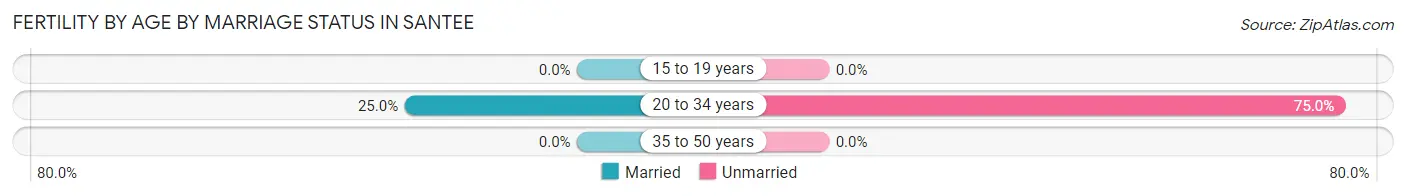
| Age Bracket | Married | Unmarried |
| 15 to 19 years | 0 (0.0%) | 0 (0.0%) |
| 20 to 34 years | 1 (25.0%) | 3 (75.0%) |
| 35 to 50 years | 0 (0.0%) | 0 (0.0%) |
| Total | 1 (25.0%) | 3 (75.0%) |
Fertility by Education in Santee
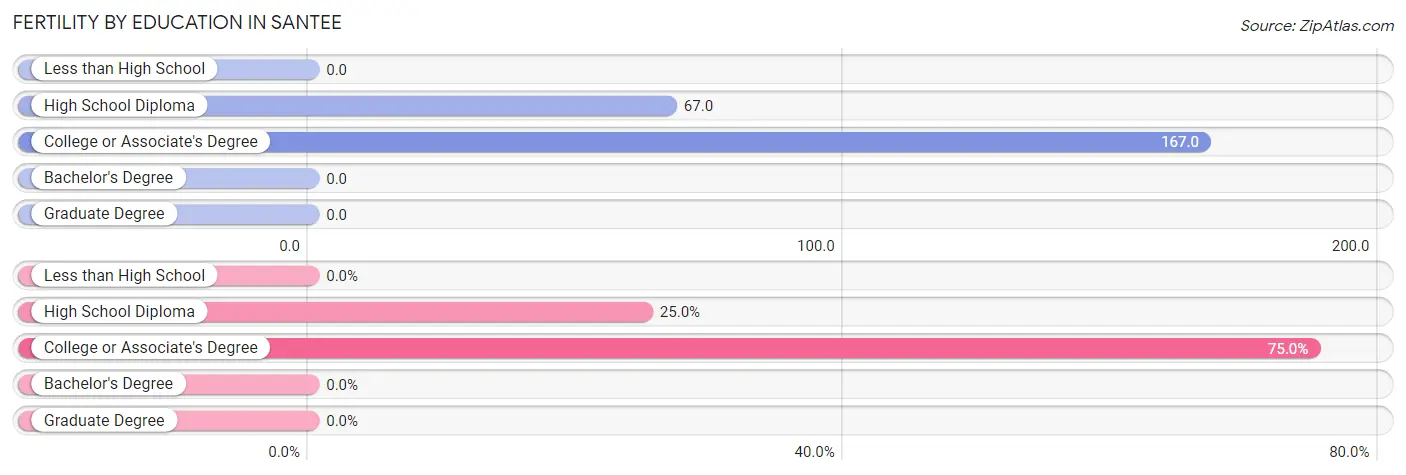
| Educational Attainment | Women with Births | Births / 1,000 Women |
| Less than High School | 0 (0.0%) | 0.0 |
| High School Diploma | 1 (25.0%) | 67.0 |
| College or Associate's Degree | 3 (75.0%) | 167.0 |
| Bachelor's Degree | 0 (0.0%) | 0.0 |
| Graduate Degree | 0 (0.0%) | 0.0 |
| Total | 4 (100.0%) | 82.0 |
Fertility by Education by Marriage Status in Santee
75.0% of women with births in Santee are unmarried. Women with the educational attainment of high school diploma are most likely to be married with 100.0% of them married at childbirth, while women with the educational attainment of college or associate's degree are least likely to be married with 100.0% of them unmarried at childbirth.
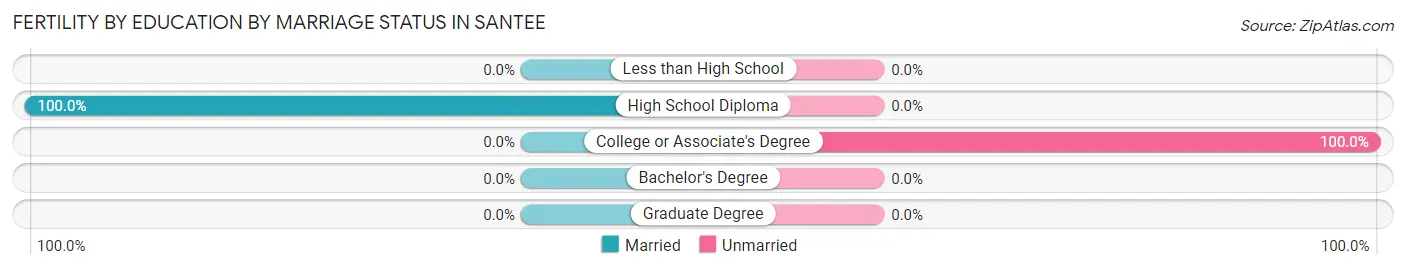
| Educational Attainment | Married | Unmarried |
| Less than High School | 0 (0.0%) | 0 (0.0%) |
| High School Diploma | 1 (100.0%) | 0 (0.0%) |
| College or Associate's Degree | 0 (0.0%) | 3 (100.0%) |
| Bachelor's Degree | 0 (0.0%) | 0 (0.0%) |
| Graduate Degree | 0 (0.0%) | 0 (0.0%) |
| Total | 1 (25.0%) | 3 (75.0%) |
Employment Characteristics in Santee
Employment by Class of Employer in Santee
Among the 76 employed individuals in Santee, local government employees (45 | 59.2%), federal government employees (16 | 21.0%), and private company employees (9 | 11.8%) make up the most common classes of employment.
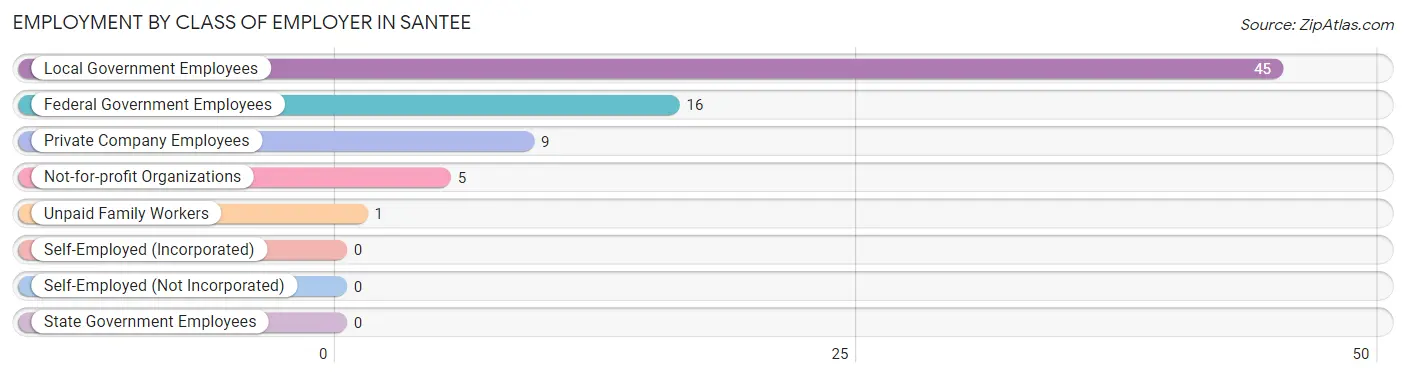
| Employer Class | # Employees | % Employees |
| Private Company Employees | 9 | 11.8% |
| Self-Employed (Incorporated) | 0 | 0.0% |
| Self-Employed (Not Incorporated) | 0 | 0.0% |
| Not-for-profit Organizations | 5 | 6.6% |
| Local Government Employees | 45 | 59.2% |
| State Government Employees | 0 | 0.0% |
| Federal Government Employees | 16 | 21.0% |
| Unpaid Family Workers | 1 | 1.3% |
| Total | 76 | 100.0% |
Employment Status by Age in Santee
According to the labor force statistics for Santee, out of the total population over 16 years of age (157), 64.3% or 101 individuals are in the labor force, with 23.8% or 24 of them unemployed. The age group with the highest labor force participation rate is 30 to 34 years, with 87.5% or 14 individuals in the labor force. Within the labor force, the 20 to 24 years age range has the highest percentage of unemployed individuals, with 38.5% or 5 of them being unemployed.
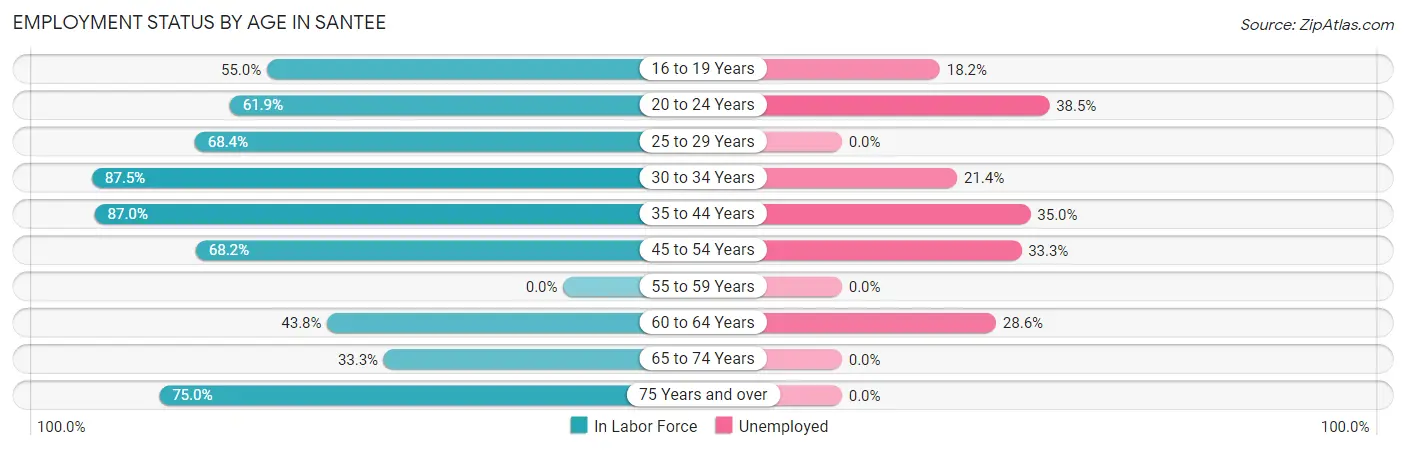
| Age Bracket | In Labor Force | Unemployed |
| 16 to 19 Years | 11 (55.0%) | 2 (18.2%) |
| 20 to 24 Years | 13 (61.9%) | 5 (38.5%) |
| 25 to 29 Years | 13 (68.4%) | 0 (0.0%) |
| 30 to 34 Years | 14 (87.5%) | 3 (21.4%) |
| 35 to 44 Years | 20 (87.0%) | 7 (35.0%) |
| 45 to 54 Years | 15 (68.2%) | 5 (33.3%) |
| 55 to 59 Years | 0 (0.0%) | 0 (0.0%) |
| 60 to 64 Years | 7 (43.8%) | 2 (28.6%) |
| 65 to 74 Years | 5 (33.3%) | 0 (0.0%) |
| 75 Years and over | 3 (75.0%) | 0 (0.0%) |
| Total | 101 (64.3%) | 24 (23.8%) |
Employment Status by Educational Attainment in Santee
According to labor force statistics for Santee, 71.1% of individuals (69) out of the total population between 25 and 64 years of age (97) are in the labor force, with 24.6% or 17 of them being unemployed. The group with the highest labor force participation rate are those with the educational attainment of high school diploma, with 77.8% or 28 individuals in the labor force. Within the labor force, individuals with less than high school education have the highest percentage of unemployment, with 33.3% or 3 of them being unemployed.
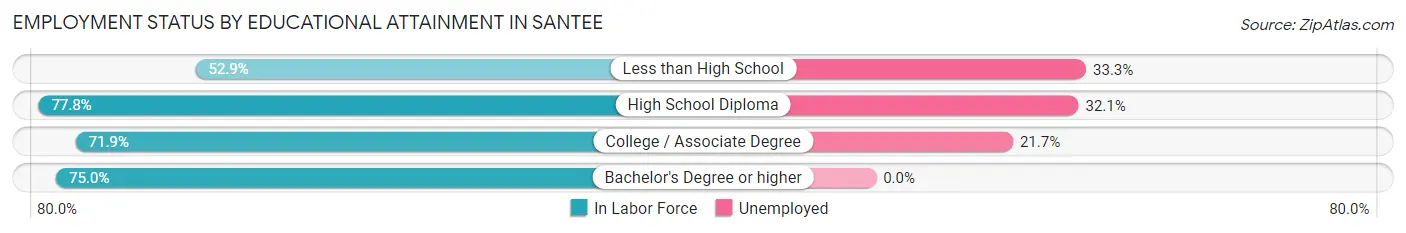
| Educational Attainment | In Labor Force | Unemployed |
| Less than High School | 9 (52.9%) | 6 (33.3%) |
| High School Diploma | 28 (77.8%) | 12 (32.1%) |
| College / Associate Degree | 23 (71.9%) | 7 (21.7%) |
| Bachelor's Degree or higher | 9 (75.0%) | 0 (0.0%) |
| Total | 69 (71.1%) | 24 (24.6%) |
Employment Occupations by Sex in Santee
Management, Business, Science and Arts Occupations
The most common Management, Business, Science and Arts occupations in Santee are Community & Social Service (21 | 27.3%), Education Instruction & Library (13 | 16.9%), Education, Arts & Media (8 | 10.4%), Management (4 | 5.2%), and Health Diagnosing & Treating (4 | 5.2%).

Management, Business, Science and Arts Occupations by Sex
Within the Management, Business, Science and Arts occupations in Santee, the most male-oriented occupations are Education, Arts & Media (75.0%), Management (50.0%), and Health Diagnosing & Treating (50.0%), while the most female-oriented occupations are Education Instruction & Library (84.6%), Community & Social Service (61.9%), and Management (50.0%).
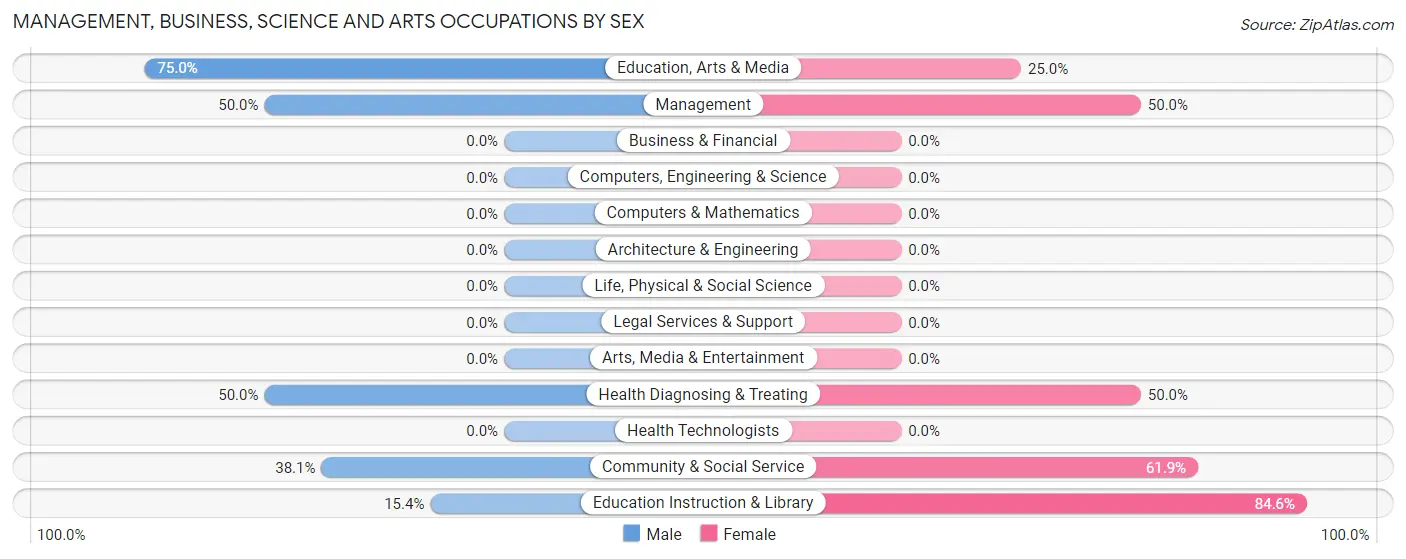
| Occupation | Male | Female |
| Management | 2 (50.0%) | 2 (50.0%) |
| Business & Financial | 0 (0.0%) | 0 (0.0%) |
| Computers, Engineering & Science | 0 (0.0%) | 0 (0.0%) |
| Computers & Mathematics | 0 (0.0%) | 0 (0.0%) |
| Architecture & Engineering | 0 (0.0%) | 0 (0.0%) |
| Life, Physical & Social Science | 0 (0.0%) | 0 (0.0%) |
| Community & Social Service | 8 (38.1%) | 13 (61.9%) |
| Education, Arts & Media | 6 (75.0%) | 2 (25.0%) |
| Legal Services & Support | 0 (0.0%) | 0 (0.0%) |
| Education Instruction & Library | 2 (15.4%) | 11 (84.6%) |
| Arts, Media & Entertainment | 0 (0.0%) | 0 (0.0%) |
| Health Diagnosing & Treating | 2 (50.0%) | 2 (50.0%) |
| Health Technologists | 0 (0.0%) | 0 (0.0%) |
| Total (Category) | 12 (41.4%) | 17 (58.6%) |
| Total (Overall) | 39 (50.6%) | 38 (49.3%) |
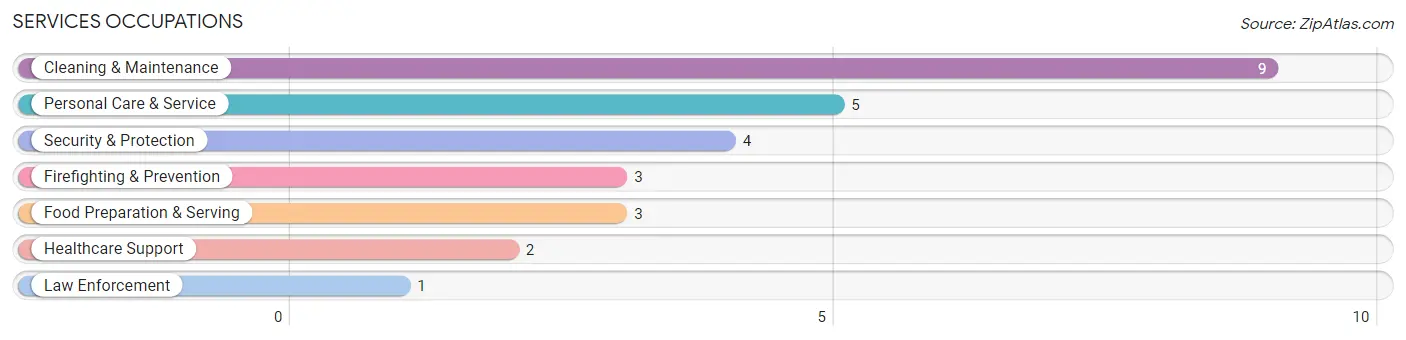
Services Occupations
The most common Services occupations in Santee are Cleaning & Maintenance (9 | 11.7%), Personal Care & Service (5 | 6.5%), Security & Protection (4 | 5.2%), Firefighting & Prevention (3 | 3.9%), and Food Preparation & Serving (3 | 3.9%).
Services Occupations by Sex
Within the Services occupations in Santee, the most male-oriented occupations are Security & Protection (100.0%), Firefighting & Prevention (100.0%), and Law Enforcement (100.0%), while the most female-oriented occupations are Personal Care & Service (80.0%), and Healthcare Support (50.0%).
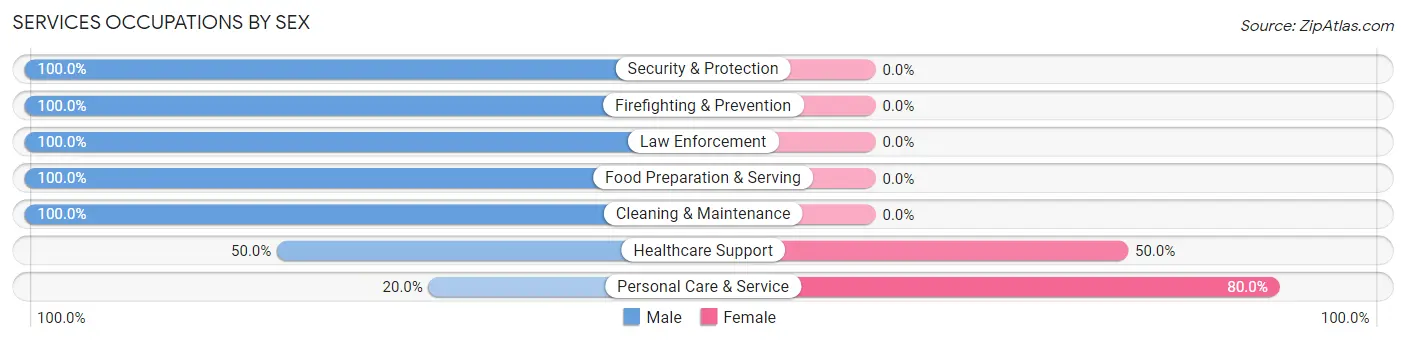
| Occupation | Male | Female |
| Healthcare Support | 1 (50.0%) | 1 (50.0%) |
| Security & Protection | 4 (100.0%) | 0 (0.0%) |
| Firefighting & Prevention | 3 (100.0%) | 0 (0.0%) |
| Law Enforcement | 1 (100.0%) | 0 (0.0%) |
| Food Preparation & Serving | 3 (100.0%) | 0 (0.0%) |
| Cleaning & Maintenance | 9 (100.0%) | 0 (0.0%) |
| Personal Care & Service | 1 (20.0%) | 4 (80.0%) |
| Total (Category) | 18 (78.3%) | 5 (21.7%) |
| Total (Overall) | 39 (50.6%) | 38 (49.3%) |
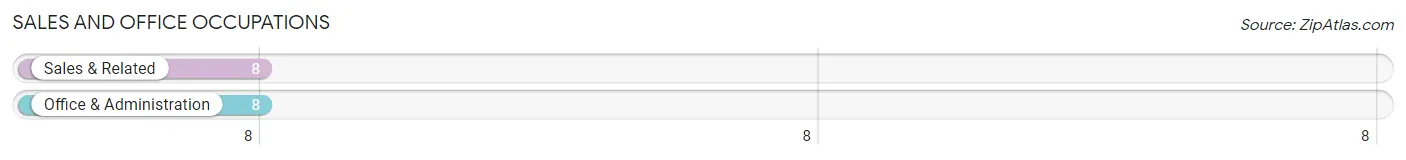
Sales and Office Occupations
The most common Sales and Office occupations in Santee are Sales & Related (8 | 10.4%), and Office & Administration (8 | 10.4%).
Sales and Office Occupations by Sex
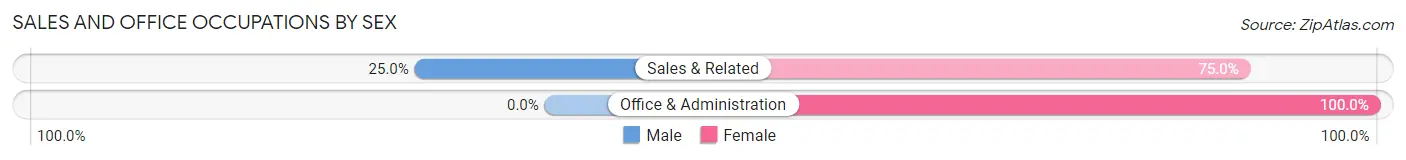
| Occupation | Male | Female |
| Sales & Related | 2 (25.0%) | 6 (75.0%) |
| Office & Administration | 0 (0.0%) | 8 (100.0%) |
| Total (Category) | 2 (12.5%) | 14 (87.5%) |
| Total (Overall) | 39 (50.6%) | 38 (49.3%) |
Natural Resources, Construction and Maintenance Occupations
The most common Natural Resources, Construction and Maintenance occupations in Santee are , and Construction & Extraction (3 | 3.9%).
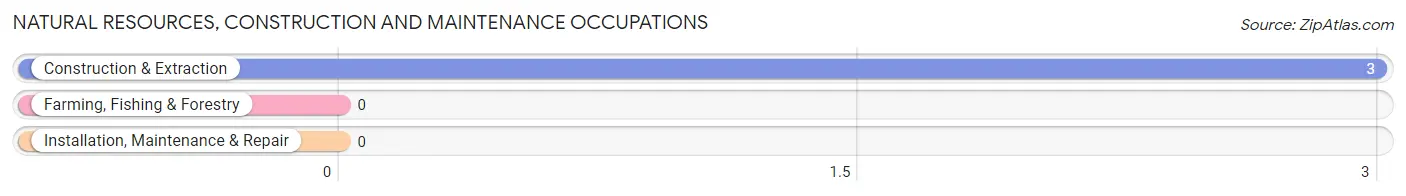
Natural Resources, Construction and Maintenance Occupations by Sex
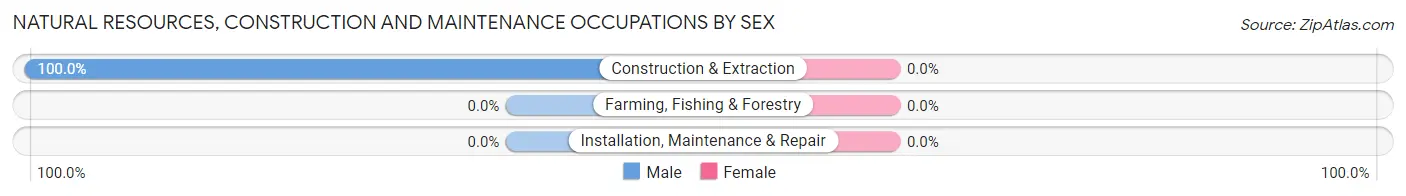
| Occupation | Male | Female |
| Farming, Fishing & Forestry | 0 (0.0%) | 0 (0.0%) |
| Construction & Extraction | 3 (100.0%) | 0 (0.0%) |
| Installation, Maintenance & Repair | 0 (0.0%) | 0 (0.0%) |
| Total (Category) | 3 (100.0%) | 0 (0.0%) |
| Total (Overall) | 39 (50.6%) | 38 (49.3%) |
Production, Transportation and Moving Occupations
The most common Production, Transportation and Moving occupations in Santee are Transportation (4 | 5.2%), Production (1 | 1.3%), and Material Moving (1 | 1.3%).
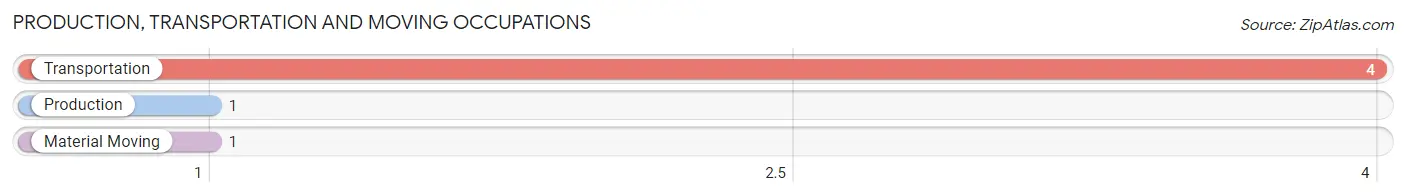
Production, Transportation and Moving Occupations by Sex
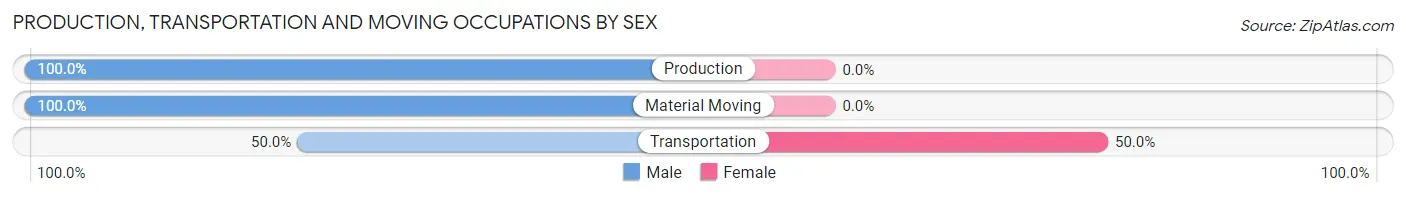
| Occupation | Male | Female |
| Production | 1 (100.0%) | 0 (0.0%) |
| Transportation | 2 (50.0%) | 2 (50.0%) |
| Material Moving | 1 (100.0%) | 0 (0.0%) |
| Total (Category) | 4 (66.7%) | 2 (33.3%) |
| Total (Overall) | 39 (50.6%) | 38 (49.3%) |
Employment Industries by Sex in Santee
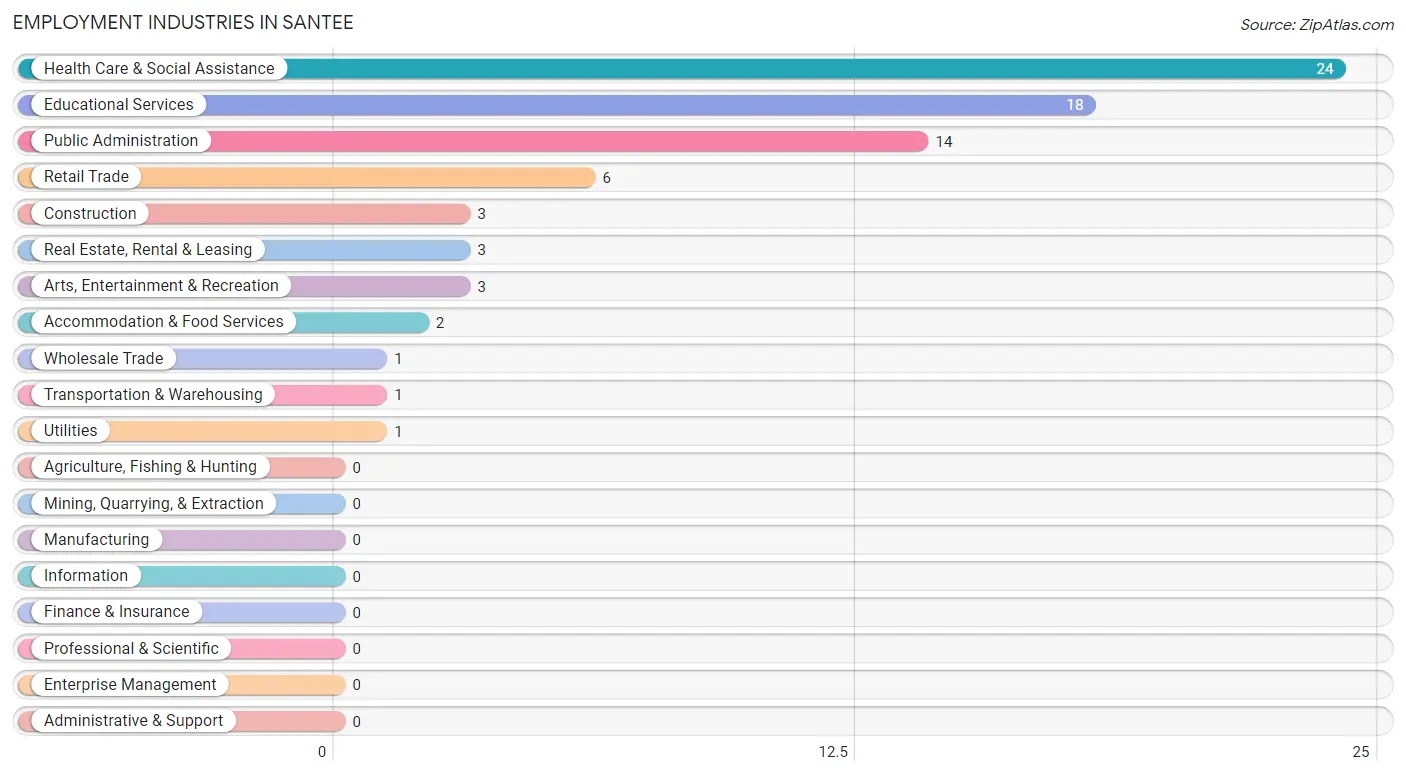
Employment Industries in Santee
The major employment industries in Santee include Health Care & Social Assistance (24 | 31.2%), Educational Services (18 | 23.4%), Public Administration (14 | 18.2%), Retail Trade (6 | 7.8%), and Construction (3 | 3.9%).
Employment Industries by Sex in Santee
The Santee industries that see more men than women are Construction (100.0%), Wholesale Trade (100.0%), and Utilities (100.0%), whereas the industries that tend to have a higher number of women are Retail Trade (100.0%), Transportation & Warehousing (100.0%), and Real Estate, Rental & Leasing (66.7%).
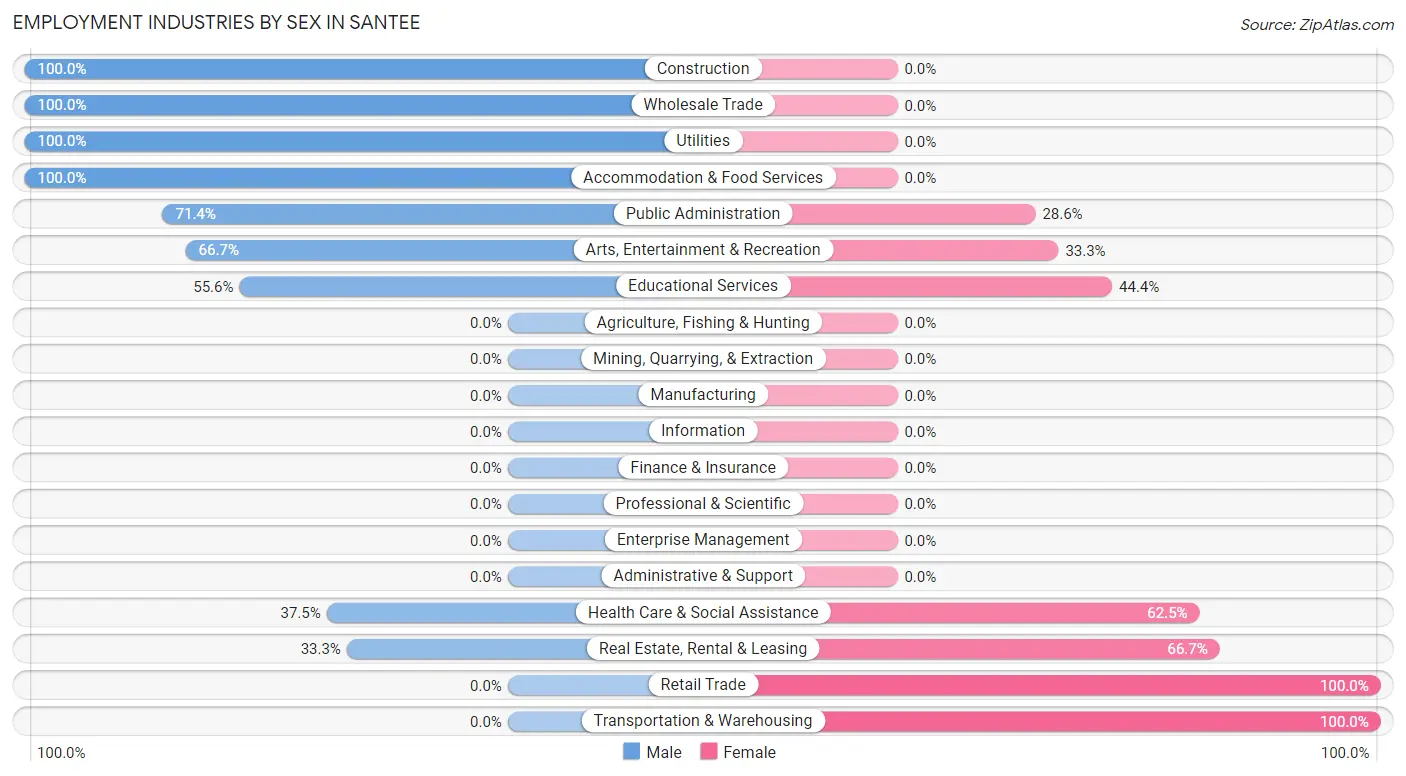
| Industry | Male | Female |
| Agriculture, Fishing & Hunting | 0 (0.0%) | 0 (0.0%) |
| Mining, Quarrying, & Extraction | 0 (0.0%) | 0 (0.0%) |
| Construction | 3 (100.0%) | 0 (0.0%) |
| Manufacturing | 0 (0.0%) | 0 (0.0%) |
| Wholesale Trade | 1 (100.0%) | 0 (0.0%) |
| Retail Trade | 0 (0.0%) | 6 (100.0%) |
| Transportation & Warehousing | 0 (0.0%) | 1 (100.0%) |
| Utilities | 1 (100.0%) | 0 (0.0%) |
| Information | 0 (0.0%) | 0 (0.0%) |
| Finance & Insurance | 0 (0.0%) | 0 (0.0%) |
| Real Estate, Rental & Leasing | 1 (33.3%) | 2 (66.7%) |
| Professional & Scientific | 0 (0.0%) | 0 (0.0%) |
| Enterprise Management | 0 (0.0%) | 0 (0.0%) |
| Administrative & Support | 0 (0.0%) | 0 (0.0%) |
| Educational Services | 10 (55.6%) | 8 (44.4%) |
| Health Care & Social Assistance | 9 (37.5%) | 15 (62.5%) |
| Arts, Entertainment & Recreation | 2 (66.7%) | 1 (33.3%) |
| Accommodation & Food Services | 2 (100.0%) | 0 (0.0%) |
| Public Administration | 10 (71.4%) | 4 (28.6%) |
| Total | 39 (50.6%) | 38 (49.3%) |
Education in Santee
School Enrollment in Santee
The most common levels of schooling among the 118 students in Santee are elementary school (35 | 29.7%), middle school (20 | 17.0%), and high school (20 | 17.0%).
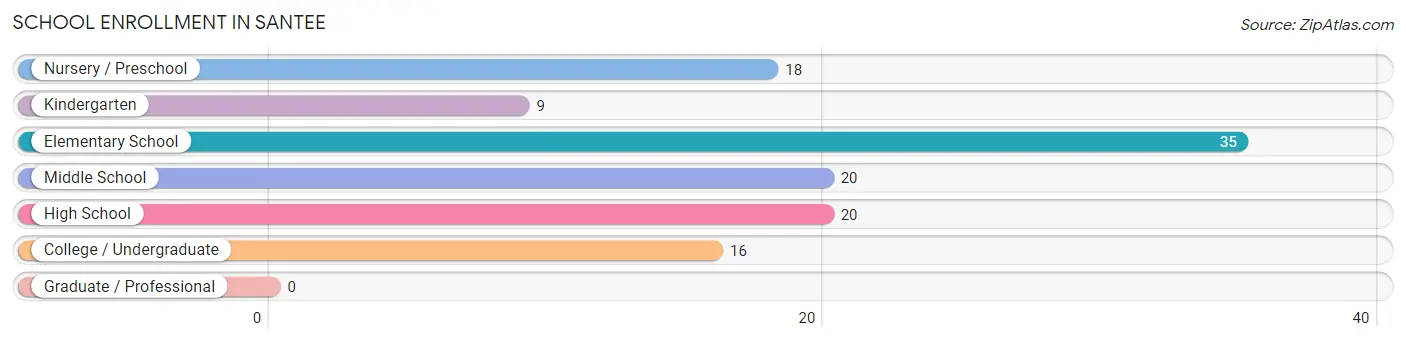
| School Level | # Students | % Students |
| Nursery / Preschool | 18 | 15.2% |
| Kindergarten | 9 | 7.6% |
| Elementary School | 35 | 29.7% |
| Middle School | 20 | 17.0% |
| High School | 20 | 17.0% |
| College / Undergraduate | 16 | 13.6% |
| Graduate / Professional | 0 | 0.0% |
| Total | 118 | 100.0% |
School Enrollment by Age by Funding Source in Santee
Out of a total of 118 students who are enrolled in schools in Santee, 4 (3.4%) attend a private institution, while the remaining 114 (96.6%) are enrolled in public schools. The age group of 20 to 24 year olds has the highest likelihood of being enrolled in private schools, with 1 (50.0% in the age bracket) enrolled. Conversely, the age group of 3 to 4 year olds has the lowest likelihood of being enrolled in a private school, with 12 (100.0% in the age bracket) attending a public institution.
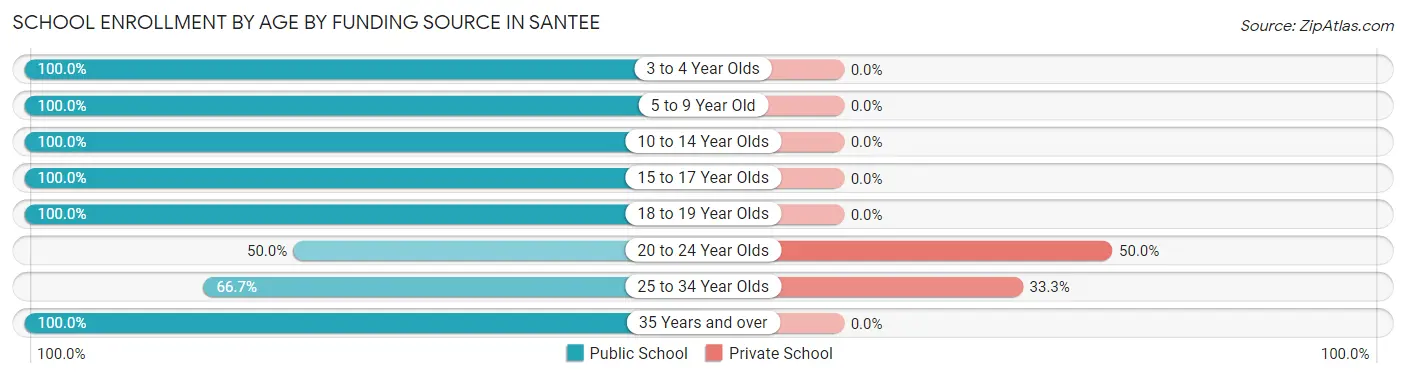
| Age Bracket | Public School | Private School |
| 3 to 4 Year Olds | 12 (100.0%) | 0 (0.0%) |
| 5 to 9 Year Old | 39 (100.0%) | 0 (0.0%) |
| 10 to 14 Year Olds | 31 (100.0%) | 0 (0.0%) |
| 15 to 17 Year Olds | 16 (100.0%) | 0 (0.0%) |
| 18 to 19 Year Olds | 2 (100.0%) | 0 (0.0%) |
| 20 to 24 Year Olds | 1 (50.0%) | 1 (50.0%) |
| 25 to 34 Year Olds | 6 (66.7%) | 3 (33.3%) |
| 35 Years and over | 7 (100.0%) | 0 (0.0%) |
| Total | 114 (96.6%) | 4 (3.4%) |
Educational Attainment by Field of Study in Santee
Social sciences (6 | 30.0%), education (6 | 30.0%), computers & mathematics (2 | 10.0%), psychology (2 | 10.0%), and science & technology (2 | 10.0%) are the most common fields of study among 20 individuals in Santee who have obtained a bachelor's degree or higher.
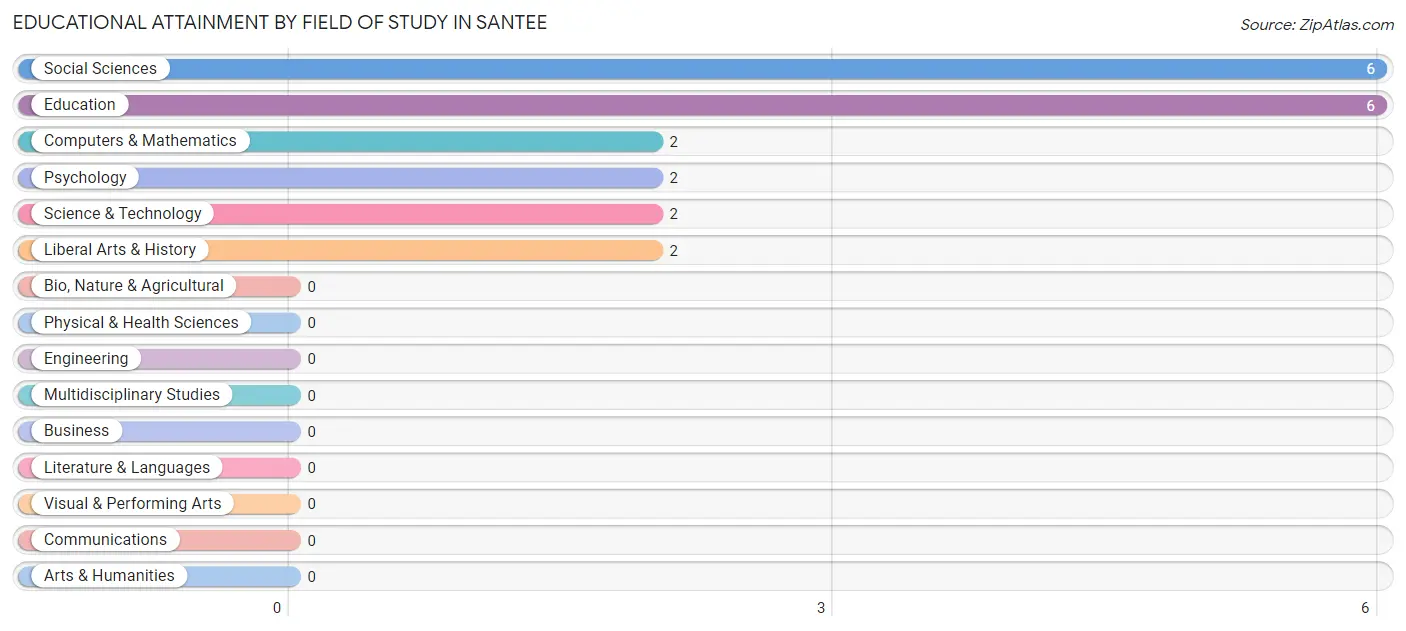
| Field of Study | # Graduates | % Graduates |
| Computers & Mathematics | 2 | 10.0% |
| Bio, Nature & Agricultural | 0 | 0.0% |
| Physical & Health Sciences | 0 | 0.0% |
| Psychology | 2 | 10.0% |
| Social Sciences | 6 | 30.0% |
| Engineering | 0 | 0.0% |
| Multidisciplinary Studies | 0 | 0.0% |
| Science & Technology | 2 | 10.0% |
| Business | 0 | 0.0% |
| Education | 6 | 30.0% |
| Literature & Languages | 0 | 0.0% |
| Liberal Arts & History | 2 | 10.0% |
| Visual & Performing Arts | 0 | 0.0% |
| Communications | 0 | 0.0% |
| Arts & Humanities | 0 | 0.0% |
| Total | 20 | 100.0% |
Transportation & Commute in Santee
Vehicle Availability by Sex in Santee
The most prevalent vehicle ownership categories in Santee are males with 1 vehicle (15, accounting for 38.5%) and females with 1 vehicle (20, making up 41.7%).
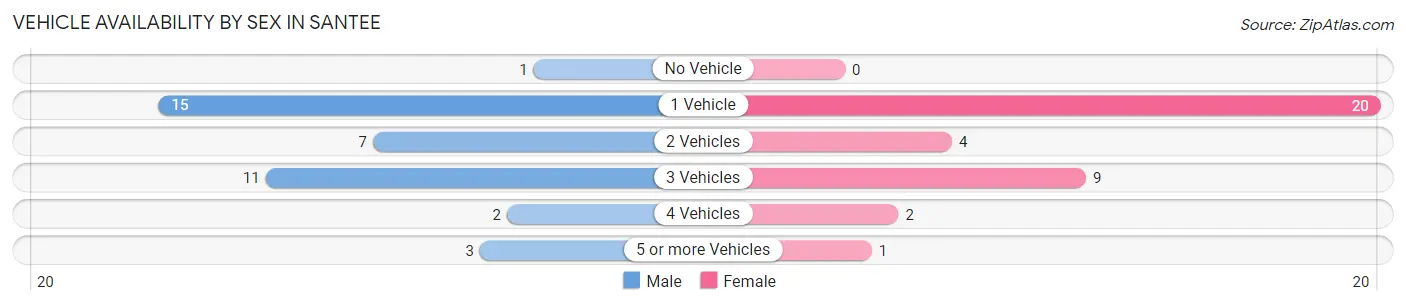
| Vehicles Available | Male | Female |
| No Vehicle | 1 (2.6%) | 0 (0.0%) |
| 1 Vehicle | 15 (38.5%) | 20 (55.6%) |
| 2 Vehicles | 7 (17.9%) | 4 (11.1%) |
| 3 Vehicles | 11 (28.2%) | 9 (25.0%) |
| 4 Vehicles | 2 (5.1%) | 2 (5.6%) |
| 5 or more Vehicles | 3 (7.7%) | 1 (2.8%) |
| Total | 39 (100.0%) | 36 (100.0%) |
Commute Time in Santee
The most frequently occuring commute durations in Santee are less than 5 minutes (36 commuters, 48.6%), 5 to 9 minutes (14 commuters, 18.9%), and 20 to 24 minutes (6 commuters, 8.1%).
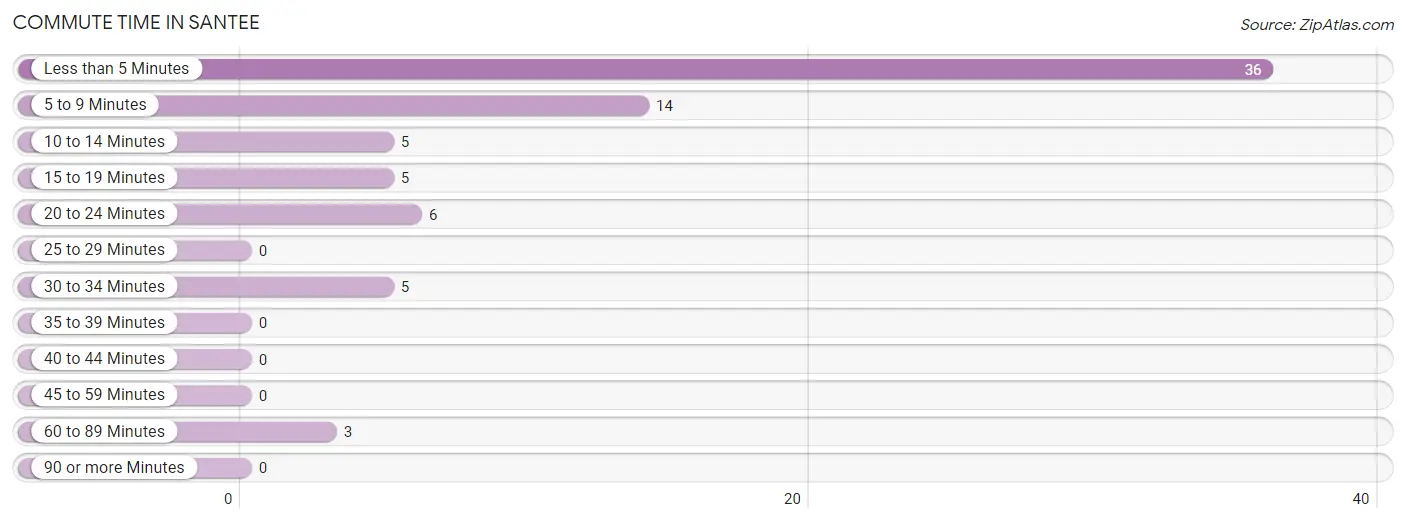
| Commute Time | # Commuters | % Commuters |
| Less than 5 Minutes | 36 | 48.6% |
| 5 to 9 Minutes | 14 | 18.9% |
| 10 to 14 Minutes | 5 | 6.8% |
| 15 to 19 Minutes | 5 | 6.8% |
| 20 to 24 Minutes | 6 | 8.1% |
| 25 to 29 Minutes | 0 | 0.0% |
| 30 to 34 Minutes | 5 | 6.8% |
| 35 to 39 Minutes | 0 | 0.0% |
| 40 to 44 Minutes | 0 | 0.0% |
| 45 to 59 Minutes | 0 | 0.0% |
| 60 to 89 Minutes | 3 | 4.1% |
| 90 or more Minutes | 0 | 0.0% |
Commute Time by Sex in Santee
The most common commute times in Santee are less than 5 minutes (20 commuters, 52.6%) for males and less than 5 minutes (16 commuters, 44.4%) for females.
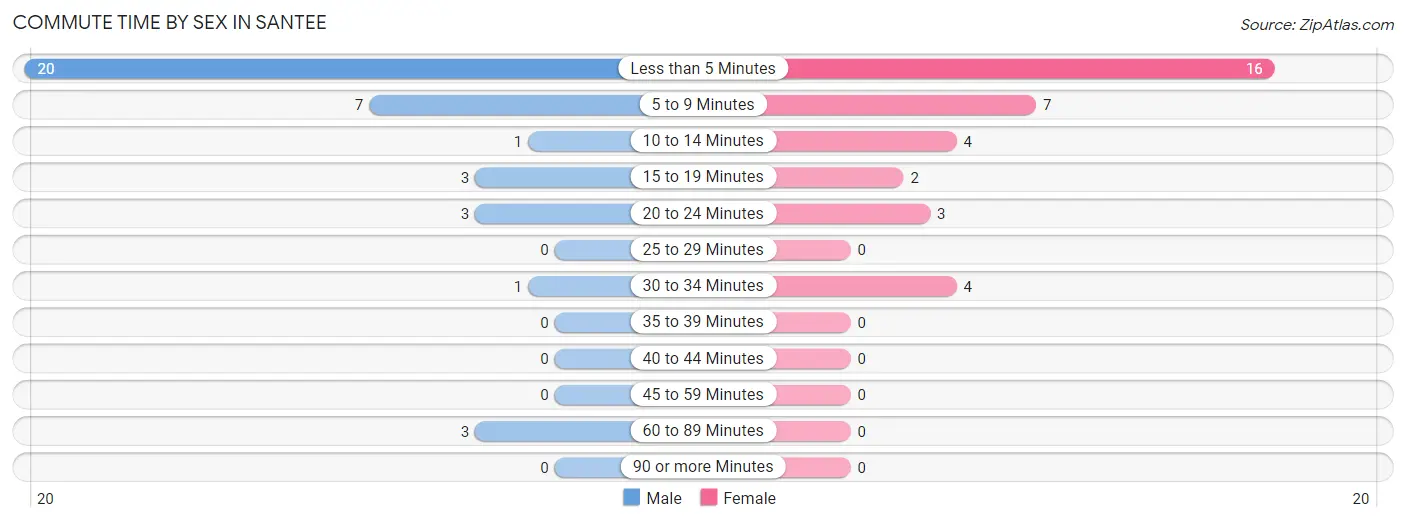
| Commute Time | Male | Female |
| Less than 5 Minutes | 20 (52.6%) | 16 (44.4%) |
| 5 to 9 Minutes | 7 (18.4%) | 7 (19.4%) |
| 10 to 14 Minutes | 1 (2.6%) | 4 (11.1%) |
| 15 to 19 Minutes | 3 (7.9%) | 2 (5.6%) |
| 20 to 24 Minutes | 3 (7.9%) | 3 (8.3%) |
| 25 to 29 Minutes | 0 (0.0%) | 0 (0.0%) |
| 30 to 34 Minutes | 1 (2.6%) | 4 (11.1%) |
| 35 to 39 Minutes | 0 (0.0%) | 0 (0.0%) |
| 40 to 44 Minutes | 0 (0.0%) | 0 (0.0%) |
| 45 to 59 Minutes | 0 (0.0%) | 0 (0.0%) |
| 60 to 89 Minutes | 3 (7.9%) | 0 (0.0%) |
| 90 or more Minutes | 0 (0.0%) | 0 (0.0%) |
Time of Departure to Work by Sex in Santee
The most frequent times of departure to work in Santee are 7:30 AM to 7:59 AM (11, 28.9%) for males and 7:30 AM to 7:59 AM (14, 38.9%) for females.
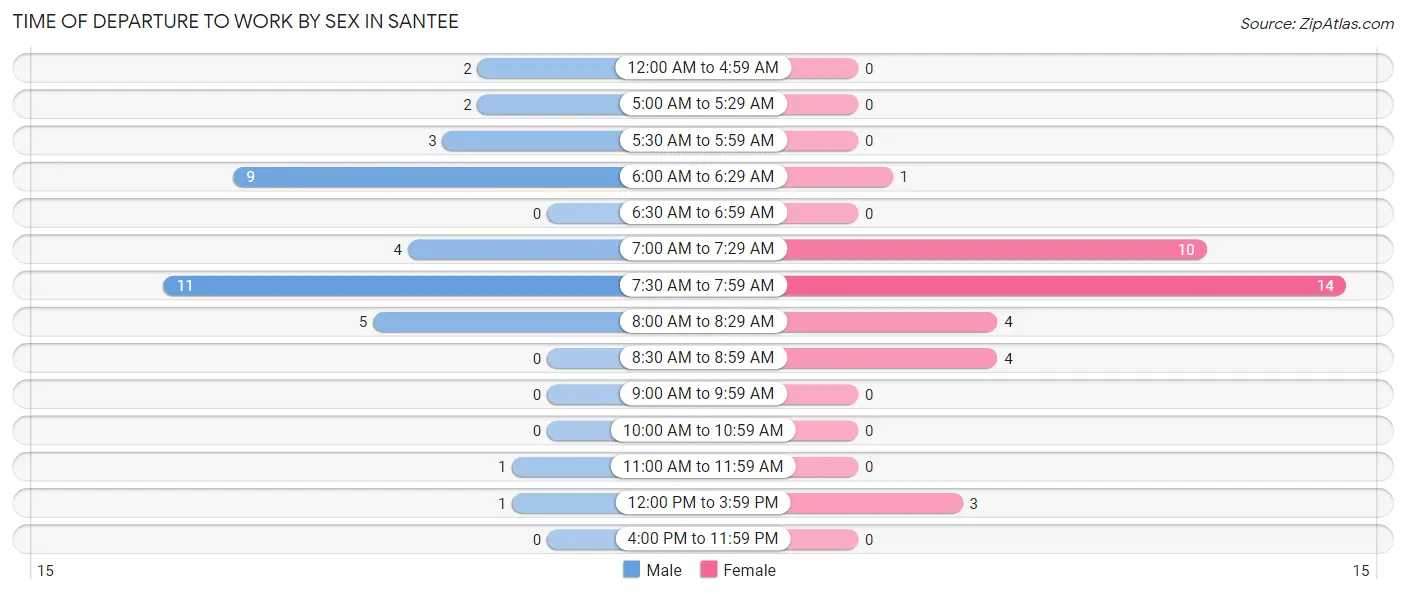
| Time of Departure | Male | Female |
| 12:00 AM to 4:59 AM | 2 (5.3%) | 0 (0.0%) |
| 5:00 AM to 5:29 AM | 2 (5.3%) | 0 (0.0%) |
| 5:30 AM to 5:59 AM | 3 (7.9%) | 0 (0.0%) |
| 6:00 AM to 6:29 AM | 9 (23.7%) | 1 (2.8%) |
| 6:30 AM to 6:59 AM | 0 (0.0%) | 0 (0.0%) |
| 7:00 AM to 7:29 AM | 4 (10.5%) | 10 (27.8%) |
| 7:30 AM to 7:59 AM | 11 (28.9%) | 14 (38.9%) |
| 8:00 AM to 8:29 AM | 5 (13.2%) | 4 (11.1%) |
| 8:30 AM to 8:59 AM | 0 (0.0%) | 4 (11.1%) |
| 9:00 AM to 9:59 AM | 0 (0.0%) | 0 (0.0%) |
| 10:00 AM to 10:59 AM | 0 (0.0%) | 0 (0.0%) |
| 11:00 AM to 11:59 AM | 1 (2.6%) | 0 (0.0%) |
| 12:00 PM to 3:59 PM | 1 (2.6%) | 3 (8.3%) |
| 4:00 PM to 11:59 PM | 0 (0.0%) | 0 (0.0%) |
| Total | 38 (100.0%) | 36 (100.0%) |
Housing Occupancy in Santee
Occupancy by Ownership in Santee
Of the total 74 dwellings in Santee, owner-occupied units account for 13 (17.6%), while renter-occupied units make up 61 (82.4%).
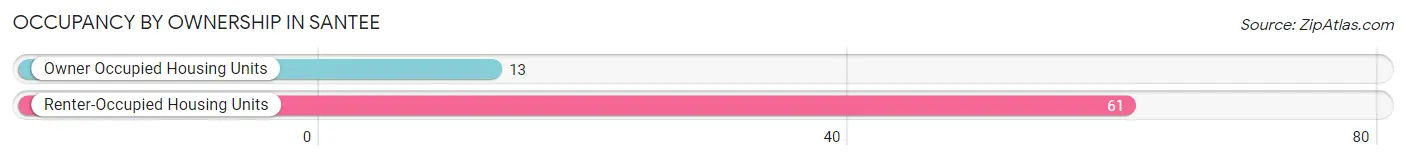
| Occupancy | # Housing Units | % Housing Units |
| Owner Occupied Housing Units | 13 | 17.6% |
| Renter-Occupied Housing Units | 61 | 82.4% |
| Total Occupied Housing Units | 74 | 100.0% |
Occupancy by Household Size in Santee
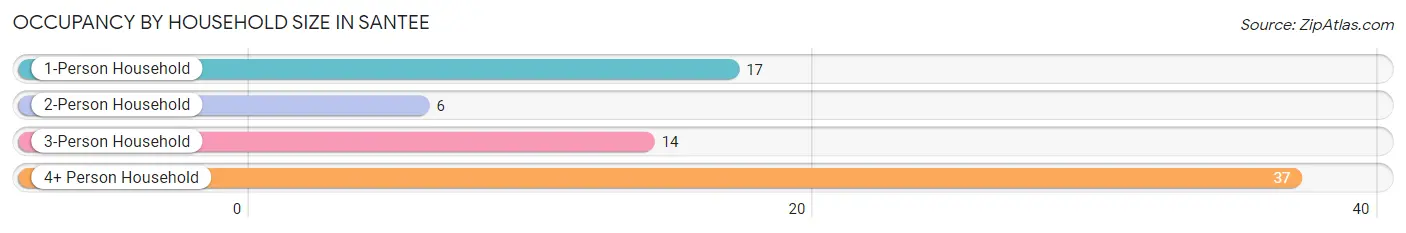
| Household Size | # Housing Units | % Housing Units |
| 1-Person Household | 17 | 23.0% |
| 2-Person Household | 6 | 8.1% |
| 3-Person Household | 14 | 18.9% |
| 4+ Person Household | 37 | 50.0% |
| Total Housing Units | 74 | 100.0% |
Occupancy by Ownership by Household Size in Santee
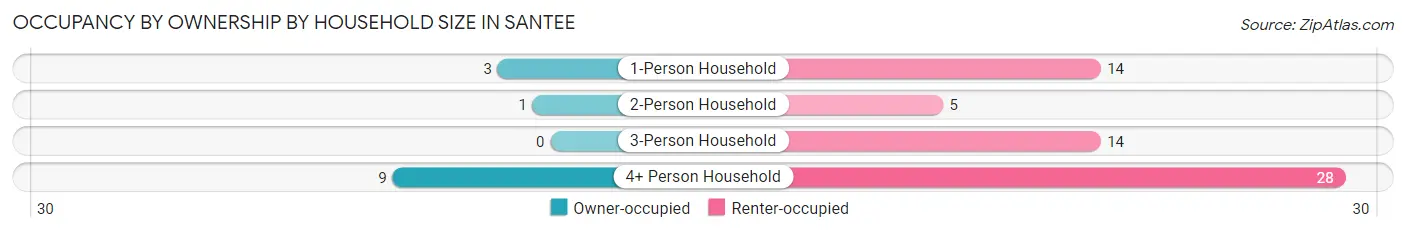
| Household Size | Owner-occupied | Renter-occupied |
| 1-Person Household | 3 (17.6%) | 14 (82.4%) |
| 2-Person Household | 1 (16.7%) | 5 (83.3%) |
| 3-Person Household | 0 (0.0%) | 14 (100.0%) |
| 4+ Person Household | 9 (24.3%) | 28 (75.7%) |
| Total Housing Units | 13 (17.6%) | 61 (82.4%) |
Occupancy by Educational Attainment in Santee
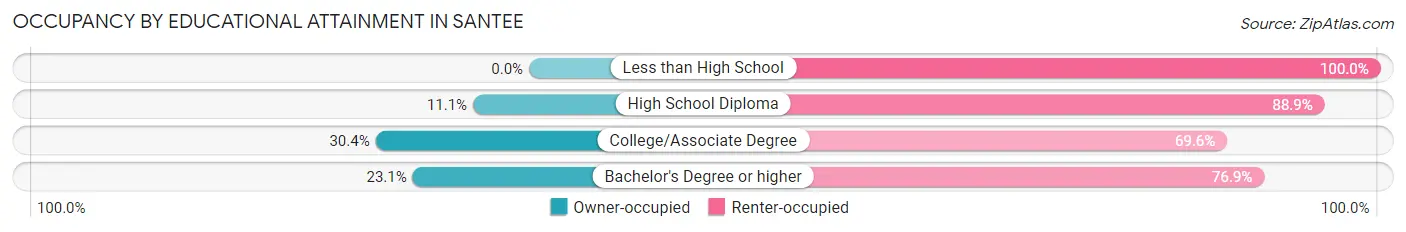
| Household Size | Owner-occupied | Renter-occupied |
| Less than High School | 0 (0.0%) | 11 (100.0%) |
| High School Diploma | 3 (11.1%) | 24 (88.9%) |
| College/Associate Degree | 7 (30.4%) | 16 (69.6%) |
| Bachelor's Degree or higher | 3 (23.1%) | 10 (76.9%) |
Occupancy by Age of Householder in Santee
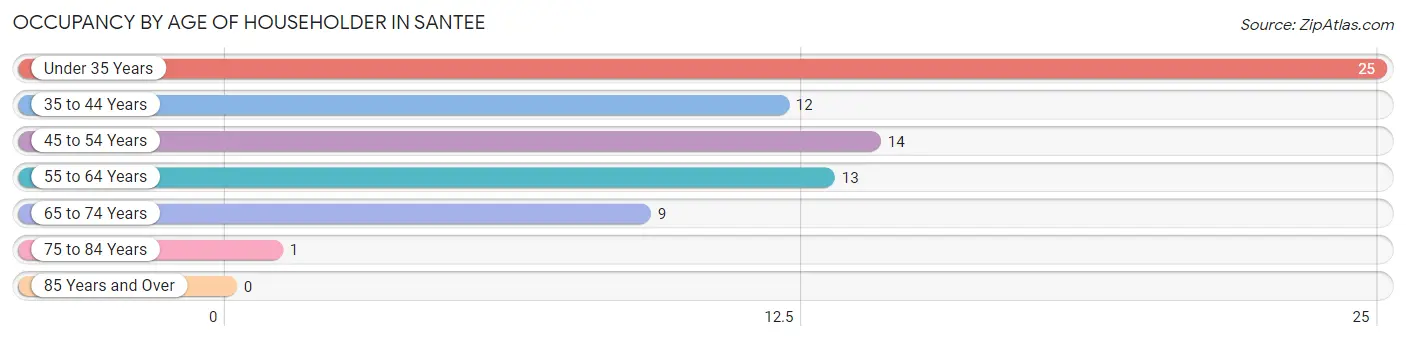
| Age Bracket | # Households | % Households |
| Under 35 Years | 25 | 33.8% |
| 35 to 44 Years | 12 | 16.2% |
| 45 to 54 Years | 14 | 18.9% |
| 55 to 64 Years | 13 | 17.6% |
| 65 to 74 Years | 9 | 12.2% |
| 75 to 84 Years | 1 | 1.3% |
| 85 Years and Over | 0 | 0.0% |
| Total | 74 | 100.0% |
Housing Finances in Santee
Median Income by Occupancy in Santee
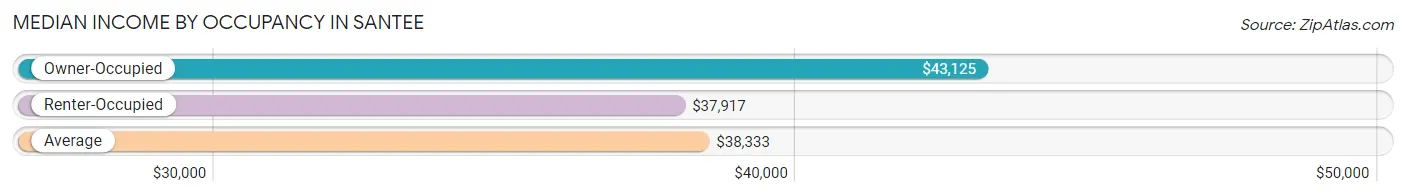
| Occupancy Type | # Households | Median Income |
| Owner-Occupied | 13 (17.6%) | $43,125 |
| Renter-Occupied | 61 (82.4%) | $37,917 |
| Average | 74 (100.0%) | $38,333 |
Occupancy by Householder Income Bracket in Santee
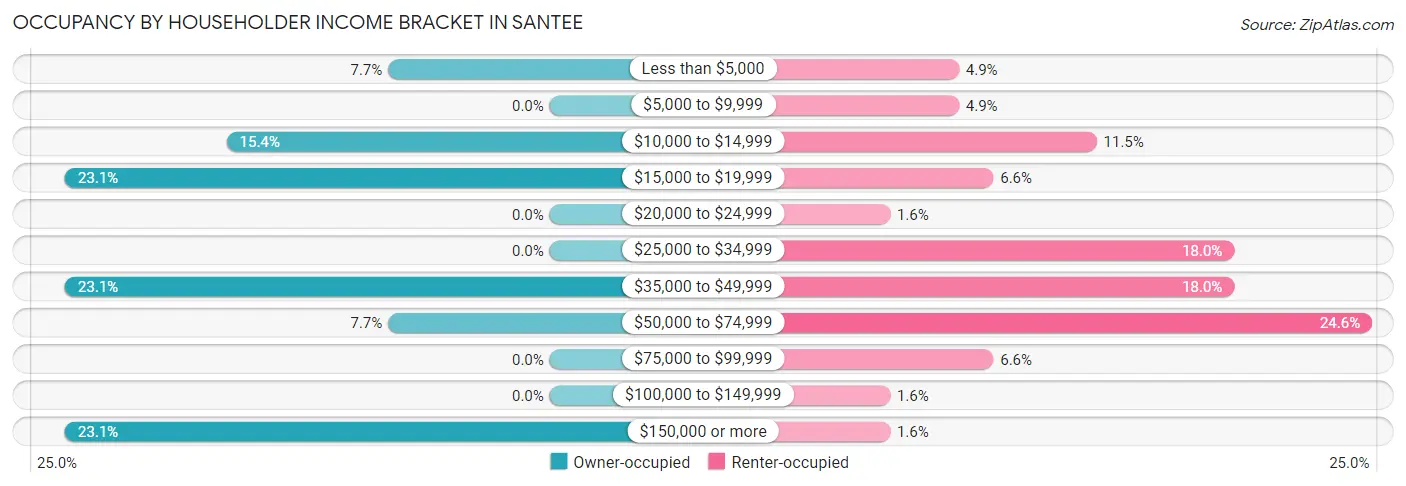
| Income Bracket | Owner-occupied | Renter-occupied |
| Less than $5,000 | 1 (7.7%) | 3 (4.9%) |
| $5,000 to $9,999 | 0 (0.0%) | 3 (4.9%) |
| $10,000 to $14,999 | 2 (15.4%) | 7 (11.5%) |
| $15,000 to $19,999 | 3 (23.1%) | 4 (6.6%) |
| $20,000 to $24,999 | 0 (0.0%) | 1 (1.6%) |
| $25,000 to $34,999 | 0 (0.0%) | 11 (18.0%) |
| $35,000 to $49,999 | 3 (23.1%) | 11 (18.0%) |
| $50,000 to $74,999 | 1 (7.7%) | 15 (24.6%) |
| $75,000 to $99,999 | 0 (0.0%) | 4 (6.6%) |
| $100,000 to $149,999 | 0 (0.0%) | 1 (1.6%) |
| $150,000 or more | 3 (23.1%) | 1 (1.6%) |
| Total | 13 (100.0%) | 61 (100.0%) |
Monthly Housing Cost Tiers in Santee
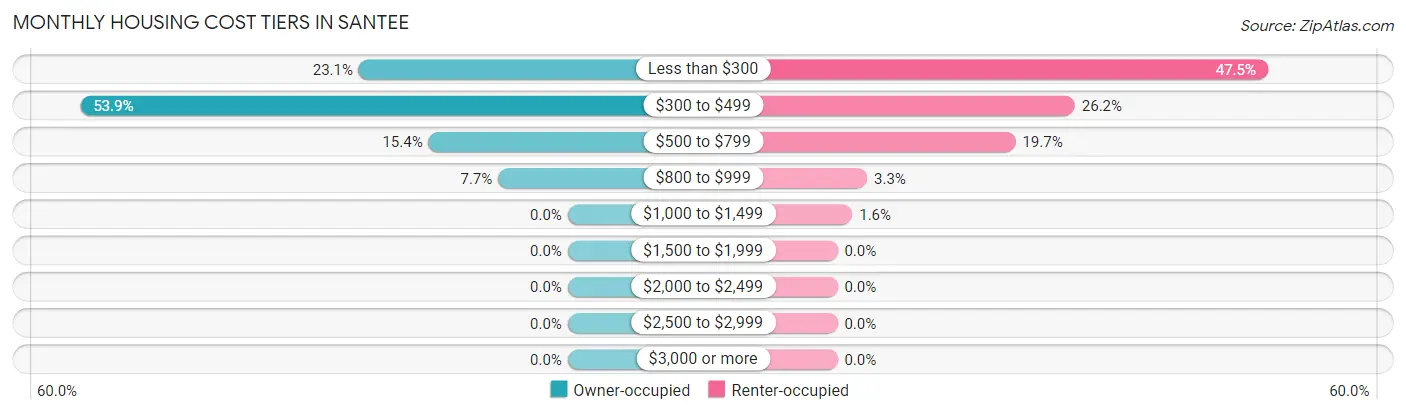
| Monthly Cost | Owner-occupied | Renter-occupied |
| Less than $300 | 3 (23.1%) | 29 (47.5%) |
| $300 to $499 | 7 (53.8%) | 16 (26.2%) |
| $500 to $799 | 2 (15.4%) | 12 (19.7%) |
| $800 to $999 | 1 (7.7%) | 2 (3.3%) |
| $1,000 to $1,499 | 0 (0.0%) | 1 (1.6%) |
| $1,500 to $1,999 | 0 (0.0%) | 0 (0.0%) |
| $2,000 to $2,499 | 0 (0.0%) | 0 (0.0%) |
| $2,500 to $2,999 | 0 (0.0%) | 0 (0.0%) |
| $3,000 or more | 0 (0.0%) | 0 (0.0%) |
| Total | 13 (100.0%) | 61 (100.0%) |
Physical Housing Characteristics in Santee
Housing Structures in Santee
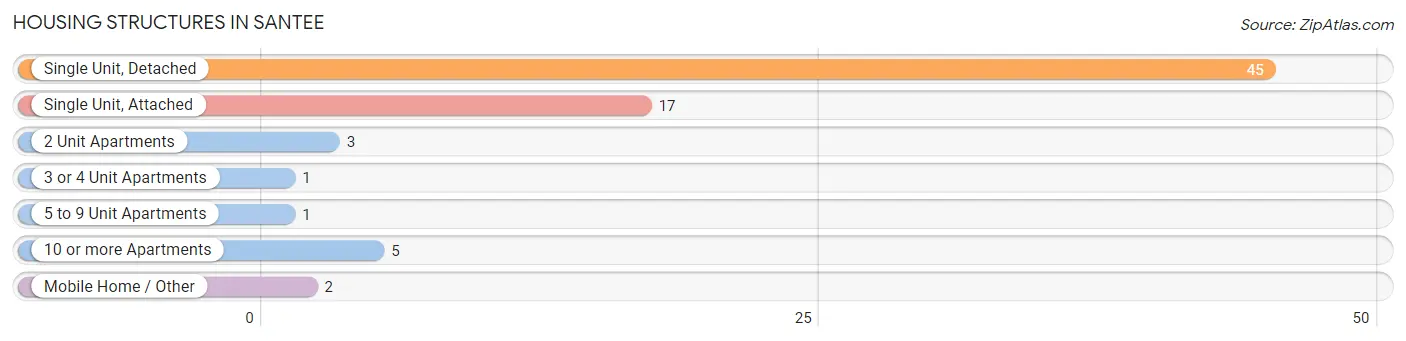
| Structure Type | # Housing Units | % Housing Units |
| Single Unit, Detached | 45 | 60.8% |
| Single Unit, Attached | 17 | 23.0% |
| 2 Unit Apartments | 3 | 4.1% |
| 3 or 4 Unit Apartments | 1 | 1.3% |
| 5 to 9 Unit Apartments | 1 | 1.3% |
| 10 or more Apartments | 5 | 6.8% |
| Mobile Home / Other | 2 | 2.7% |
| Total | 74 | 100.0% |
Housing Structures by Occupancy in Santee
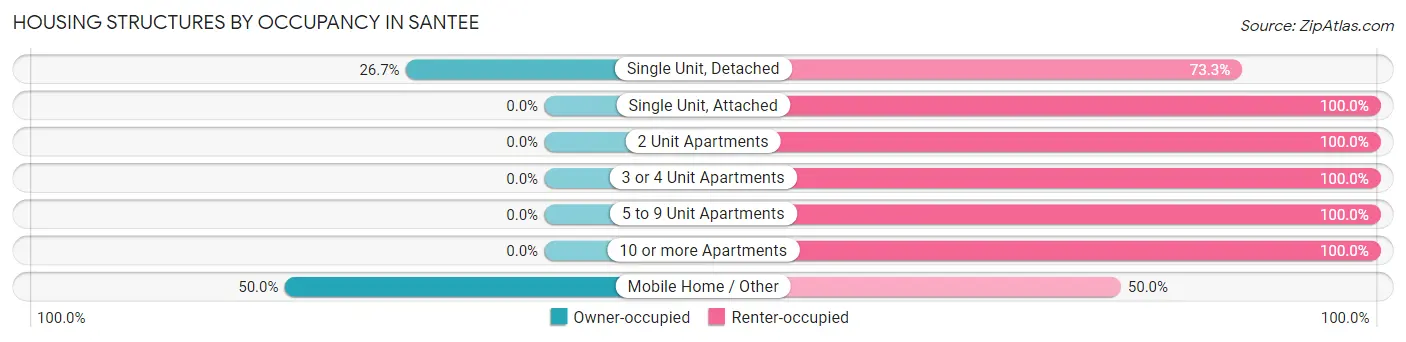
| Structure Type | Owner-occupied | Renter-occupied |
| Single Unit, Detached | 12 (26.7%) | 33 (73.3%) |
| Single Unit, Attached | 0 (0.0%) | 17 (100.0%) |
| 2 Unit Apartments | 0 (0.0%) | 3 (100.0%) |
| 3 or 4 Unit Apartments | 0 (0.0%) | 1 (100.0%) |
| 5 to 9 Unit Apartments | 0 (0.0%) | 1 (100.0%) |
| 10 or more Apartments | 0 (0.0%) | 5 (100.0%) |
| Mobile Home / Other | 1 (50.0%) | 1 (50.0%) |
| Total | 13 (17.6%) | 61 (82.4%) |
Housing Structures by Number of Rooms in Santee
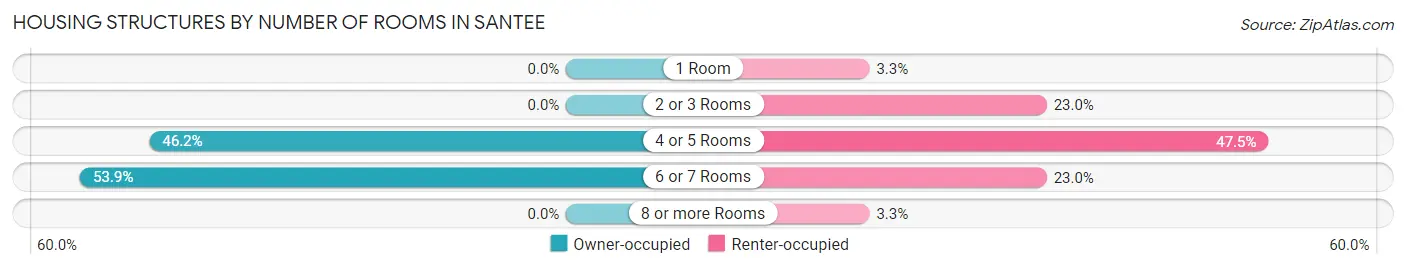
| Number of Rooms | Owner-occupied | Renter-occupied |
| 1 Room | 0 (0.0%) | 2 (3.3%) |
| 2 or 3 Rooms | 0 (0.0%) | 14 (23.0%) |
| 4 or 5 Rooms | 6 (46.2%) | 29 (47.5%) |
| 6 or 7 Rooms | 7 (53.8%) | 14 (23.0%) |
| 8 or more Rooms | 0 (0.0%) | 2 (3.3%) |
| Total | 13 (100.0%) | 61 (100.0%) |
Housing Structure by Heating Type in Santee
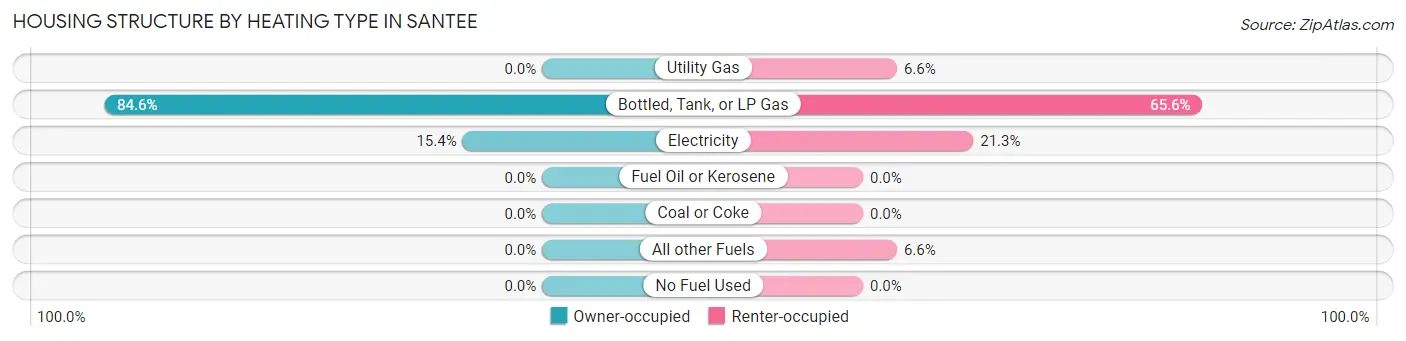
| Heating Type | Owner-occupied | Renter-occupied |
| Utility Gas | 0 (0.0%) | 4 (6.6%) |
| Bottled, Tank, or LP Gas | 11 (84.6%) | 40 (65.6%) |
| Electricity | 2 (15.4%) | 13 (21.3%) |
| Fuel Oil or Kerosene | 0 (0.0%) | 0 (0.0%) |
| Coal or Coke | 0 (0.0%) | 0 (0.0%) |
| All other Fuels | 0 (0.0%) | 4 (6.6%) |
| No Fuel Used | 0 (0.0%) | 0 (0.0%) |
| Total | 13 (100.0%) | 61 (100.0%) |
Household Vehicle Usage in Santee
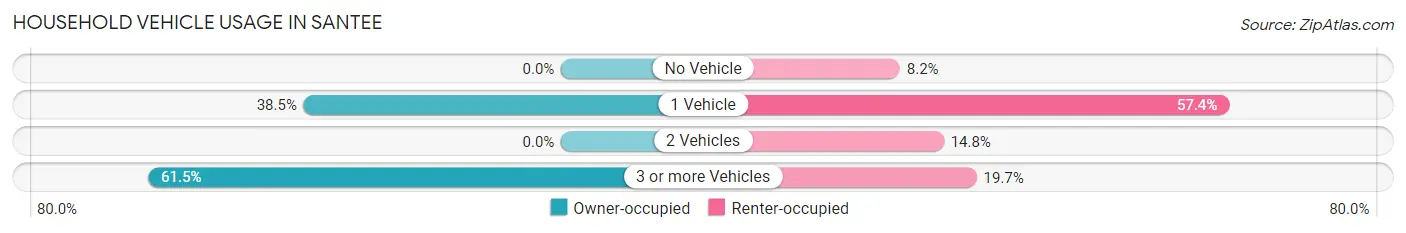
| Vehicles per Household | Owner-occupied | Renter-occupied |
| No Vehicle | 0 (0.0%) | 5 (8.2%) |
| 1 Vehicle | 5 (38.5%) | 35 (57.4%) |
| 2 Vehicles | 0 (0.0%) | 9 (14.7%) |
| 3 or more Vehicles | 8 (61.5%) | 12 (19.7%) |
| Total | 13 (100.0%) | 61 (100.0%) |
Real Estate & Mortgages in Santee
Real Estate and Mortgage Overview in Santee
| Characteristic | Without Mortgage | With Mortgage |
| Housing Units | 10 | 3 |
| Median Property Value | $42,500 | $0 |
| Median Household Income | $46,250 | $0 |
| Monthly Housing Costs | - | - |
| Real Estate Taxes | - | - |
Property Value by Mortgage Status in Santee
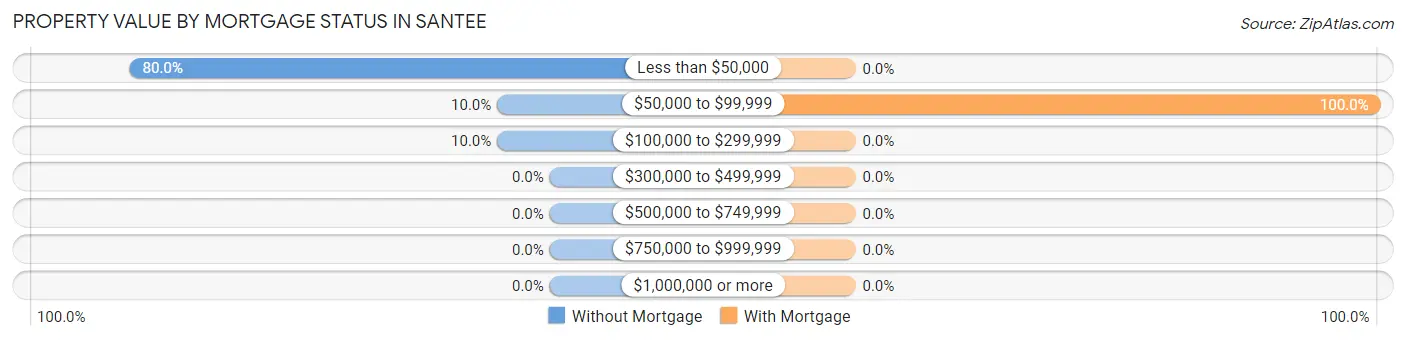
| Property Value | Without Mortgage | With Mortgage |
| Less than $50,000 | 8 (80.0%) | 0 (0.0%) |
| $50,000 to $99,999 | 1 (10.0%) | 3 (100.0%) |
| $100,000 to $299,999 | 1 (10.0%) | 0 (0.0%) |
| $300,000 to $499,999 | 0 (0.0%) | 0 (0.0%) |
| $500,000 to $749,999 | 0 (0.0%) | 0 (0.0%) |
| $750,000 to $999,999 | 0 (0.0%) | 0 (0.0%) |
| $1,000,000 or more | 0 (0.0%) | 0 (0.0%) |
| Total | 10 (100.0%) | 3 (100.0%) |
Household Income by Mortgage Status in Santee
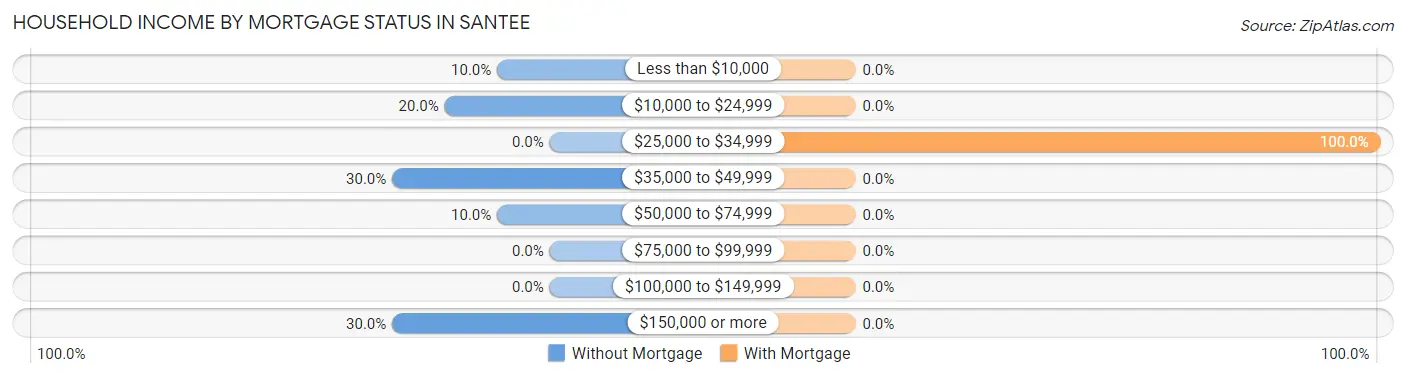
| Household Income | Without Mortgage | With Mortgage |
| Less than $10,000 | 1 (10.0%) | 0 (0.0%) |
| $10,000 to $24,999 | 2 (20.0%) | 0 (0.0%) |
| $25,000 to $34,999 | 0 (0.0%) | 3 (100.0%) |
| $35,000 to $49,999 | 3 (30.0%) | 0 (0.0%) |
| $50,000 to $74,999 | 1 (10.0%) | 0 (0.0%) |
| $75,000 to $99,999 | 0 (0.0%) | 0 (0.0%) |
| $100,000 to $149,999 | 0 (0.0%) | 0 (0.0%) |
| $150,000 or more | 3 (30.0%) | 0 (0.0%) |
| Total | 10 (100.0%) | 3 (100.0%) |
Property Value to Household Income Ratio in Santee
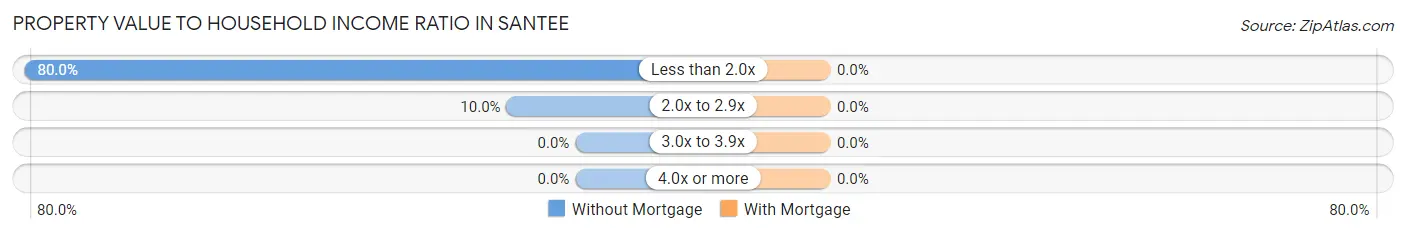
| Value-to-Income Ratio | Without Mortgage | With Mortgage |
| Less than 2.0x | 8 (80.0%) | 0 (0.0%) |
| 2.0x to 2.9x | 1 (10.0%) | 0 (0.0%) |
| 3.0x to 3.9x | 0 (0.0%) | 0 (0.0%) |
| 4.0x or more | 0 (0.0%) | 0 (0.0%) |
| Total | 10 (100.0%) | 3 (100.0%) |
Real Estate Taxes by Mortgage Status in Santee
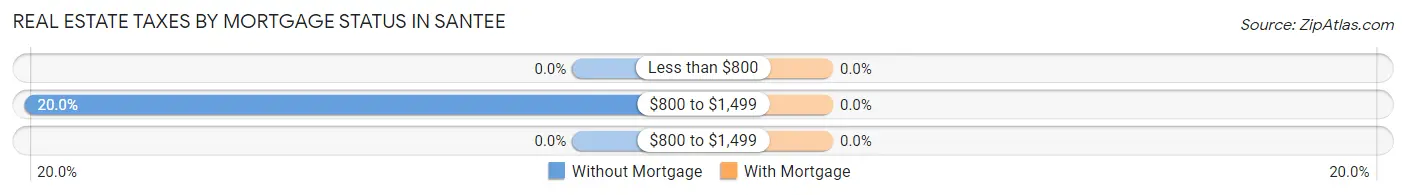
| Property Taxes | Without Mortgage | With Mortgage |
| Less than $800 | 0 (0.0%) | 0 (0.0%) |
| $800 to $1,499 | 2 (20.0%) | 0 (0.0%) |
| $800 to $1,499 | 0 (0.0%) | 0 (0.0%) |
| Total | 10 (100.0%) | 3 (100.0%) |
Health & Disability in Santee
Health Insurance Coverage by Age in Santee
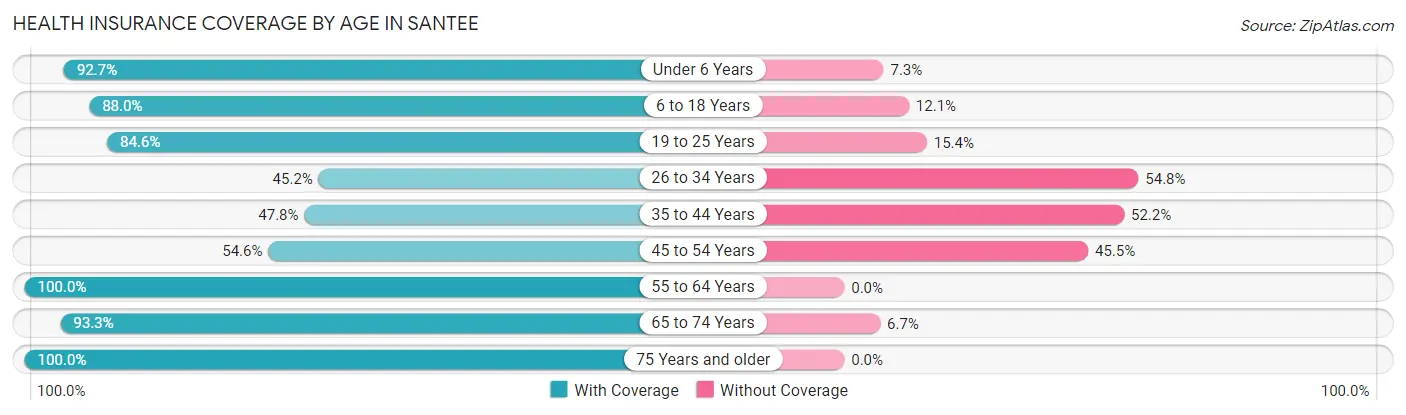
| Age Bracket | With Coverage | Without Coverage |
| Under 6 Years | 38 (92.7%) | 3 (7.3%) |
| 6 to 18 Years | 73 (87.9%) | 10 (12.0%) |
| 19 to 25 Years | 22 (84.6%) | 4 (15.4%) |
| 26 to 34 Years | 14 (45.2%) | 17 (54.8%) |
| 35 to 44 Years | 11 (47.8%) | 12 (52.2%) |
| 45 to 54 Years | 12 (54.5%) | 10 (45.5%) |
| 55 to 64 Years | 17 (100.0%) | 0 (0.0%) |
| 65 to 74 Years | 14 (93.3%) | 1 (6.7%) |
| 75 Years and older | 4 (100.0%) | 0 (0.0%) |
| Total | 205 (78.2%) | 57 (21.8%) |
Health Insurance Coverage by Citizenship Status in Santee
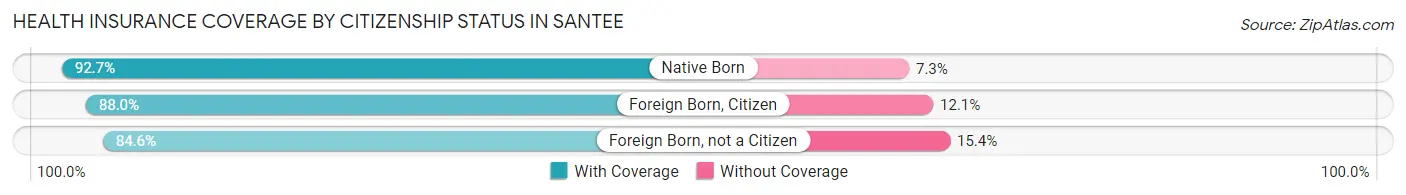
| Citizenship Status | With Coverage | Without Coverage |
| Native Born | 38 (92.7%) | 3 (7.3%) |
| Foreign Born, Citizen | 73 (87.9%) | 10 (12.0%) |
| Foreign Born, not a Citizen | 22 (84.6%) | 4 (15.4%) |
Health Insurance Coverage by Household Income in Santee
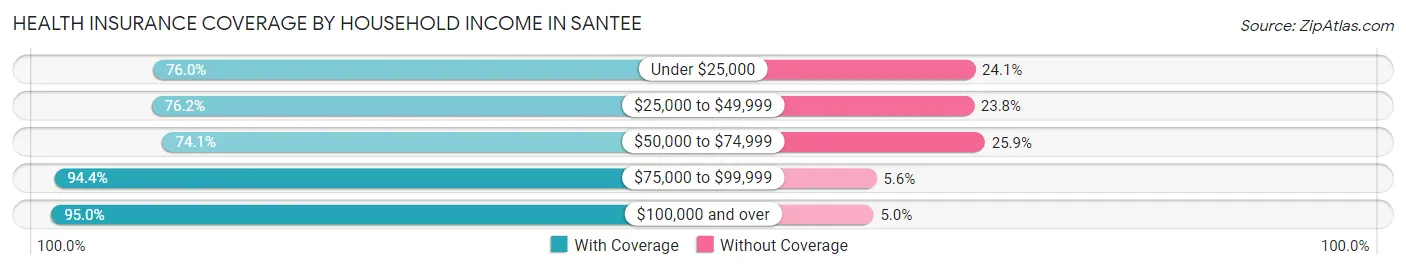
| Household Income | With Coverage | Without Coverage |
| Under $25,000 | 60 (75.9%) | 19 (24.0%) |
| $25,000 to $49,999 | 64 (76.2%) | 20 (23.8%) |
| $50,000 to $74,999 | 43 (74.1%) | 15 (25.9%) |
| $75,000 to $99,999 | 17 (94.4%) | 1 (5.6%) |
| $100,000 and over | 19 (95.0%) | 1 (5.0%) |
Public vs Private Health Insurance Coverage by Age in Santee
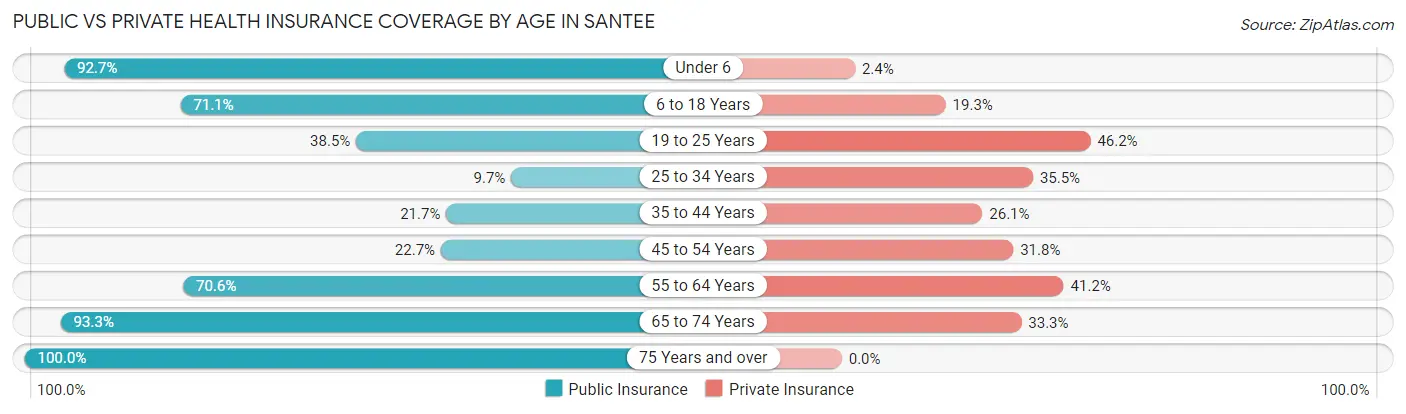
| Age Bracket | Public Insurance | Private Insurance |
| Under 6 | 38 (92.7%) | 1 (2.4%) |
| 6 to 18 Years | 59 (71.1%) | 16 (19.3%) |
| 19 to 25 Years | 10 (38.5%) | 12 (46.2%) |
| 25 to 34 Years | 3 (9.7%) | 11 (35.5%) |
| 35 to 44 Years | 5 (21.7%) | 6 (26.1%) |
| 45 to 54 Years | 5 (22.7%) | 7 (31.8%) |
| 55 to 64 Years | 12 (70.6%) | 7 (41.2%) |
| 65 to 74 Years | 14 (93.3%) | 5 (33.3%) |
| 75 Years and over | 4 (100.0%) | 0 (0.0%) |
| Total | 150 (57.3%) | 65 (24.8%) |
Disability Status by Sex by Age in Santee
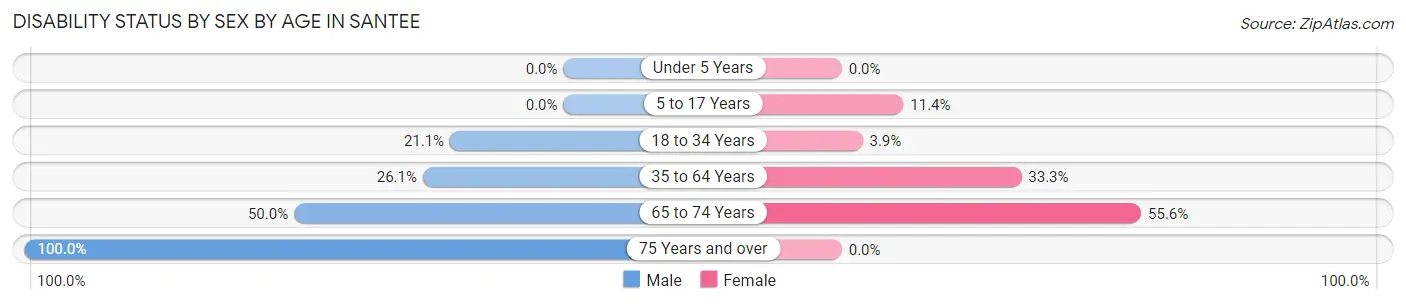
| Age Bracket | Male | Female |
| Under 5 Years | 0 (0.0%) | 0 (0.0%) |
| 5 to 17 Years | 0 (0.0%) | 4 (11.4%) |
| 18 to 34 Years | 8 (21.0%) | 1 (3.8%) |
| 35 to 64 Years | 6 (26.1%) | 13 (33.3%) |
| 65 to 74 Years | 3 (50.0%) | 5 (55.6%) |
| 75 Years and over | 3 (100.0%) | 0 (0.0%) |
Disability Class by Sex by Age in Santee
Disability Class: Hearing Difficulty
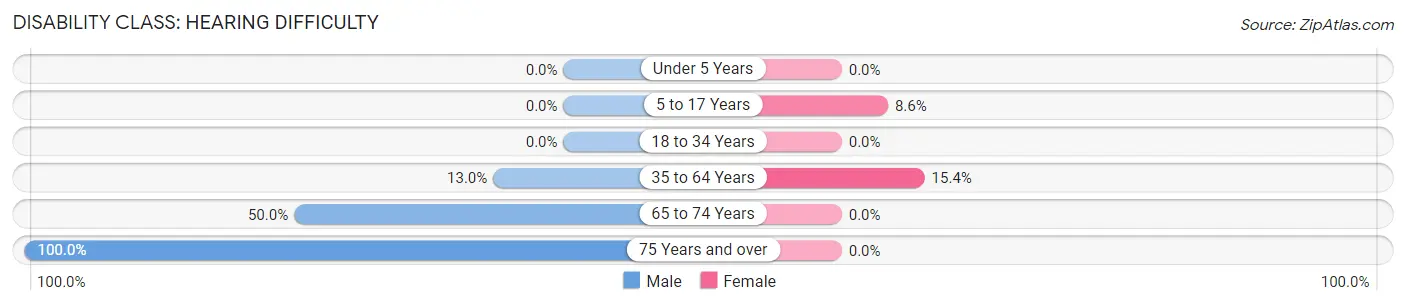
| Age Bracket | Male | Female |
| Under 5 Years | 0 (0.0%) | 0 (0.0%) |
| 5 to 17 Years | 0 (0.0%) | 3 (8.6%) |
| 18 to 34 Years | 0 (0.0%) | 0 (0.0%) |
| 35 to 64 Years | 3 (13.0%) | 6 (15.4%) |
| 65 to 74 Years | 3 (50.0%) | 0 (0.0%) |
| 75 Years and over | 3 (100.0%) | 0 (0.0%) |
Disability Class: Vision Difficulty
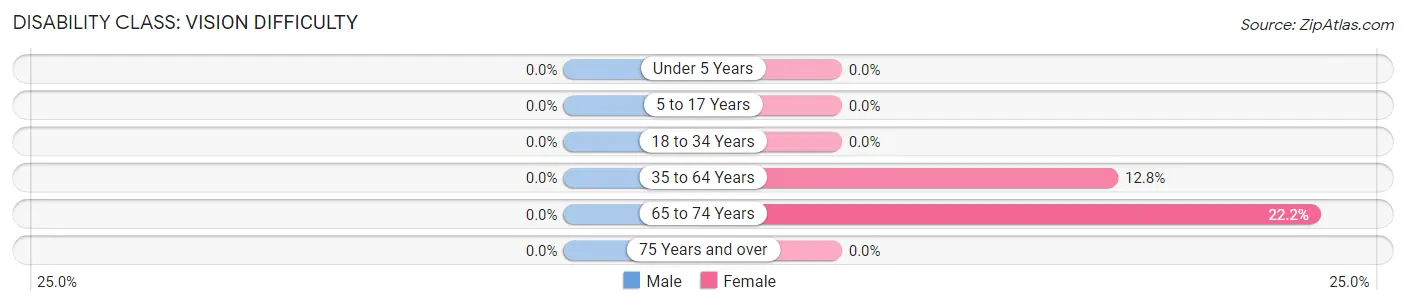
| Age Bracket | Male | Female |
| Under 5 Years | 0 (0.0%) | 0 (0.0%) |
| 5 to 17 Years | 0 (0.0%) | 0 (0.0%) |
| 18 to 34 Years | 0 (0.0%) | 0 (0.0%) |
| 35 to 64 Years | 0 (0.0%) | 5 (12.8%) |
| 65 to 74 Years | 0 (0.0%) | 2 (22.2%) |
| 75 Years and over | 0 (0.0%) | 0 (0.0%) |
Disability Class: Cognitive Difficulty
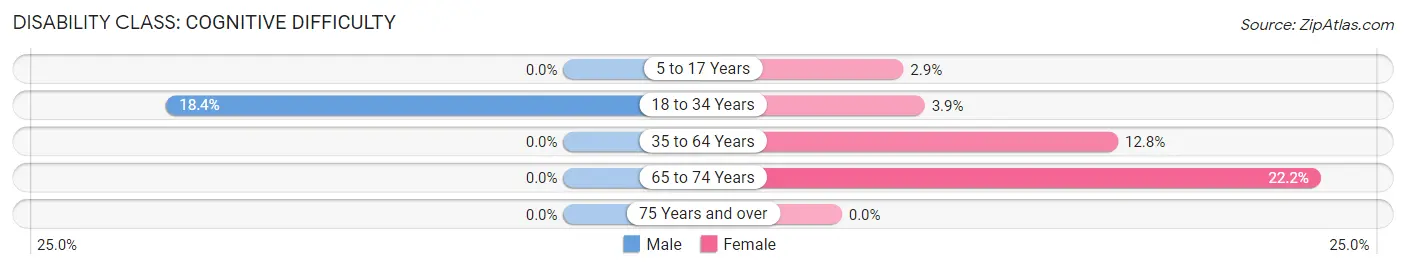
| Age Bracket | Male | Female |
| 5 to 17 Years | 0 (0.0%) | 1 (2.9%) |
| 18 to 34 Years | 7 (18.4%) | 1 (3.8%) |
| 35 to 64 Years | 0 (0.0%) | 5 (12.8%) |
| 65 to 74 Years | 0 (0.0%) | 2 (22.2%) |
| 75 Years and over | 0 (0.0%) | 0 (0.0%) |
Disability Class: Ambulatory Difficulty
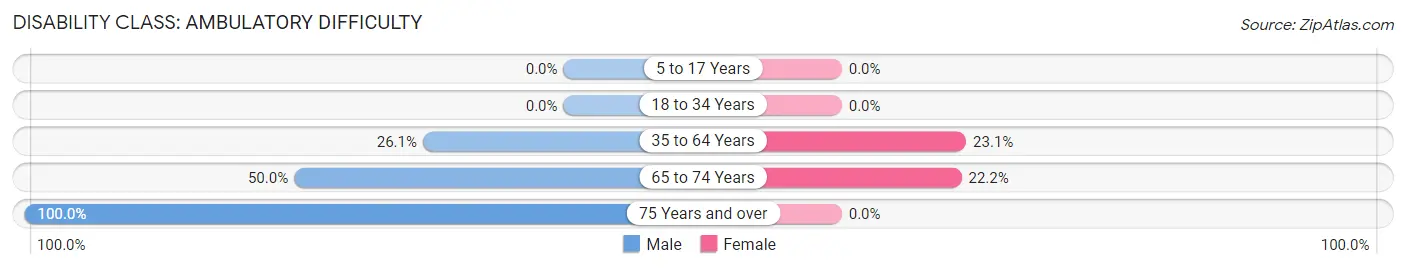
| Age Bracket | Male | Female |
| 5 to 17 Years | 0 (0.0%) | 0 (0.0%) |
| 18 to 34 Years | 0 (0.0%) | 0 (0.0%) |
| 35 to 64 Years | 6 (26.1%) | 9 (23.1%) |
| 65 to 74 Years | 3 (50.0%) | 2 (22.2%) |
| 75 Years and over | 3 (100.0%) | 0 (0.0%) |
Disability Class: Self-Care Difficulty
| Age Bracket | Male | Female |
| 5 to 17 Years | 0 (0.0%) | 0 (0.0%) |
| 18 to 34 Years | 0 (0.0%) | 0 (0.0%) |
| 35 to 64 Years | 1 (4.3%) | 5 (12.8%) |
| 65 to 74 Years | 0 (0.0%) | 0 (0.0%) |
| 75 Years and over | 3 (100.0%) | 0 (0.0%) |
Technology Access in Santee
Computing Device Access in Santee
| Device Type | # Households | % Households |
| Desktop or Laptop | 37 | 50.0% |
| Smartphone | 62 | 83.8% |
| Tablet | 38 | 51.3% |
| No Computing Device | 9 | 12.2% |
| Total | 74 | 100.0% |
Internet Access in Santee
| Internet Type | # Households | % Households |
| Dial-Up Internet | 0 | 0.0% |
| Broadband Home | 21 | 28.4% |
| Cellular Data Only | 15 | 20.3% |
| Satellite Internet | 23 | 31.1% |
| No Internet | 14 | 18.9% |
| Total | 74 | 100.0% |
Santee Summary
Santee is a small town located in the northeastern corner of Nebraska, in the United States. It is situated in the Santee Sioux Reservation, which is part of the Omaha Indian Reservation. The town is located in the county of Knox, and is part of the Sioux City, Iowa metropolitan area. Santee is home to a population of approximately 1,000 people, and is the largest town in the reservation.
History
The Santee Sioux Reservation was established in 1858, when the United States government signed a treaty with the Santee Sioux Tribe. The treaty granted the tribe a reservation of over 1.5 million acres of land in the northeastern corner of Nebraska. The reservation was originally intended to be a permanent home for the Santee Sioux, but the tribe was eventually forced to move to the Omaha Indian Reservation in 1882.
The town of Santee was established in 1883, when the Santee Sioux Tribe was relocated to the Omaha Indian Reservation. The town was named after the Santee Sioux Tribe, and was intended to be a trading post for the tribe. The town quickly grew, and by the early 1900s, it had become a bustling center of commerce and industry.
Geography
Santee is located in the northeastern corner of Nebraska, in the United States. It is situated in the Santee Sioux Reservation, which is part of the Omaha Indian Reservation. The town is located in the county of Knox, and is part of the Sioux City, Iowa metropolitan area. Santee is located at an elevation of 1,845 feet above sea level.
The town is situated on the banks of the Missouri River, and is surrounded by rolling hills and prairies. The climate in Santee is generally mild, with hot summers and cold winters. The average annual temperature is around 50 degrees Fahrenheit.
Economy
The economy of Santee is largely based on agriculture and tourism. The town is home to several farms, which produce a variety of crops, including corn, soybeans, and wheat. The town is also home to several tourist attractions, including the Santee Sioux Museum, the Santee Sioux National Historic Site, and the Santee Sioux Cultural Center.
The town is also home to several businesses, including restaurants, retail stores, and service providers. The town is served by the Santee Sioux Airport, which provides air transportation to and from the town.
Demographics
As of the 2010 census, the population of Santee was 1,000 people. The racial makeup of the town was 95.2% Native American, 2.2% White, 0.2% African American, 0.2% Asian, and 2.2% from other races. The median household income in Santee was $25,000, and the median family income was $30,000. The per capita income in Santee was $13,000.
Conclusion
Santee is a small town located in the northeastern corner of Nebraska, in the United States. It is situated in the Santee Sioux Reservation, which is part of the Omaha Indian Reservation. The town is home to a population of approximately 1,000 people, and is the largest town in the reservation. The economy of Santee is largely based on agriculture and tourism, and the town is home to several tourist attractions. The racial makeup of the town is 95.2% Native American, 2.2% White, 0.2% African American, 0.2% Asian, and 2.2% from other races. The median household income in Santee was $25,000, and the median family income was $30,000.
Common Questions
What is Per Capita Income in Santee?
Per Capita income in Santee is $13,870.
What is the Median Family Income in Santee?
Median Family Income in Santee is $31,250.
What is the Median Household income in Santee?
Median Household Income in Santee is $38,333.
What is Income or Wage Gap in Santee?
Income or Wage Gap in Santee is 1.0%.
Women in Santee earn 99.0 cents for every dollar earned by a man.
What is Family Income Deficit in Santee?
Family Income Deficit in Santee is $15,063.
Families that are below poverty line in Santee earn $15,063 less on average than the poverty threshold level.
What is Inequality or Gini Index in Santee?
Inequality or Gini Index in Santee is 0.45.
What is the Total Population of Santee?
Total Population of Santee is 262.
What is the Total Male Population of Santee?
Total Male Population of Santee is 136.
What is the Total Female Population of Santee?
Total Female Population of Santee is 126.
What is the Ratio of Males per 100 Females in Santee?
There are 107.94 Males per 100 Females in Santee.
What is the Ratio of Females per 100 Males in Santee?
There are 92.65 Females per 100 Males in Santee.
What is the Median Population Age in Santee?
Median Population Age in Santee is 20.9 Years.
What is the Average Family Size in Santee
Average Family Size in Santee is 4.0 People.
What is the Average Household Size in Santee
Average Household Size in Santee is 3.5 People.
How Large is the Labor Force in Santee?
There are 101 People in the Labor Forcein in Santee.
What is the Percentage of People in the Labor Force in Santee?
64.3% of People are in the Labor Force in Santee.
What is the Unemployment Rate in Santee?
Unemployment Rate in Santee is 23.8%.