Zip Codes with the Highest Percentage of Population Employed in Accommodation & Food Services in Bozeman, MT
RELATED REPORTS & OPTIONS
Accommodation & Food Services
Bozeman
Compare Zip Codes
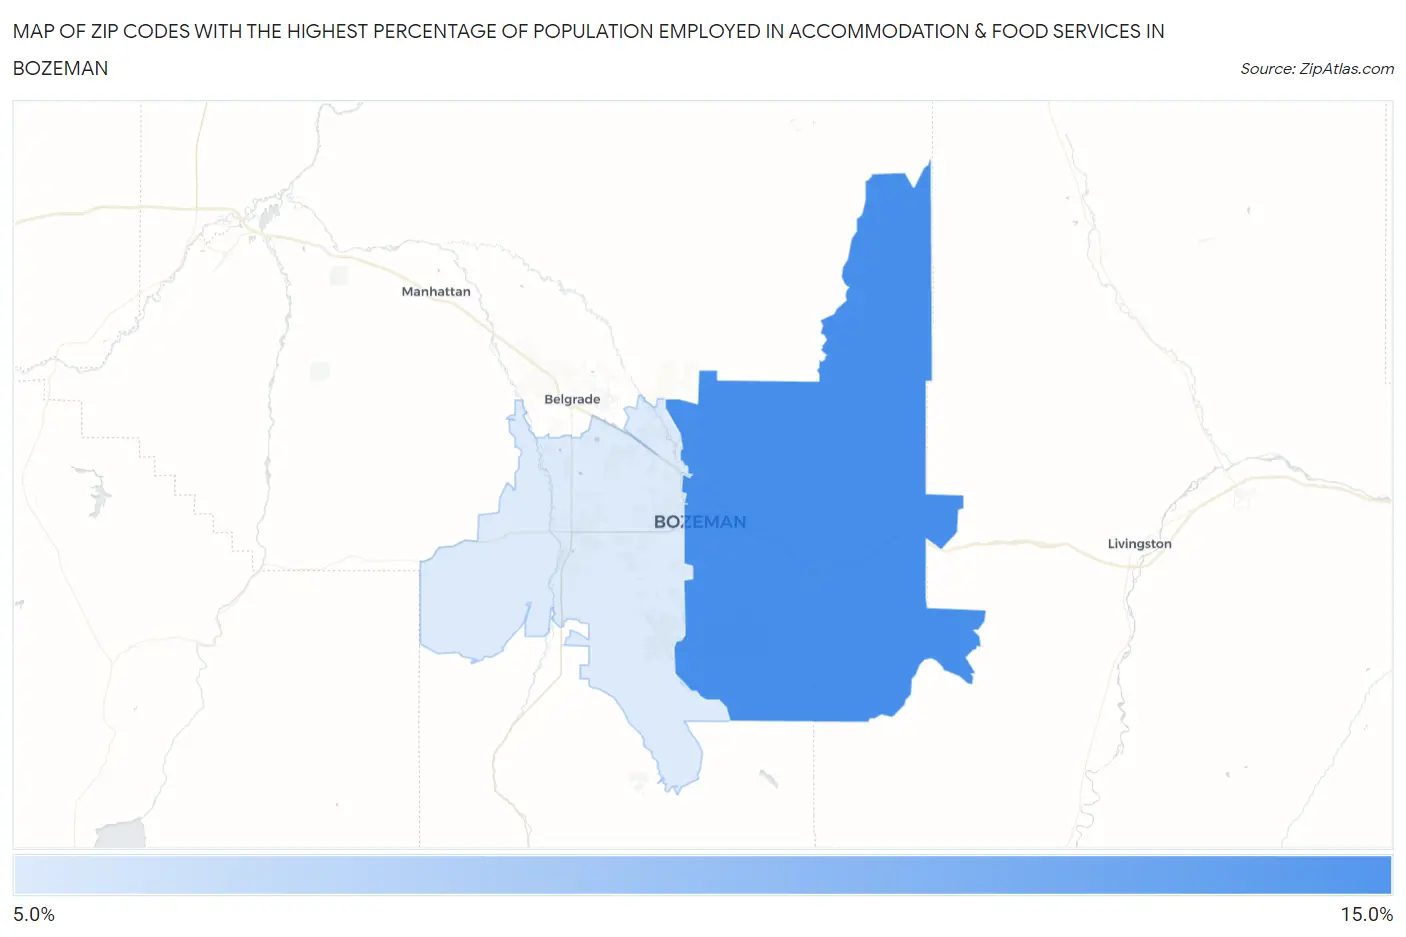
Map of Zip Codes with the Highest Percentage of Population Employed in Accommodation & Food Services in Bozeman
6.2%
10.8%
Zip Codes with the Highest Percentage of Population Employed in Accommodation & Food Services in Bozeman, MT
| Zip Code | % Employed | vs State | vs National | |
| 1. | 59715 | 10.8% | 8.3%(+2.52)#75 | 6.9%(+3.90)#3,732 |
| 2. | 59718 | 6.2% | 8.3%(-2.06)#163 | 6.9%(-0.672)#12,763 |
1
Common Questions
What are the Top Zip Codes with the Highest Percentage of Population Employed in Accommodation & Food Services in Bozeman, MT?
Top Zip Codes with the Highest Percentage of Population Employed in Accommodation & Food Services in Bozeman, MT are:
What zip code has the Highest Percentage of Population Employed in Accommodation & Food Services in Bozeman, MT?
59715 has the Highest Percentage of Population Employed in Accommodation & Food Services in Bozeman, MT with 10.8%.
What is the Percentage of Population Employed in Accommodation & Food Services in Bozeman, MT?
Percentage of Population Employed in Accommodation & Food Services in Bozeman is 9.8%.
What is the Percentage of Population Employed in Accommodation & Food Services in Montana?
Percentage of Population Employed in Accommodation & Food Services in Montana is 8.3%.
What is the Percentage of Population Employed in Accommodation & Food Services in the United States?
Percentage of Population Employed in Accommodation & Food Services in the United States is 6.9%.