Zip Codes with the Highest Percentage of Population Employed in Accommodation & Food Services in Helena, MT
RELATED REPORTS & OPTIONS
Accommodation & Food Services
Helena
Compare Zip Codes
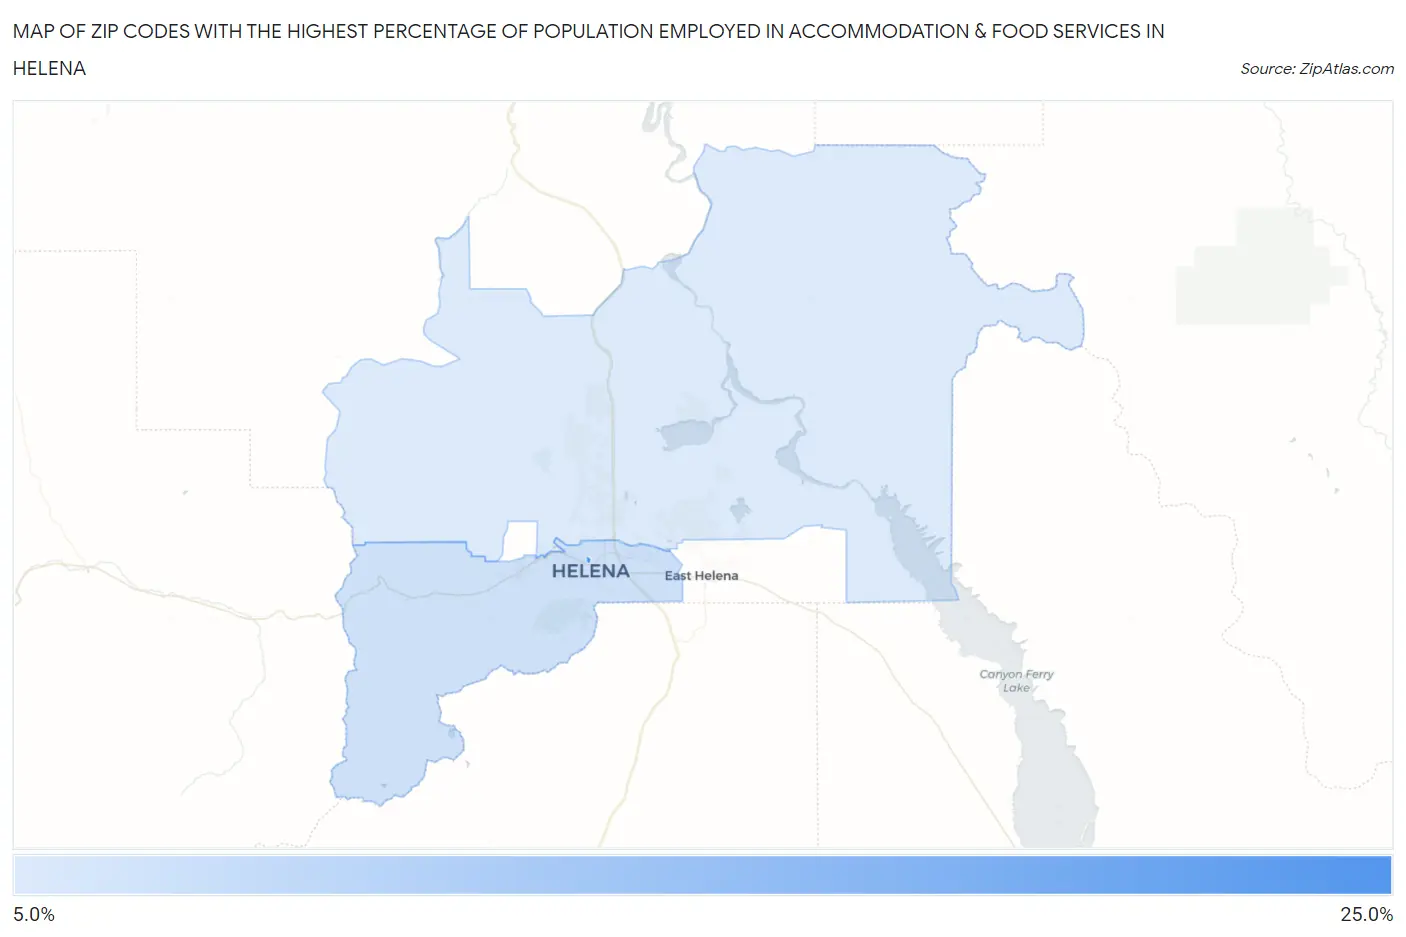
Map of Zip Codes with the Highest Percentage of Population Employed in Accommodation & Food Services in Helena
5.8%
23.6%
Zip Codes with the Highest Percentage of Population Employed in Accommodation & Food Services in Helena, MT
| Zip Code | % Employed | vs State | vs National | |
| 1. | 59625 | 23.6% | 8.3%(+15.4)#24 | 6.9%(+16.8)#579 |
| 2. | 59601 | 7.2% | 8.3%(-1.04)#134 | 6.9%(+0.344)#9,733 |
| 3. | 59602 | 5.8% | 8.3%(-2.49)#175 | 6.9%(-1.10)#14,140 |
1
Common Questions
What are the Top Zip Codes with the Highest Percentage of Population Employed in Accommodation & Food Services in Helena, MT?
Top Zip Codes with the Highest Percentage of Population Employed in Accommodation & Food Services in Helena, MT are:
What zip code has the Highest Percentage of Population Employed in Accommodation & Food Services in Helena, MT?
59625 has the Highest Percentage of Population Employed in Accommodation & Food Services in Helena, MT with 23.6%.
What is the Percentage of Population Employed in Accommodation & Food Services in Helena, MT?
Percentage of Population Employed in Accommodation & Food Services in Helena is 6.9%.
What is the Percentage of Population Employed in Accommodation & Food Services in Montana?
Percentage of Population Employed in Accommodation & Food Services in Montana is 8.3%.
What is the Percentage of Population Employed in Accommodation & Food Services in the United States?
Percentage of Population Employed in Accommodation & Food Services in the United States is 6.9%.