Zip Codes with the Highest Percentage of Population Employed in Accommodation & Food Services in Great Falls, MT
RELATED REPORTS & OPTIONS
Accommodation & Food Services
Great Falls
Compare Zip Codes
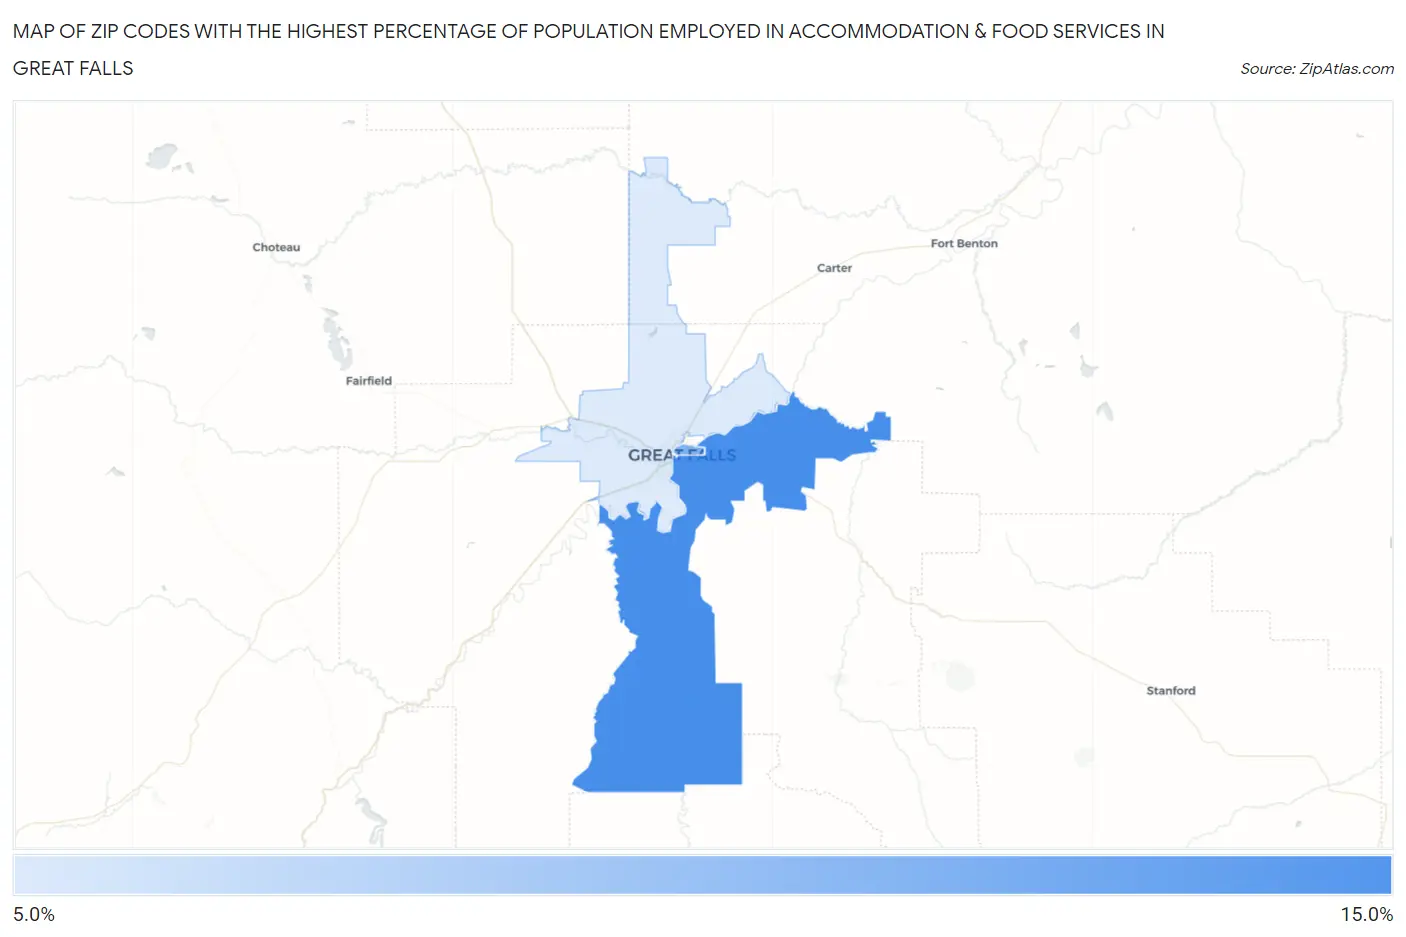
Map of Zip Codes with the Highest Percentage of Population Employed in Accommodation & Food Services in Great Falls
6.6%
10.4%
Zip Codes with the Highest Percentage of Population Employed in Accommodation & Food Services in Great Falls, MT
| Zip Code | % Employed | vs State | vs National | |
| 1. | 59405 | 10.4% | 8.3%(+2.18)#79 | 6.9%(+3.57)#4,048 |
| 2. | 59401 | 9.0% | 8.3%(+0.710)#103 | 6.9%(+2.10)#5,996 |
| 3. | 59404 | 6.6% | 8.3%(-1.66)#153 | 6.9%(-0.276)#11,507 |
1
Common Questions
What are the Top Zip Codes with the Highest Percentage of Population Employed in Accommodation & Food Services in Great Falls, MT?
Top Zip Codes with the Highest Percentage of Population Employed in Accommodation & Food Services in Great Falls, MT are:
What zip code has the Highest Percentage of Population Employed in Accommodation & Food Services in Great Falls, MT?
59405 has the Highest Percentage of Population Employed in Accommodation & Food Services in Great Falls, MT with 10.4%.
What is the Percentage of Population Employed in Accommodation & Food Services in Great Falls, MT?
Percentage of Population Employed in Accommodation & Food Services in Great Falls is 9.5%.
What is the Percentage of Population Employed in Accommodation & Food Services in Montana?
Percentage of Population Employed in Accommodation & Food Services in Montana is 8.3%.
What is the Percentage of Population Employed in Accommodation & Food Services in the United States?
Percentage of Population Employed in Accommodation & Food Services in the United States is 6.9%.