Zip Codes with the Lowest Percentage of Renter-Occupied Units in Louisville, KY
RELATED REPORTS & OPTIONS
Lowest Renter-Occupied
Louisville
Compare Zip Codes
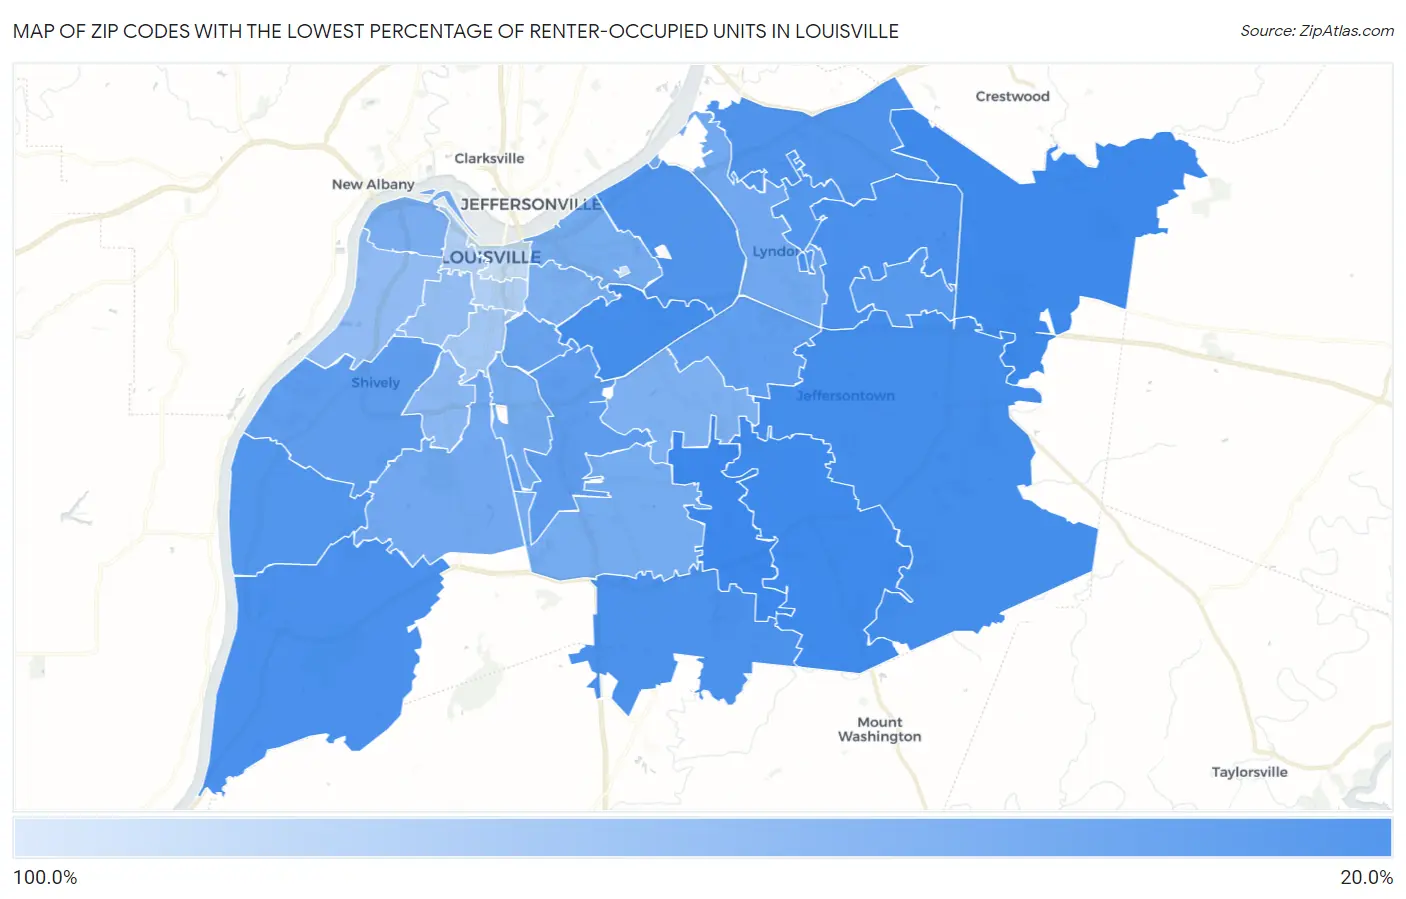
Map of Zip Codes with the Lowest Percentage of Renter-Occupied Units in Louisville
100.0%
21.0%
Zip Codes with the Lowest Percentage of Renter-Occupied Units in Louisville, KY
| Zip Code | % Renter-Occupied | vs State | vs National | |
| 1. | 40228 | 21.0% | 31.9%(-10.9)#300 | 35.2%(-14.2)#13,819 |
| 2. | 40245 | 21.8% | 31.9%(-10.1)#315 | 35.2%(-13.4)#14,539 |
| 3. | 40291 | 22.6% | 31.9%(-9.30)#336 | 35.2%(-12.6)#15,285 |
| 4. | 40299 | 24.4% | 31.9%(-7.47)#373 | 35.2%(-10.8)#16,946 |
| 5. | 40205 | 25.1% | 31.9%(-6.75)#393 | 35.2%(-10.1)#17,600 |
| 6. | 40272 | 27.0% | 31.9%(-4.91)#423 | 35.2%(-8.21)#18,978 |
| 7. | 40223 | 27.1% | 31.9%(-4.82)#426 | 35.2%(-8.12)#19,046 |
| 8. | 40229 | 27.4% | 31.9%(-4.49)#438 | 35.2%(-7.79)#19,271 |
| 9. | 40241 | 29.0% | 31.9%(-2.85)#471 | 35.2%(-6.15)#20,431 |
| 10. | 40207 | 30.2% | 31.9%(-1.67)#489 | 35.2%(-4.97)#21,181 |
| 11. | 40258 | 30.7% | 31.9%(-1.20)#499 | 35.2%(-4.50)#21,473 |
| 12. | 40242 | 31.1% | 31.9%(-0.759)#502 | 35.2%(-4.06)#21,731 |
| 13. | 40243 | 32.8% | 31.9%(+0.955)#526 | 35.2%(-2.35)#22,688 |
| 14. | 40213 | 35.5% | 31.9%(+3.65)#560 | 35.2%(+0.347)#24,000 |
| 15. | 40216 | 35.9% | 31.9%(+4.06)#567 | 35.2%(+0.762)#24,173 |
| 16. | 40220 | 36.9% | 31.9%(+5.06)#578 | 35.2%(+1.76)#24,593 |
| 17. | 40217 | 39.8% | 31.9%(+7.92)#600 | 35.2%(+4.62)#25,631 |
| 18. | 40222 | 44.4% | 31.9%(+12.5)#621 | 35.2%(+9.23)#26,889 |
| 19. | 40214 | 45.0% | 31.9%(+13.1)#626 | 35.2%(+9.81)#27,048 |
| 20. | 40209 | 46.2% | 31.9%(+14.4)#630 | 35.2%(+11.1)#27,324 |
| 21. | 40206 | 47.2% | 31.9%(+15.3)#636 | 35.2%(+12.0)#27,495 |
| 22. | 40219 | 47.3% | 31.9%(+15.4)#638 | 35.2%(+12.1)#27,517 |
| 23. | 40212 | 49.4% | 31.9%(+17.5)#645 | 35.2%(+14.2)#27,901 |
| 24. | 40218 | 49.9% | 31.9%(+18.0)#646 | 35.2%(+14.7)#27,991 |
| 25. | 40204 | 50.5% | 31.9%(+18.6)#647 | 35.2%(+15.3)#28,086 |
| 26. | 40215 | 57.5% | 31.9%(+25.7)#663 | 35.2%(+22.4)#29,058 |
| 27. | 40211 | 60.9% | 31.9%(+29.1)#667 | 35.2%(+25.7)#29,386 |
| 28. | 40210 | 62.8% | 31.9%(+31.0)#670 | 35.2%(+27.7)#29,540 |
| 29. | 40208 | 71.7% | 31.9%(+39.8)#675 | 35.2%(+36.5)#30,133 |
| 30. | 40203 | 77.5% | 31.9%(+45.6)#679 | 35.2%(+42.3)#30,341 |
| 31. | 40202 | 90.7% | 31.9%(+58.8)#685 | 35.2%(+55.5)#30,652 |
| 32. | 40280 | 100.0% | 31.9%(+68.1)#689 | 35.2%(+64.8)#30,954 |
1
Common Questions
What are the Top 10 Zip Codes with the Lowest Percentage of Renter-Occupied Units in Louisville, KY?
Top 10 Zip Codes with the Lowest Percentage of Renter-Occupied Units in Louisville, KY are:
What zip code has the Lowest Percentage of Renter-Occupied Units in Louisville, KY?
40228 has the Lowest Percentage of Renter-Occupied Units in Louisville, KY with 21.0%.
What is the Percentage of Renter-Occupied Units in Louisville, KY?
Percentage of Renter-Occupied Units in Louisville is 39.6%.
What is the Percentage of Renter-Occupied Units in Kentucky?
Percentage of Renter-Occupied Units in Kentucky is 31.9%.
What is the Percentage of Renter-Occupied Units in the United States?
Percentage of Renter-Occupied Units in the United States is 35.2%.