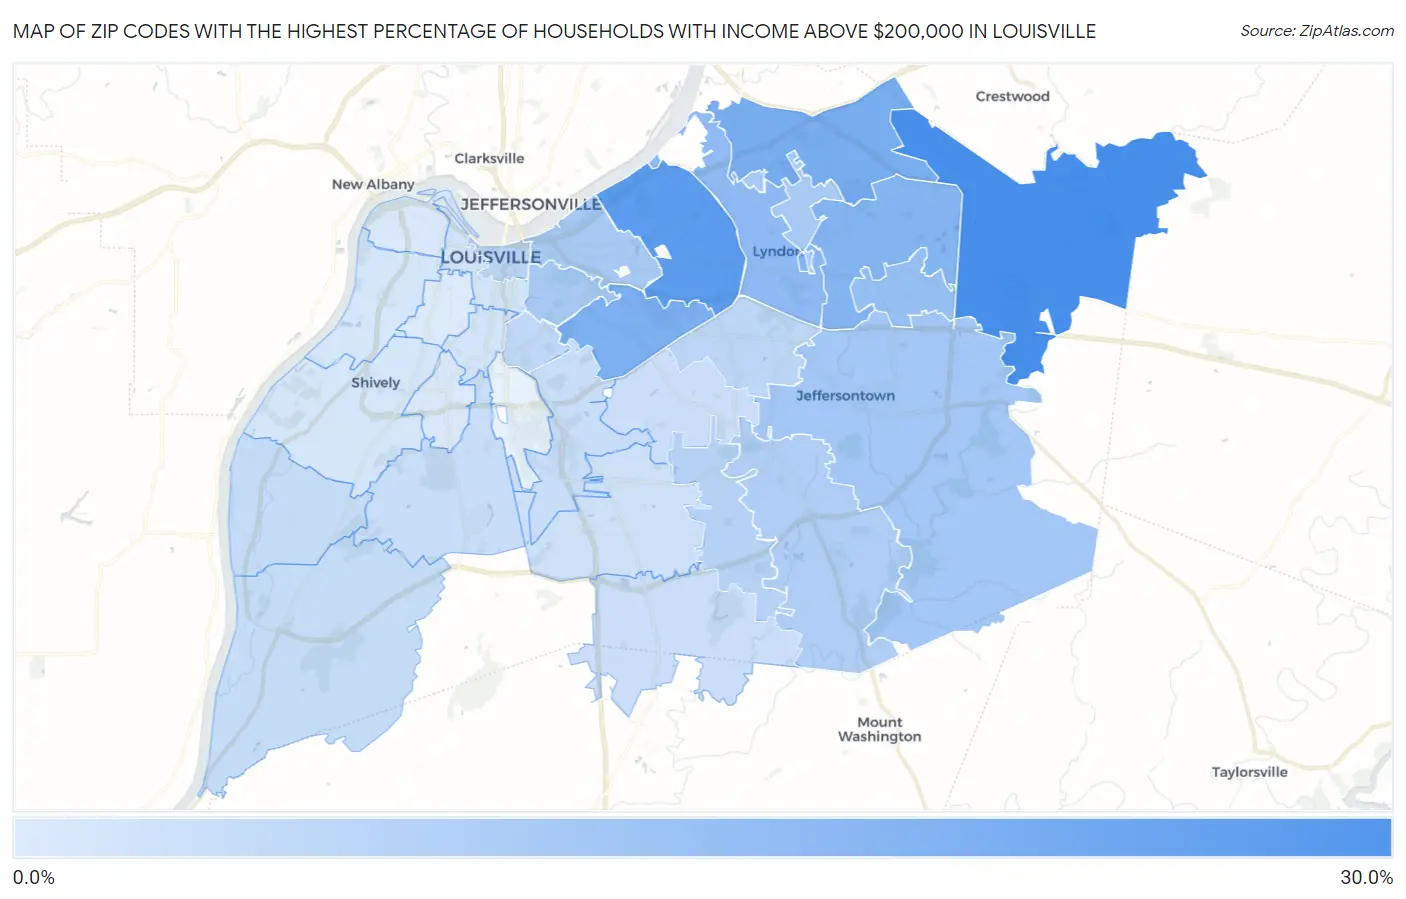
Zip Codes with the Highest Percentage of Households with Income Above $200,000 in Louisville, KY
RELATED REPORTS & OPTIONS
Household Income | $200k+
Louisville
Compare Zip Codes
Map of Zip Codes with the Highest Percentage of Households with Income Above $200,000 in Louisville
0.70%
25.5%
Zip Codes with the Highest Percentage of Households with Income Above $200,000 in Louisville, KY
| Zip Code | Households with Income > $200k | vs State | vs National | |
| 1. | 40245 | 25.5% | 6.0%(+19.5)#8 | 11.4%(+14.1)#2,096 |
| 2. | 40207 | 21.8% | 6.0%(+15.8)#15 | 11.4%(+10.4)#2,819 |
| 3. | 40241 | 16.9% | 6.0%(+10.9)#25 | 11.4%(+5.50)#4,221 |
| 4. | 40205 | 16.0% | 6.0%(+10.00)#28 | 11.4%(+4.60)#4,562 |
| 5. | 40223 | 15.0% | 6.0%(+9.00)#29 | 11.4%(+3.60)#4,983 |
| 6. | 40222 | 12.9% | 6.0%(+6.90)#41 | 11.4%(+1.50)#6,081 |
| 7. | 40243 | 11.7% | 6.0%(+5.70)#51 | 11.4%(+0.300)#6,872 |
| 8. | 40299 | 9.5% | 6.0%(+3.50)#71 | 11.4%(-1.90)#8,715 |
| 9. | 40206 | 9.0% | 6.0%(+3.00)#77 | 11.4%(-2.40)#9,226 |
| 10. | 40242 | 9.0% | 6.0%(+3.00)#78 | 11.4%(-2.40)#9,235 |
| 11. | 40204 | 8.7% | 6.0%(+2.70)#88 | 11.4%(-2.70)#9,548 |
| 12. | 40291 | 7.9% | 6.0%(+1.90)#104 | 11.4%(-3.50)#10,480 |
| 13. | 40228 | 6.6% | 6.0%(+0.600)#131 | 11.4%(-4.80)#12,427 |
| 14. | 40202 | 6.1% | 6.0%(+0.100)#143 | 11.4%(-5.30)#13,306 |
| 15. | 40220 | 5.7% | 6.0%(-0.300)#156 | 11.4%(-5.70)#14,062 |
| 16. | 40217 | 5.2% | 6.0%(-0.800)#172 | 11.4%(-6.20)#15,137 |
| 17. | 40272 | 4.3% | 6.0%(-1.70)#203 | 11.4%(-7.10)#17,258 |
| 18. | 40258 | 4.1% | 6.0%(-1.90)#215 | 11.4%(-7.30)#17,828 |
| 19. | 40214 | 3.9% | 6.0%(-2.10)#223 | 11.4%(-7.50)#18,327 |
| 20. | 40213 | 3.8% | 6.0%(-2.20)#230 | 11.4%(-7.60)#18,634 |
| 21. | 40218 | 3.5% | 6.0%(-2.50)#250 | 11.4%(-7.90)#19,435 |
| 22. | 40229 | 3.3% | 6.0%(-2.70)#264 | 11.4%(-8.10)#20,003 |
| 23. | 40219 | 2.9% | 6.0%(-3.10)#296 | 11.4%(-8.50)#21,149 |
| 24. | 40203 | 2.0% | 6.0%(-4.00)#355 | 11.4%(-9.40)#23,762 |
| 25. | 40208 | 2.0% | 6.0%(-4.00)#357 | 11.4%(-9.40)#23,769 |
| 26. | 40216 | 1.9% | 6.0%(-4.10)#365 | 11.4%(-9.50)#24,035 |
| 27. | 40211 | 1.7% | 6.0%(-4.30)#382 | 11.4%(-9.70)#24,557 |
| 28. | 40215 | 1.1% | 6.0%(-4.90)#428 | 11.4%(-10.3)#25,963 |
| 29. | 40212 | 0.90% | 6.0%(-5.10)#434 | 11.4%(-10.5)#26,386 |
| 30. | 40210 | 0.70% | 6.0%(-5.30)#446 | 11.4%(-10.7)#26,740 |
1
Common Questions
What are the Top 10 Zip Codes with the Highest Percentage of Households with Income Above $200,000 in Louisville, KY?
Top 10 Zip Codes with the Highest Percentage of Households with Income Above $200,000 in Louisville, KY are:
What zip code has the Highest Percentage of Households with Income Above $200,000 in Louisville, KY?
40245 has the Highest Percentage of Households with Income Above $200,000 in Louisville, KY with 25.5%.
What is the Percentage of Households with Income Above $200,000 in Louisville, KY?
Percentage of Households with Income Above $200,000 in Louisville is 7.4%.
What is the Percentage of Households with Income Above $200,000 in Kentucky?
Percentage of Households with Income Above $200,000 in Kentucky is 6.0%.
What is the Percentage of Households with Income Above $200,000 in the United States?
Percentage of Households with Income Above $200,000 in the United States is 11.4%.