Zip Codes with the Highest Percentage of Population with a Degree in Visual and Performing Arts in Louisville, KY
RELATED REPORTS & OPTIONS
Visual and Performing Arts
Louisville
Compare Zip Codes
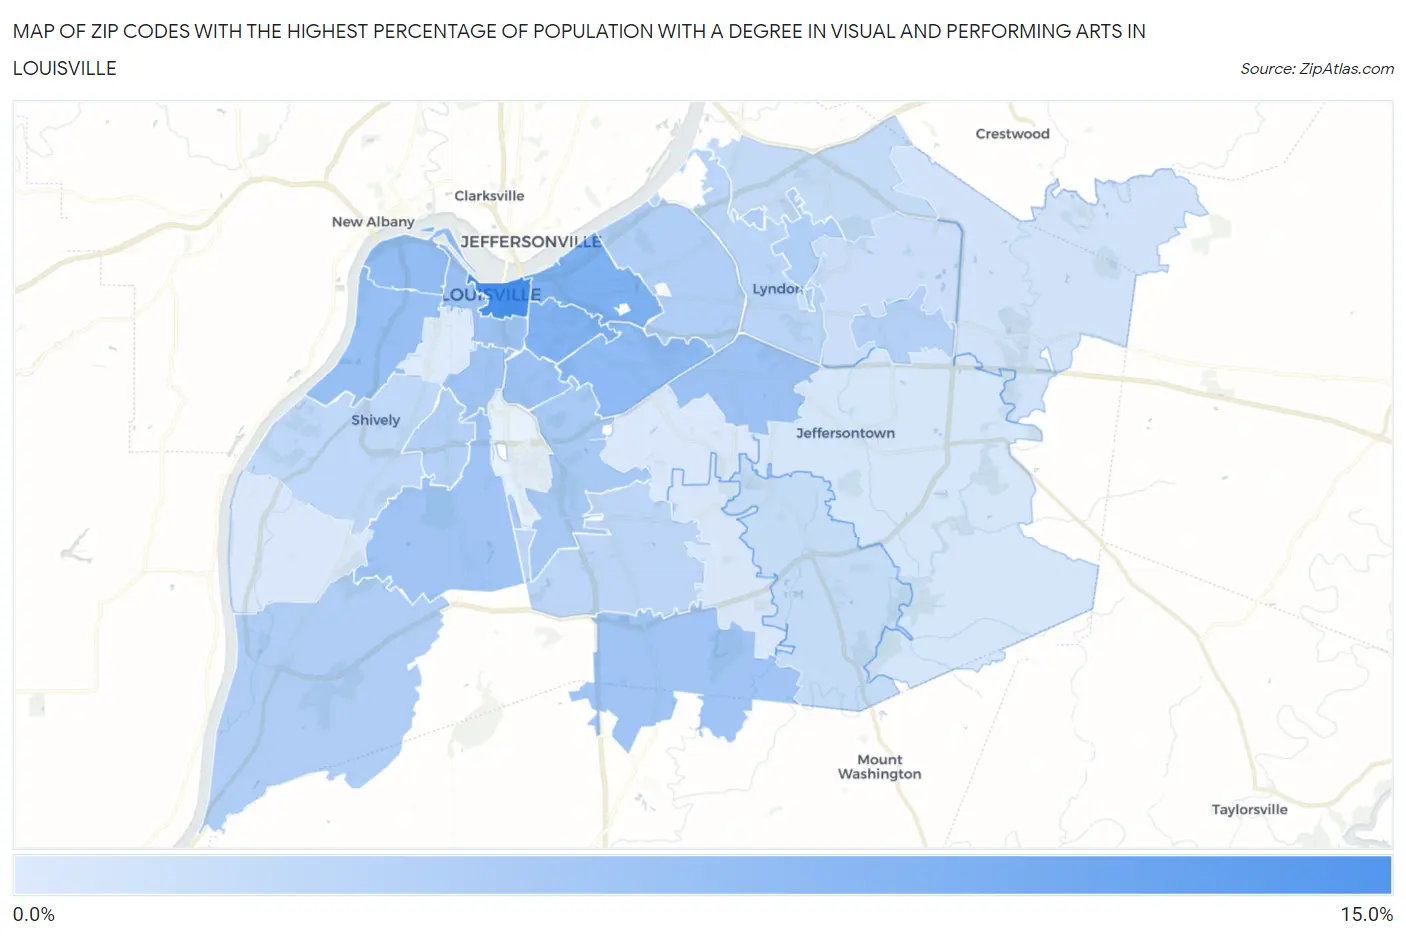
Map of Zip Codes with the Highest Percentage of Population with a Degree in Visual and Performing Arts in Louisville
1.1%
11.9%
Zip Codes with the Highest Percentage of Population with a Degree in Visual and Performing Arts in Louisville, KY
| Zip Code | % Graduates | vs State | vs National | |
| 1. | 40202 | 11.9% | 3.2%(+8.72)#26 | 4.3%(+7.70)#1,297 |
| 2. | 40206 | 7.9% | 3.2%(+4.65)#43 | 4.3%(+3.63)#2,936 |
| 3. | 40204 | 7.7% | 3.2%(+4.44)#44 | 4.3%(+3.42)#3,093 |
| 4. | 40205 | 6.6% | 3.2%(+3.33)#54 | 4.3%(+2.31)#4,165 |
| 5. | 40212 | 6.3% | 3.2%(+3.04)#58 | 4.3%(+2.02)#4,509 |
| 6. | 40211 | 6.0% | 3.2%(+2.82)#61 | 4.3%(+1.79)#4,810 |
| 7. | 40217 | 5.9% | 3.2%(+2.64)#65 | 4.3%(+1.62)#5,071 |
| 8. | 40220 | 5.8% | 3.2%(+2.58)#66 | 4.3%(+1.56)#5,159 |
| 9. | 40203 | 5.6% | 3.2%(+2.33)#73 | 4.3%(+1.31)#5,552 |
| 10. | 40229 | 5.4% | 3.2%(+2.15)#77 | 4.3%(+1.12)#5,899 |
| 11. | 40208 | 5.3% | 3.2%(+2.05)#78 | 4.3%(+1.03)#6,094 |
| 12. | 40214 | 5.3% | 3.2%(+2.04)#79 | 4.3%(+1.02)#6,107 |
| 13. | 40213 | 4.9% | 3.2%(+1.63)#92 | 4.3%(+0.610)#6,943 |
| 14. | 40272 | 4.3% | 3.2%(+1.03)#105 | 4.3%(+0.010)#8,464 |
| 15. | 40242 | 4.2% | 3.2%(+0.996)#107 | 4.3%(-0.027)#8,558 |
| 16. | 40207 | 4.2% | 3.2%(+0.924)#108 | 4.3%(-0.099)#8,760 |
| 17. | 40243 | 4.0% | 3.2%(+0.792)#111 | 4.3%(-0.231)#9,192 |
| 18. | 40215 | 4.0% | 3.2%(+0.725)#114 | 4.3%(-0.298)#9,387 |
| 19. | 40222 | 3.6% | 3.2%(+0.324)#127 | 4.3%(-0.699)#10,686 |
| 20. | 40219 | 3.4% | 3.2%(+0.145)#135 | 4.3%(-0.879)#11,334 |
| 21. | 40216 | 3.1% | 3.2%(-0.088)#142 | 4.3%(-1.11)#12,197 |
| 22. | 40241 | 2.8% | 3.2%(-0.429)#152 | 4.3%(-1.45)#13,488 |
| 23. | 40291 | 2.7% | 3.2%(-0.504)#157 | 4.3%(-1.53)#13,797 |
| 24. | 40223 | 2.3% | 3.2%(-0.901)#183 | 4.3%(-1.92)#15,254 |
| 25. | 40245 | 1.9% | 3.2%(-1.31)#213 | 4.3%(-2.34)#16,732 |
| 26. | 40299 | 1.6% | 3.2%(-1.64)#234 | 4.3%(-2.66)#17,878 |
| 27. | 40228 | 1.4% | 3.2%(-1.82)#241 | 4.3%(-2.85)#18,456 |
| 28. | 40218 | 1.3% | 3.2%(-1.91)#245 | 4.3%(-2.93)#18,693 |
| 29. | 40258 | 1.3% | 3.2%(-1.95)#249 | 4.3%(-2.97)#18,847 |
| 30. | 40210 | 1.1% | 3.2%(-2.12)#254 | 4.3%(-3.14)#19,364 |
1
Common Questions
What are the Top 10 Zip Codes with the Highest Percentage of Population with a Degree in Visual and Performing Arts in Louisville, KY?
Top 10 Zip Codes with the Highest Percentage of Population with a Degree in Visual and Performing Arts in Louisville, KY are:
What zip code has the Highest Percentage of Population with a Degree in Visual and Performing Arts in Louisville, KY?
40202 has the Highest Percentage of Population with a Degree in Visual and Performing Arts in Louisville, KY with 11.9%.
What is the Percentage of Population with a Degree in Visual and Performing Arts in Louisville, KY?
Percentage of Population with a Degree in Visual and Performing Arts in Louisville is 4.2%.
What is the Percentage of Population with a Degree in Visual and Performing Arts in Kentucky?
Percentage of Population with a Degree in Visual and Performing Arts in Kentucky is 3.2%.
What is the Percentage of Population with a Degree in Visual and Performing Arts in the United States?
Percentage of Population with a Degree in Visual and Performing Arts in the United States is 4.3%.