Zip Codes with the Highest Percentage of Black / African American Population in Louisville, KY
RELATED REPORTS & OPTIONS
Black / African American
Louisville
Compare Zip Codes
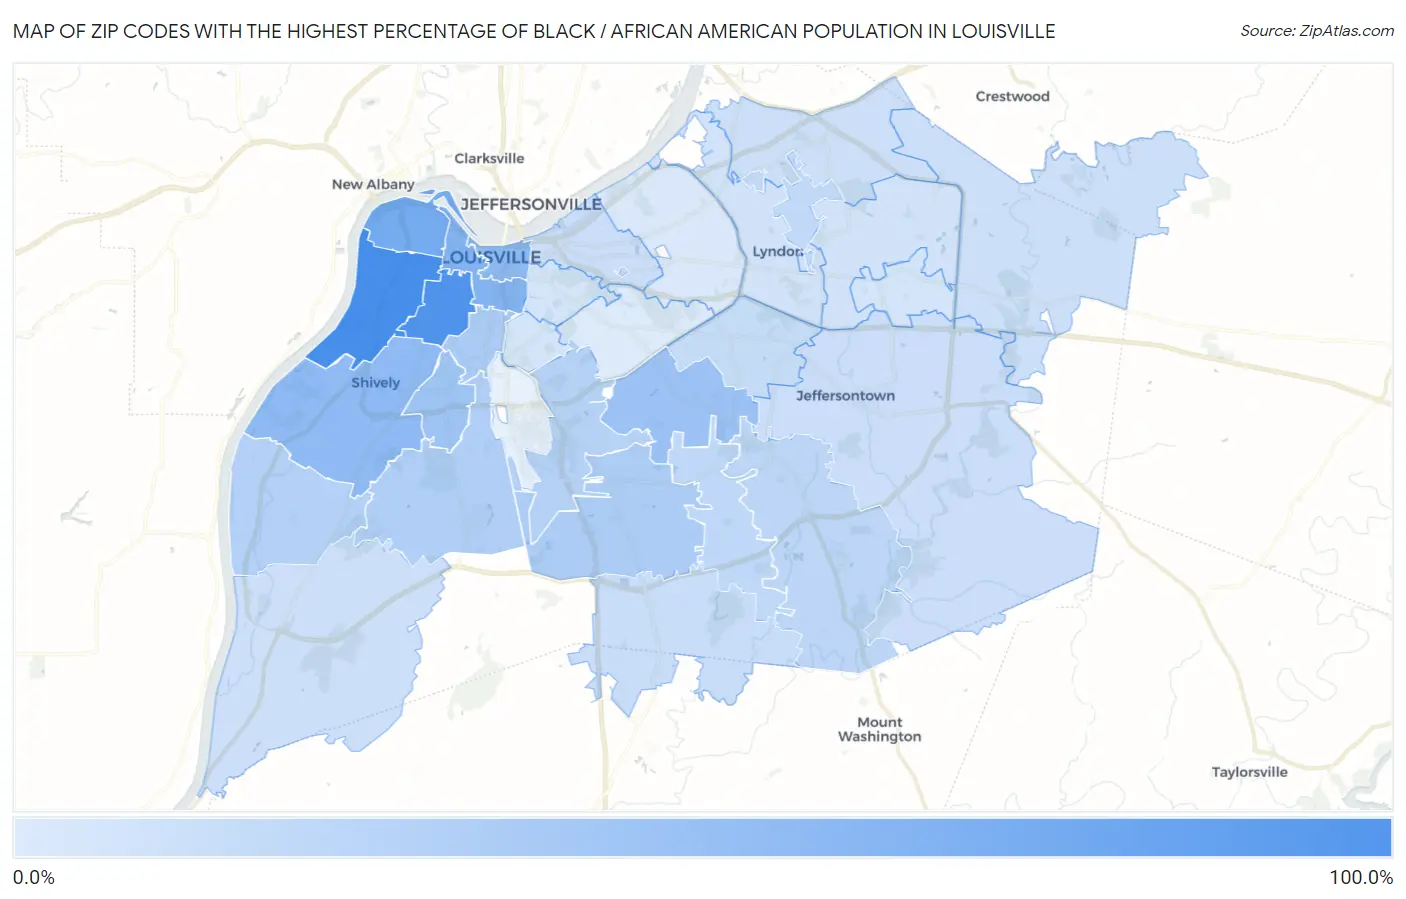
Map of Zip Codes with the Highest Percentage of Black / African American Population in Louisville
2.5%
93.4%
Zip Codes with the Highest Percentage of Black / African American Population in Louisville, KY
| Zip Code | Black / African American | vs State | vs National | |
| 1. | 40211 | 93.4% | 8.0%(+85.4)#1 | 12.5%(+80.9)#100 |
| 2. | 40210 | 85.1% | 8.0%(+77.1)#2 | 12.5%(+72.6)#238 |
| 3. | 40212 | 59.8% | 8.0%(+51.8)#4 | 12.5%(+47.3)#879 |
| 4. | 40203 | 50.2% | 8.0%(+42.2)#5 | 12.5%(+37.8)#1,239 |
| 5. | 40216 | 42.9% | 8.0%(+34.9)#8 | 12.5%(+30.4)#1,639 |
| 6. | 40202 | 42.8% | 8.0%(+34.8)#9 | 12.5%(+30.4)#1,645 |
| 7. | 40218 | 36.0% | 8.0%(+28.0)#10 | 12.5%(+23.6)#2,122 |
| 8. | 40215 | 33.7% | 8.0%(+25.7)#11 | 12.5%(+21.2)#2,325 |
| 9. | 40208 | 26.6% | 8.0%(+18.6)#14 | 12.5%(+14.1)#3,020 |
| 10. | 40219 | 25.7% | 8.0%(+17.7)#17 | 12.5%(+13.2)#3,133 |
| 11. | 40214 | 23.6% | 8.0%(+15.6)#23 | 12.5%(+11.2)#3,404 |
| 12. | 40258 | 22.1% | 8.0%(+14.1)#25 | 12.5%(+9.59)#3,625 |
| 13. | 40213 | 20.8% | 8.0%(+12.8)#28 | 12.5%(+8.31)#3,831 |
| 14. | 40291 | 17.8% | 8.0%(+9.84)#34 | 12.5%(+5.37)#4,345 |
| 15. | 40228 | 16.7% | 8.0%(+8.69)#38 | 12.5%(+4.22)#4,581 |
| 16. | 40280 | 16.5% | 8.0%(+8.51)#39 | 12.5%(+4.04)#4,623 |
| 17. | 40242 | 14.8% | 8.0%(+6.79)#40 | 12.5%(+2.32)#5,007 |
| 18. | 40220 | 13.3% | 8.0%(+5.25)#48 | 12.5%(+0.780)#5,464 |
| 19. | 40229 | 11.8% | 8.0%(+3.82)#55 | 12.5%(-0.656)#5,939 |
| 20. | 40206 | 10.9% | 8.0%(+2.93)#57 | 12.5%(-1.54)#6,260 |
| 21. | 40299 | 10.6% | 8.0%(+2.59)#60 | 12.5%(-1.88)#6,404 |
| 22. | 40241 | 10.2% | 8.0%(+2.22)#63 | 12.5%(-2.25)#6,542 |
| 23. | 40272 | 10.1% | 8.0%(+2.14)#64 | 12.5%(-2.33)#6,569 |
| 24. | 40245 | 9.5% | 8.0%(+1.49)#69 | 12.5%(-2.98)#6,829 |
| 25. | 40222 | 8.0% | 8.0%(+0.040)#81 | 12.5%(-4.43)#7,524 |
| 26. | 40223 | 7.2% | 8.0%(-0.749)#92 | 12.5%(-5.22)#7,950 |
| 27. | 40204 | 6.7% | 8.0%(-1.34)#100 | 12.5%(-5.81)#8,306 |
| 28. | 40243 | 6.4% | 8.0%(-1.57)#106 | 12.5%(-6.04)#8,444 |
| 29. | 40217 | 6.3% | 8.0%(-1.66)#107 | 12.5%(-6.13)#8,513 |
| 30. | 40207 | 3.1% | 8.0%(-4.90)#179 | 12.5%(-9.37)#11,657 |
| 31. | 40205 | 2.5% | 8.0%(-5.53)#205 | 12.5%(-10.00)#12,657 |
1
Common Questions
What are the Top 10 Zip Codes with the Highest Percentage of Black / African American Population in Louisville, KY?
Top 10 Zip Codes with the Highest Percentage of Black / African American Population in Louisville, KY are:
What zip code has the Highest Percentage of Black / African American Population in Louisville, KY?
40211 has the Highest Percentage of Black / African American Population in Louisville, KY with 93.4%.
What is the Percentage of Black / African American Population in Louisville, KY?
Percentage of Black / African American Population in Louisville is 23.9%.
What is the Percentage of Black / African American Population in Kentucky?
Percentage of Black / African American Population in Kentucky is 8.0%.
What is the Percentage of Black / African American Population in the United States?
Percentage of Black / African American Population in the United States is 12.5%.