Zip Codes with the Highest Percentage of Population Employed in Professional & Scientific Services in Louisville, KY
RELATED REPORTS & OPTIONS
Professional & Scientific Services
Louisville
Compare Zip Codes
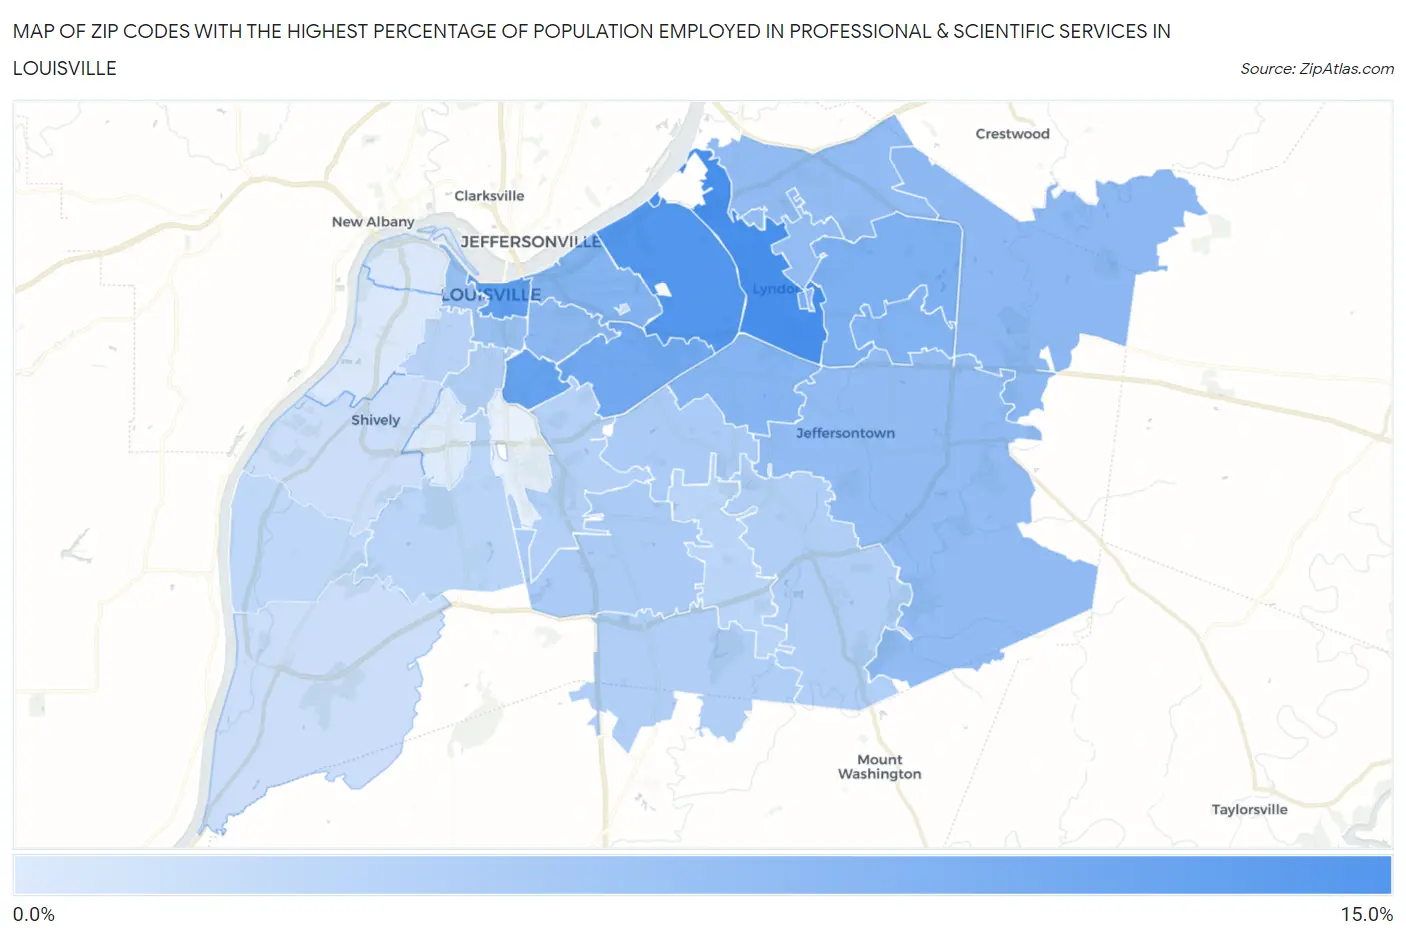
Map of Zip Codes with the Highest Percentage of Population Employed in Professional & Scientific Services in Louisville
0.84%
14.6%
Zip Codes with the Highest Percentage of Population Employed in Professional & Scientific Services in Louisville, KY
| Zip Code | % Employed | vs State | vs National | |
| 1. | 40222 | 14.6% | 4.9%(+9.66)#13 | 7.8%(+6.74)#2,058 |
| 2. | 40207 | 13.5% | 4.9%(+8.61)#19 | 7.8%(+5.68)#2,476 |
| 3. | 40202 | 12.0% | 4.9%(+7.11)#23 | 7.8%(+4.19)#3,182 |
| 4. | 40217 | 11.7% | 4.9%(+6.80)#25 | 7.8%(+3.87)#3,366 |
| 5. | 40205 | 10.7% | 4.9%(+5.75)#31 | 7.8%(+2.82)#4,054 |
| 6. | 40223 | 9.6% | 4.9%(+4.67)#38 | 7.8%(+1.74)#4,922 |
| 7. | 40243 | 9.0% | 4.9%(+4.10)#45 | 7.8%(+1.17)#5,502 |
| 8. | 40206 | 8.9% | 4.9%(+3.97)#47 | 7.8%(+1.04)#5,630 |
| 9. | 40220 | 8.6% | 4.9%(+3.68)#50 | 7.8%(+0.759)#5,907 |
| 10. | 40245 | 8.1% | 4.9%(+3.15)#57 | 7.8%(+0.222)#6,565 |
| 11. | 40204 | 8.0% | 4.9%(+3.11)#58 | 7.8%(+0.188)#6,613 |
| 12. | 40241 | 7.7% | 4.9%(+2.78)#63 | 7.8%(-0.148)#7,065 |
| 13. | 40299 | 7.6% | 4.9%(+2.72)#64 | 7.8%(-0.205)#7,148 |
| 14. | 40242 | 7.3% | 4.9%(+2.39)#69 | 7.8%(-0.532)#7,636 |
| 15. | 40203 | 6.9% | 4.9%(+1.95)#79 | 7.8%(-0.972)#8,370 |
| 16. | 40218 | 5.4% | 4.9%(+0.440)#122 | 7.8%(-2.48)#11,420 |
| 17. | 40219 | 5.2% | 4.9%(+0.299)#126 | 7.8%(-2.63)#11,768 |
| 18. | 40208 | 4.9% | 4.9%(-0.022)#140 | 7.8%(-2.95)#12,575 |
| 19. | 40291 | 4.7% | 4.9%(-0.185)#150 | 7.8%(-3.11)#13,016 |
| 20. | 40229 | 4.6% | 4.9%(-0.309)#157 | 7.8%(-3.23)#13,330 |
| 21. | 40213 | 4.5% | 4.9%(-0.397)#161 | 7.8%(-3.32)#13,592 |
| 22. | 40210 | 4.0% | 4.9%(-0.882)#180 | 7.8%(-3.81)#14,987 |
| 23. | 40214 | 3.9% | 4.9%(-1.03)#189 | 7.8%(-3.95)#15,424 |
| 24. | 40228 | 3.8% | 4.9%(-1.12)#206 | 7.8%(-4.05)#15,716 |
| 25. | 40258 | 3.5% | 4.9%(-1.40)#228 | 7.8%(-4.33)#16,673 |
| 26. | 40280 | 2.5% | 4.9%(-2.39)#293 | 7.8%(-5.32)#20,072 |
| 27. | 40216 | 2.5% | 4.9%(-2.45)#301 | 7.8%(-5.38)#20,280 |
| 28. | 40272 | 2.4% | 4.9%(-2.53)#306 | 7.8%(-5.46)#20,585 |
| 29. | 40212 | 0.98% | 4.9%(-3.94)#414 | 7.8%(-6.87)#25,074 |
| 30. | 40211 | 0.95% | 4.9%(-3.97)#416 | 7.8%(-6.89)#25,167 |
| 31. | 40215 | 0.84% | 4.9%(-4.08)#426 | 7.8%(-7.00)#25,448 |
1
Common Questions
What are the Top 10 Zip Codes with the Highest Percentage of Population Employed in Professional & Scientific Services in Louisville, KY?
Top 10 Zip Codes with the Highest Percentage of Population Employed in Professional & Scientific Services in Louisville, KY are:
What zip code has the Highest Percentage of Population Employed in Professional & Scientific Services in Louisville, KY?
40222 has the Highest Percentage of Population Employed in Professional & Scientific Services in Louisville, KY with 14.6%.
What is the Percentage of Population Employed in Professional & Scientific Services in Louisville, KY?
Percentage of Population Employed in Professional & Scientific Services in Louisville is 5.7%.
What is the Percentage of Population Employed in Professional & Scientific Services in Kentucky?
Percentage of Population Employed in Professional & Scientific Services in Kentucky is 4.9%.
What is the Percentage of Population Employed in Professional & Scientific Services in the United States?
Percentage of Population Employed in Professional & Scientific Services in the United States is 7.8%.