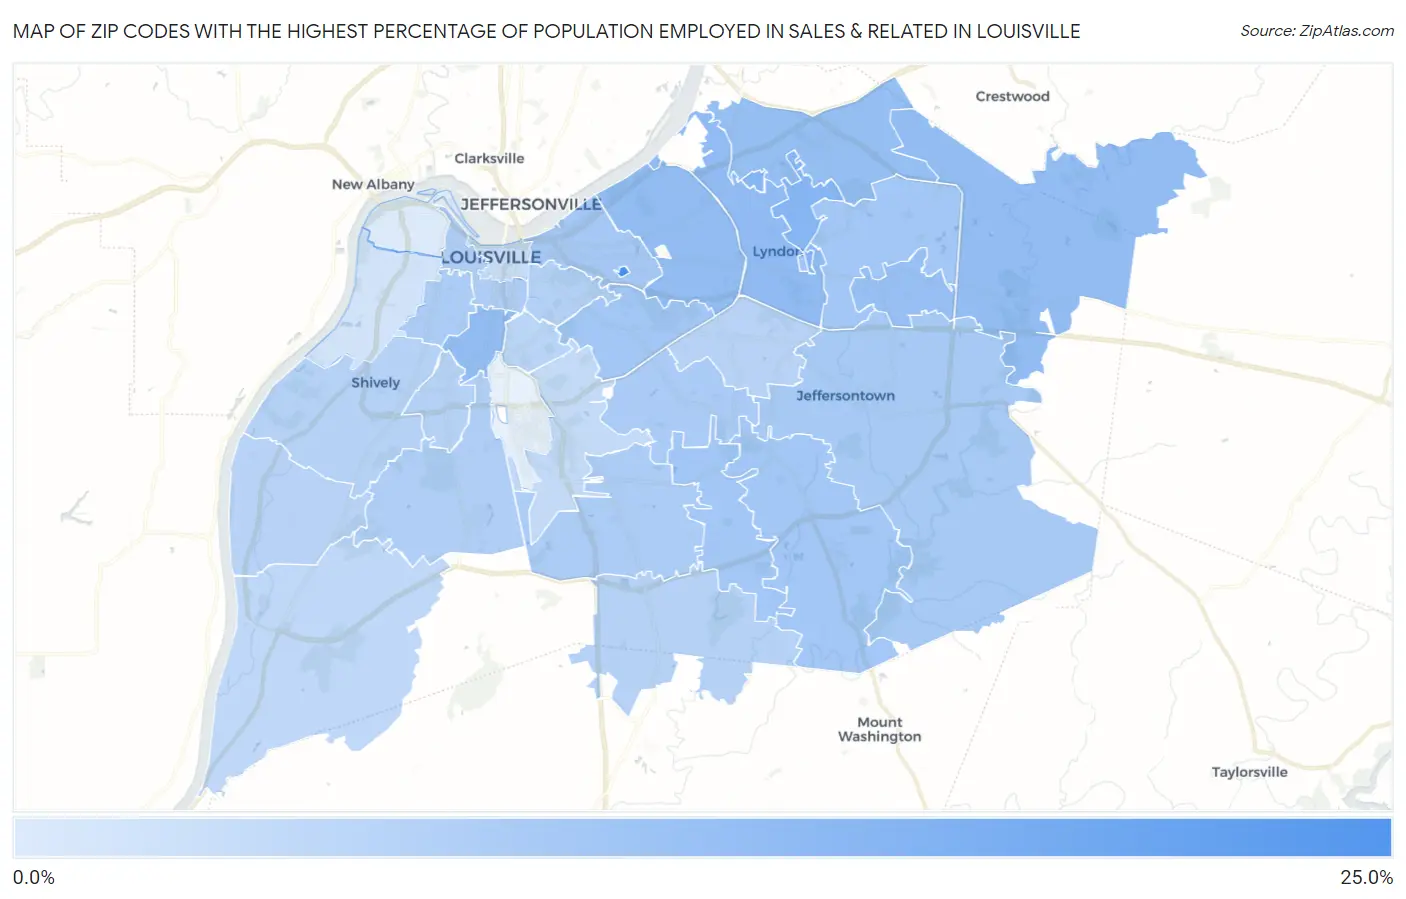
Zip Codes with the Highest Percentage of Population Employed in Sales & Related in Louisville, KY
RELATED REPORTS & OPTIONS
Sales & Related
Louisville
Compare Zip Codes
Map of Zip Codes with the Highest Percentage of Population Employed in Sales & Related in Louisville
3.8%
20.9%

Zip Codes with the Highest Percentage of Population Employed in Sales & Related in Louisville, KY
| Zip Code | % Employed | vs State | vs National | |
| 1. | 40280 | 20.9% | 9.2%(+11.7)#44 | 9.6%(+11.3)#1,027 |
| 2. | 40242 | 13.5% | 9.2%(+4.30)#105 | 9.6%(+3.92)#3,926 |
| 3. | 40222 | 12.3% | 9.2%(+3.04)#134 | 9.6%(+2.66)#5,575 |
| 4. | 40208 | 12.0% | 9.2%(+2.82)#143 | 9.6%(+2.43)#5,993 |
| 5. | 40245 | 12.0% | 9.2%(+2.76)#147 | 9.6%(+2.38)#6,093 |
| 6. | 40207 | 11.9% | 9.2%(+2.68)#149 | 9.6%(+2.30)#6,243 |
| 7. | 40241 | 11.7% | 9.2%(+2.50)#157 | 9.6%(+2.12)#6,568 |
| 8. | 40243 | 11.5% | 9.2%(+2.30)#164 | 9.6%(+1.91)#6,994 |
| 9. | 40223 | 10.2% | 9.2%(+0.952)#216 | 9.6%(+0.570)#10,532 |
| 10. | 40205 | 10.1% | 9.2%(+0.860)#221 | 9.6%(+0.478)#10,774 |
| 11. | 40228 | 10.1% | 9.2%(+0.843)#222 | 9.6%(+0.461)#10,829 |
| 12. | 40291 | 10.0% | 9.2%(+0.779)#228 | 9.6%(+0.397)#11,046 |
| 13. | 40206 | 9.9% | 9.2%(+0.724)#230 | 9.6%(+0.342)#11,208 |
| 14. | 40299 | 9.6% | 9.2%(+0.410)#247 | 9.6%(+0.028)#12,304 |
| 15. | 40218 | 9.2% | 9.2%(-0.010)#275 | 9.6%(-0.392)#13,778 |
| 16. | 40210 | 9.2% | 9.2%(-0.062)#283 | 9.6%(-0.444)#13,973 |
| 17. | 40219 | 9.1% | 9.2%(-0.142)#292 | 9.6%(-0.525)#14,259 |
| 18. | 40203 | 8.9% | 9.2%(-0.331)#301 | 9.6%(-0.713)#14,958 |
| 19. | 40214 | 8.5% | 9.2%(-0.726)#326 | 9.6%(-1.11)#16,394 |
| 20. | 40204 | 8.2% | 9.2%(-0.965)#338 | 9.6%(-1.35)#17,244 |
| 21. | 40216 | 8.1% | 9.2%(-1.09)#345 | 9.6%(-1.48)#17,672 |
| 22. | 40215 | 8.0% | 9.2%(-1.22)#352 | 9.6%(-1.60)#18,077 |
| 23. | 40229 | 8.0% | 9.2%(-1.22)#353 | 9.6%(-1.60)#18,088 |
| 24. | 40220 | 7.9% | 9.2%(-1.29)#358 | 9.6%(-1.67)#18,285 |
| 25. | 40258 | 7.8% | 9.2%(-1.41)#370 | 9.6%(-1.79)#18,660 |
| 26. | 40217 | 7.5% | 9.2%(-1.75)#386 | 9.6%(-2.13)#19,781 |
| 27. | 40272 | 7.0% | 9.2%(-2.21)#410 | 9.6%(-2.60)#21,169 |
| 28. | 40213 | 6.7% | 9.2%(-2.56)#423 | 9.6%(-2.94)#22,083 |
| 29. | 40202 | 6.0% | 9.2%(-3.26)#463 | 9.6%(-3.64)#23,746 |
| 30. | 40211 | 5.0% | 9.2%(-4.18)#504 | 9.6%(-4.57)#25,520 |
| 31. | 40212 | 3.8% | 9.2%(-5.37)#554 | 9.6%(-5.76)#27,233 |
1
Common Questions
What are the Top 10 Zip Codes with the Highest Percentage of Population Employed in Sales & Related in Louisville, KY?
Top 10 Zip Codes with the Highest Percentage of Population Employed in Sales & Related in Louisville, KY are:
What zip code has the Highest Percentage of Population Employed in Sales & Related in Louisville, KY?
40280 has the Highest Percentage of Population Employed in Sales & Related in Louisville, KY with 20.9%.
What is the Percentage of Population Employed in Sales & Related in Louisville, KY?
Percentage of Population Employed in Sales & Related in Louisville is 9.1%.
What is the Percentage of Population Employed in Sales & Related in Kentucky?
Percentage of Population Employed in Sales & Related in Kentucky is 9.2%.
What is the Percentage of Population Employed in Sales & Related in the United States?
Percentage of Population Employed in Sales & Related in the United States is 9.6%.