Zip Codes with the Highest Percentage of Population with a Degree in Science and Engineering in Louisville, KY
RELATED REPORTS & OPTIONS
Science and Engineering
Louisville
Compare Zip Codes
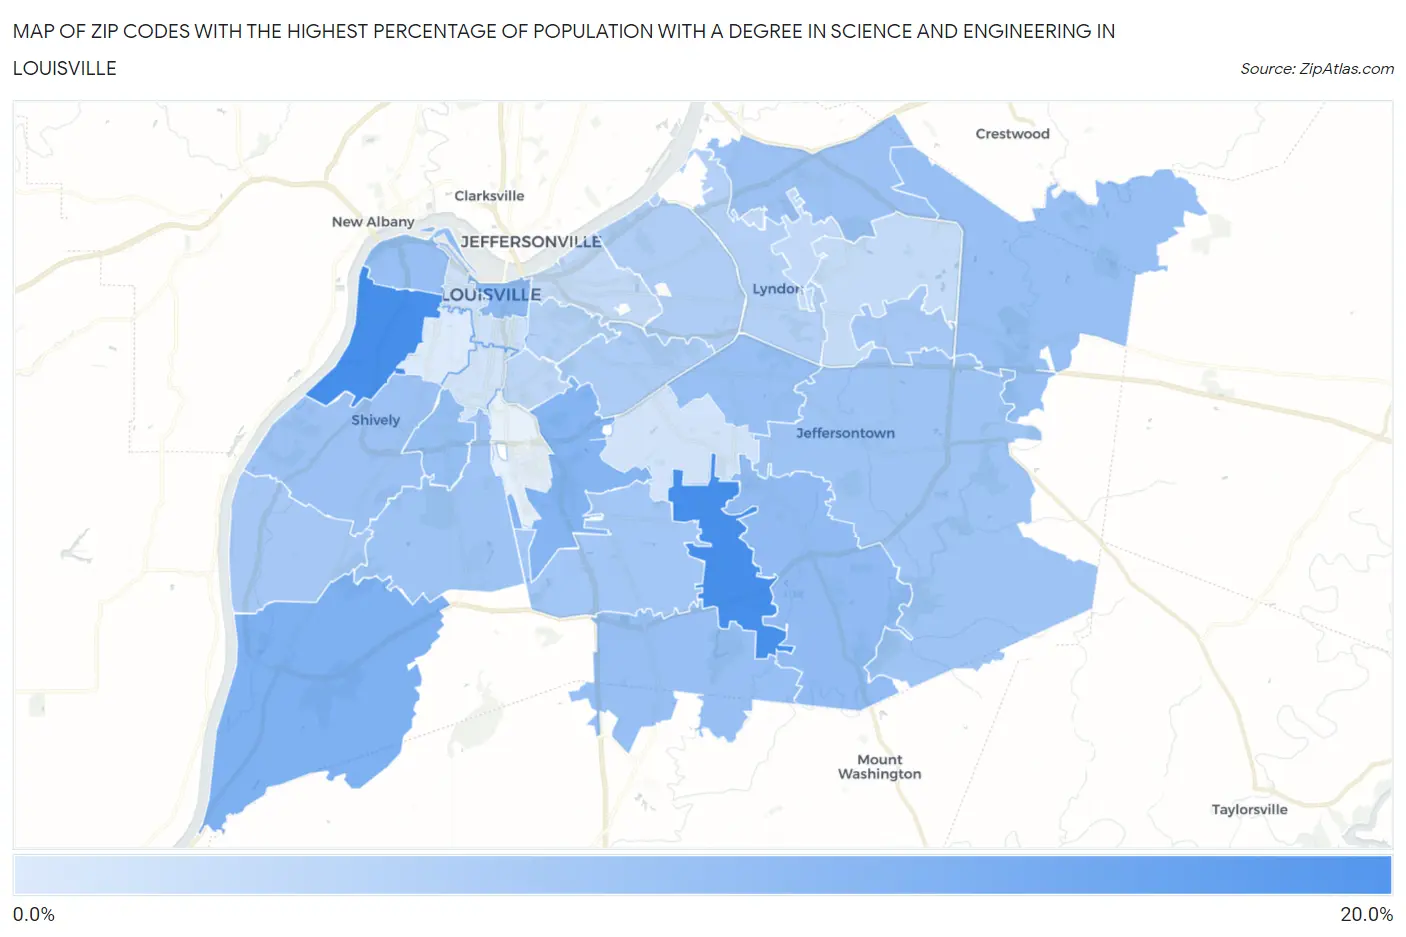
Map of Zip Codes with the Highest Percentage of Population with a Degree in Science and Engineering in Louisville
5.4%
19.7%
Zip Codes with the Highest Percentage of Population with a Degree in Science and Engineering in Louisville, KY
| Zip Code | % Graduates | vs State | vs National | |
| 1. | 40211 | 19.7% | 11.9%(+7.85)#144 | 9.8%(+9.92)#3,479 |
| 2. | 40228 | 19.7% | 11.9%(+7.80)#145 | 9.8%(+9.87)#3,488 |
| 3. | 40272 | 14.2% | 11.9%(+2.34)#219 | 9.8%(+4.41)#7,640 |
| 4. | 40213 | 13.5% | 11.9%(+1.69)#242 | 9.8%(+3.76)#8,445 |
| 5. | 40202 | 12.6% | 11.9%(+0.719)#274 | 9.8%(+2.79)#9,910 |
| 6. | 40291 | 12.3% | 11.9%(+0.497)#277 | 9.8%(+2.57)#10,278 |
| 7. | 40215 | 11.9% | 11.9%(+0.078)#290 | 9.8%(+2.15)#11,021 |
| 8. | 40229 | 11.9% | 11.9%(+0.023)#291 | 9.8%(+2.09)#11,129 |
| 9. | 40220 | 11.8% | 11.9%(-0.002)#293 | 9.8%(+2.07)#11,179 |
| 10. | 40212 | 11.8% | 11.9%(-0.019)#295 | 9.8%(+2.05)#11,212 |
| 11. | 40245 | 11.7% | 11.9%(-0.119)#300 | 9.8%(+1.95)#11,415 |
| 12. | 40216 | 11.6% | 11.9%(-0.285)#306 | 9.8%(+1.78)#11,713 |
| 13. | 40241 | 11.4% | 11.9%(-0.435)#313 | 9.8%(+1.63)#11,999 |
| 14. | 40299 | 11.2% | 11.9%(-0.643)#321 | 9.8%(+1.43)#12,427 |
| 15. | 40214 | 11.1% | 11.9%(-0.757)#325 | 9.8%(+1.31)#12,686 |
| 16. | 40219 | 10.6% | 11.9%(-1.21)#343 | 9.8%(+0.854)#13,671 |
| 17. | 40243 | 10.5% | 11.9%(-1.31)#346 | 9.8%(+0.755)#13,865 |
| 18. | 40258 | 10.5% | 11.9%(-1.33)#348 | 9.8%(+0.737)#13,929 |
| 19. | 40205 | 9.8% | 11.9%(-2.07)#364 | 9.8%(+0.001)#15,510 |
| 20. | 40207 | 9.6% | 11.9%(-2.27)#371 | 9.8%(-0.201)#15,970 |
| 21. | 40222 | 9.2% | 11.9%(-2.67)#377 | 9.8%(-0.600)#16,909 |
| 22. | 40204 | 9.1% | 11.9%(-2.75)#378 | 9.8%(-0.682)#17,068 |
| 23. | 40217 | 8.4% | 11.9%(-3.50)#397 | 9.8%(-1.43)#18,804 |
| 24. | 40242 | 8.0% | 11.9%(-3.87)#410 | 9.8%(-1.80)#19,689 |
| 25. | 40206 | 8.0% | 11.9%(-3.90)#411 | 9.8%(-1.83)#19,749 |
| 26. | 40223 | 7.7% | 11.9%(-4.14)#415 | 9.8%(-2.07)#20,265 |
| 27. | 40203 | 6.7% | 11.9%(-5.13)#429 | 9.8%(-3.06)#22,196 |
| 28. | 40218 | 6.5% | 11.9%(-5.39)#433 | 9.8%(-3.32)#22,646 |
| 29. | 40208 | 6.4% | 11.9%(-5.43)#438 | 9.8%(-3.36)#22,723 |
| 30. | 40210 | 5.4% | 11.9%(-6.43)#455 | 9.8%(-4.36)#24,222 |
1
Common Questions
What are the Top 10 Zip Codes with the Highest Percentage of Population with a Degree in Science and Engineering in Louisville, KY?
Top 10 Zip Codes with the Highest Percentage of Population with a Degree in Science and Engineering in Louisville, KY are:
What zip code has the Highest Percentage of Population with a Degree in Science and Engineering in Louisville, KY?
40211 has the Highest Percentage of Population with a Degree in Science and Engineering in Louisville, KY with 19.7%.
What is the Percentage of Population with a Degree in Science and Engineering in Louisville, KY?
Percentage of Population with a Degree in Science and Engineering in Louisville is 11.1%.
What is the Percentage of Population with a Degree in Science and Engineering in Kentucky?
Percentage of Population with a Degree in Science and Engineering in Kentucky is 11.9%.
What is the Percentage of Population with a Degree in Science and Engineering in the United States?
Percentage of Population with a Degree in Science and Engineering in the United States is 9.8%.