Zip Codes with the Highest Percentage of Population Employed in Computer & Mathematics in Louisville, KY

RELATED REPORTS & OPTIONS

Computer & Mathematics
Population
Families and Households
Female Fertility
Female Fertility (Unmarried)
Race (Community Size)
Race (Percentage)
Ancestry (Community Size)
AfghanAfricanAlaska NativeAlbanianAlsatianAmericanApacheArabArgentineanArmenianAssyrian / Chaldean / SyriacAustralianAustrianBahamianBangladeshiBarbadianBelgianBelizeanBhutaneseBlackfeetBolivianBrazilianBritishBritish West IndianBulgarianBurmeseCajunCambodianCanadianCape VerdeanCelticCentral AmericanCentral American IndianCherokeeChickasawChileanChippewaChoctawColombianComancheCosta RicanCreekCroatianCrowCubanCzechCzechoslovakianDanishDominicanDutchEastern EuropeanEcuadorianEgyptianEnglishEstonianEthiopianEuropeanFilipinoFinnishFrenchFrench American IndianFrench CanadianGermanGhanaianGreekGuamanian / ChamorroGuatemalanHaitianHonduranHungarianIcelanderIndian (Asian)IndonesianInupiatIranianIraqiIrishIroquoisIsraeliItalianJamaicanJapaneseJordanianKenyanKoreanLaotianLatvianLebaneseLiberianLithuanianLumbeeLuxembourgerMalaysianMexicanMexican American IndianMongolianMoroccanNative HawaiianNew ZealanderNicaraguanNigerianNorthern EuropeanNorwegianOsagePakistaniPalestinianPanamanianParaguayanPennsylvania GermanPeruvianPolishPortuguesePotawatomiPuebloPuerto RicanRomanianRussianSalvadoranSamoanScandinavianScotch-IrishScottishSeminoleSerbianSiouxSlavicSlovakSloveneSomaliSouth AfricanSouth AmericanSpaniardSpanishSri LankanSubsaharan AfricanSudaneseSwedishSwissSyrianThaiTohono O'OdhamTrinidadian and TobagonianTurkishU.S. Virgin IslanderUgandanUkrainianVenezuelanWelshWest IndianYugoslavian
Ancestry (Percentage)
AfghanAfricanAlaska NativeAlbanianAlsatianAmericanApacheArabArgentineanArmenianAssyrian / Chaldean / SyriacAustralianAustrianBahamianBangladeshiBarbadianBelgianBelizeanBhutaneseBlackfeetBolivianBrazilianBritishBritish West IndianBulgarianBurmeseCajunCambodianCanadianCape VerdeanCelticCentral AmericanCentral American IndianCherokeeChickasawChileanChippewaChoctawColombianComancheCosta RicanCreekCroatianCrowCubanCzechCzechoslovakianDanishDominicanDutchEastern EuropeanEcuadorianEgyptianEnglishEstonianEthiopianEuropeanFilipinoFinnishFrenchFrench American IndianFrench CanadianGermanGhanaianGreekGuamanian / ChamorroGuatemalanHaitianHonduranHungarianIcelanderIndian (Asian)IndonesianInupiatIranianIraqiIrishIroquoisIsraeliItalianJamaicanJapaneseJordanianKenyanKoreanLaotianLatvianLebaneseLiberianLithuanianLumbeeLuxembourgerMalaysianMexicanMexican American IndianMongolianMoroccanNative HawaiianNew ZealanderNicaraguanNigerianNorthern EuropeanNorwegianOsagePakistaniPalestinianPanamanianParaguayanPennsylvania GermanPeruvianPolishPortuguesePotawatomiPuebloPuerto RicanRomanianRussianSalvadoranSamoanScandinavianScotch-IrishScottishSeminoleSerbianSiouxSlavicSlovakSloveneSomaliSouth AfricanSouth AmericanSpaniardSpanishSri LankanSubsaharan AfricanSudaneseSwedishSwissSyrianThaiTohono O'OdhamTrinidadian and TobagonianTurkishU.S. Virgin IslanderUgandanUkrainianVenezuelanWelshWest IndianYugoslavian
Immigrant Origin (Total)
AfghanistanAfricaAlbaniaArgentinaAsiaAustraliaAustriaBangladeshBarbadosBelarusBelgiumBelizeBoliviaBosnia and HerzegovinaBrazilBulgariaBurma / MyanmarCambodiaCameroonCanadaCaribbeanCentral AmericaChileChinaColombiaCongoCosta RicaCroatiaCubaCzechoslovakiaDenmarkDominican RepublicEastern AfricaEastern AsiaEastern EuropeEcuadorEgyptEl SalvadorEnglandEritreaEthiopiaEuropeFranceGermanyGhanaGuatemalaGuyanaHaitiHondurasHong KongHungaryIndiaIndonesiaIranIraqIrelandIsraelItalyJamaicaJapanJordanKazakhstanKenyaKoreaKuwaitLaosLatin AmericaLebanonLiberiaLithuaniaMalaysiaMexicoMicronesiaMiddle AfricaMoldovaMoroccoNepalNetherlandsNicaraguaNigeriaNorthern AfricaNorthern EuropeNorwayOceaniaPakistanPanamaPeruPhilippinesPolandPortugalRomaniaRussiaSaudi ArabiaScotlandSenegalSerbiaSingaporeSomaliaSouth AfricaSouth AmericaSouth Central AsiaSouth Eastern AsiaSouthern EuropeSpainSri LankaSudanSwedenSyriaTaiwanThailandTrinidad and TobagoTurkeyUgandaUkraineUzbekistanVenezuelaVietnamWestern AfricaWestern AsiaWestern EuropeZaire
Immigrant Origin (Percentage)
AfghanistanAfricaAlbaniaArgentinaAsiaAustraliaAustriaBangladeshBarbadosBelarusBelgiumBelizeBoliviaBosnia and HerzegovinaBrazilBulgariaBurma / MyanmarCambodiaCameroonCanadaCaribbeanCentral AmericaChileChinaColombiaCongoCosta RicaCroatiaCubaCzechoslovakiaDenmarkDominican RepublicEastern AfricaEastern AsiaEastern EuropeEcuadorEgyptEl SalvadorEnglandEritreaEthiopiaEuropeFranceGermanyGhanaGuatemalaGuyanaHaitiHondurasHong KongHungaryIndiaIndonesiaIranIraqIrelandIsraelItalyJamaicaJapanJordanKazakhstanKenyaKoreaKuwaitLaosLatin AmericaLebanonLiberiaLithuaniaMalaysiaMexicoMicronesiaMiddle AfricaMoldovaMoroccoNepalNetherlandsNicaraguaNigeriaNorthern AfricaNorthern EuropeNorwayOceaniaPakistanPanamaPeruPhilippinesPolandPortugalRomaniaRussiaSaudi ArabiaScotlandSenegalSerbiaSingaporeSomaliaSouth AfricaSouth AmericaSouth Central AsiaSouth Eastern AsiaSouthern EuropeSpainSri LankaSudanSwedenSyriaTaiwanThailandTrinidad and TobagoTurkeyUgandaUkraineUzbekistanVenezuelaVietnamWestern AfricaWestern AsiaWestern EuropeZaire
Income
Income (Families)
Income (Households)
Poverty
Poverty (Families)
Unemployment
Employment Occupations
Employment Industries
Employer Class
Commute Time
Commute Means
School Enrollment
Education by Degree Field
Occupancy
Finances
Physical Characteristics
Louisville
Compare Zip Codes
Comparison Subject

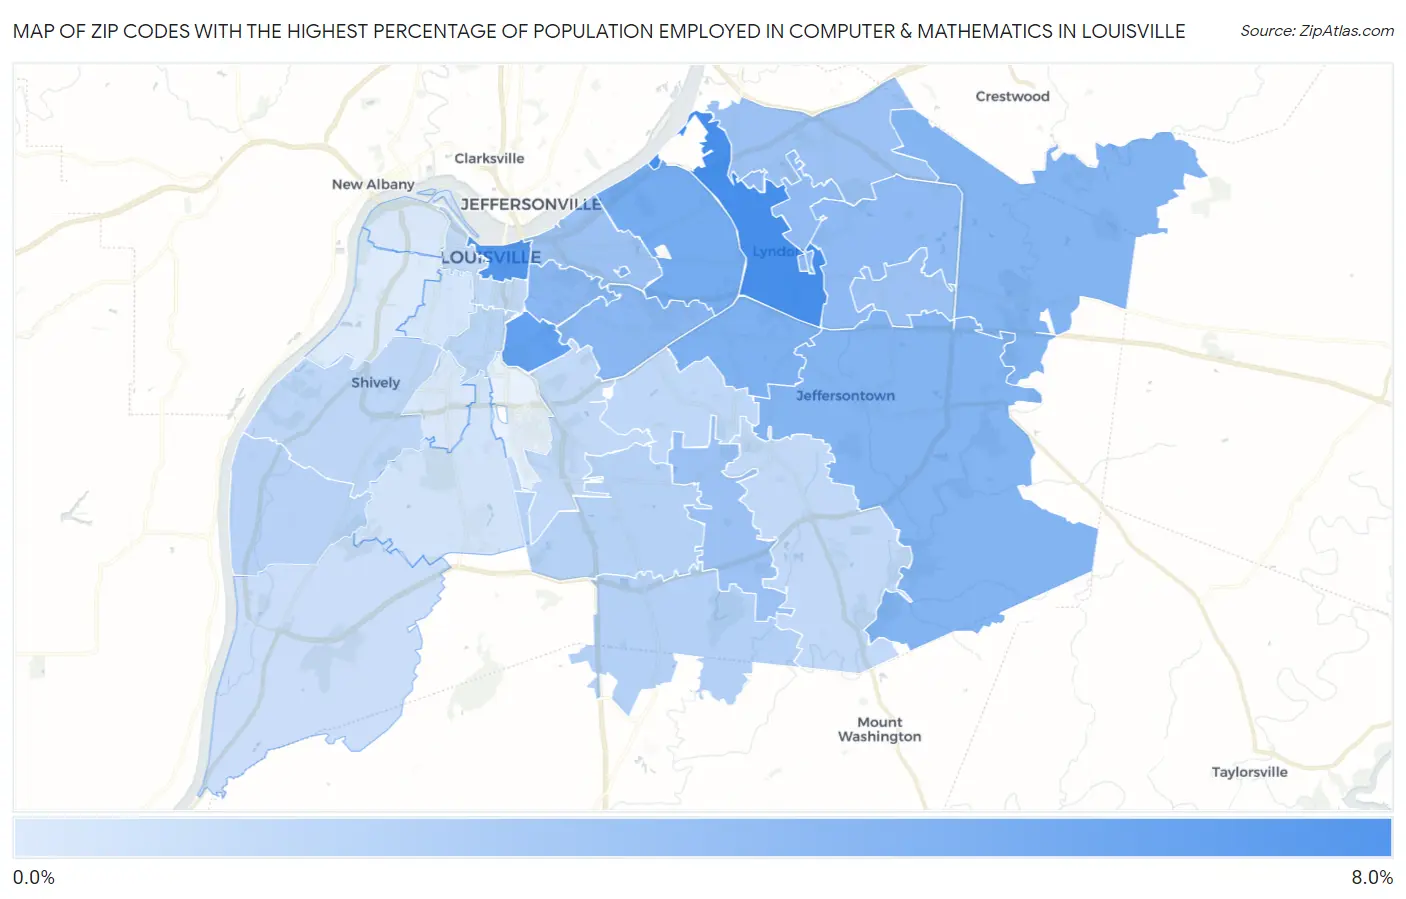
Map of Zip Codes with the Highest Percentage of Population Employed in Computer & Mathematics in Louisville

0.0%
8.0%
Zip Codes with the Highest Percentage of Population Employed in Computer & Mathematics in Louisville Map

Zip Codes with the Highest Percentage of Population Employed in Computer & Mathematics in Louisville, KY

Zip Code % Employed vs State vs National
1.402227.6%2.2%(+5.39)#103.5%(+4.03)#1,370
2.402026.9%2.2%(+4.70)#143.5%(+3.34)#1,699
3.402176.2%2.2%(+4.06)#193.5%(+2.69)#2,133
4.402075.4%2.2%(+3.23)#303.5%(+1.87)#2,904
5.402805.1%2.2%(+2.90)#333.5%(+1.54)#3,280
6.402205.0%2.2%(+2.81)#363.5%(+1.45)#3,381
7.402454.8%2.2%(+2.63)#413.5%(+1.27)#3,649
8.402994.7%2.2%(+2.56)#433.5%(+1.20)#3,754
9.402054.5%2.2%(+2.32)#473.5%(+0.957)#4,109
10.402044.5%2.2%(+2.29)#483.5%(+0.932)#4,161
11.402234.2%2.2%(+2.05)#583.5%(+0.686)#4,593
12.402424.1%2.2%(+1.92)#603.5%(+0.558)#4,850
13.402413.7%2.2%(+1.57)#733.5%(+0.206)#5,641
14.402433.7%2.2%(+1.49)#773.5%(+0.127)#5,834
15.402283.6%2.2%(+1.48)#803.5%(+0.115)#5,870
16.402063.6%2.2%(+1.44)#833.5%(+0.076)#5,956
17.402292.5%2.2%(+0.379)#1233.5%(-0.983)#9,450
18.402192.4%2.2%(+0.267)#1323.5%(-1.09)#9,920
19.402582.3%2.2%(+0.173)#1393.5%(-1.19)#10,282
20.402082.2%2.2%(+0.026)#1533.5%(-1.34)#10,930
21.402162.2%2.2%(+0.008)#1543.5%(-1.35)#11,026
22.402182.0%2.2%(-0.166)#1663.5%(-1.53)#11,812
23.402911.9%2.2%(-0.238)#1753.5%(-1.60)#12,172
24.402131.9%2.2%(-0.265)#1773.5%(-1.63)#12,305
25.402031.9%2.2%(-0.272)#1783.5%(-1.63)#12,343
26.402721.5%2.2%(-0.645)#2083.5%(-2.01)#14,259
27.402141.2%2.2%(-0.938)#2353.5%(-2.30)#15,995
28.402101.1%2.2%(-1.06)#2463.5%(-2.42)#16,725
29.402150.93%2.2%(-1.24)#2673.5%(-2.60)#17,840
30.402120.88%2.2%(-1.29)#2723.5%(-2.65)#18,181
31.402110.69%2.2%(-1.47)#2933.5%(-2.83)#19,315

Common Questions

What are the Top 10 Zip Codes with the Highest Percentage of Population Employed in Computer & Mathematics in Louisville, KY?
Top 10 Zip Codes with the Highest Percentage of Population Employed in Computer & Mathematics in Louisville, KY are:
#1
7.6%
#2
6.9%
#3
6.2%
#4
5.4%
#5
5.1%
#6
5.0%
#7
4.8%
#8
4.7%
#9
4.5%
#10
4.5%
What zip code has the Highest Percentage of Population Employed in Computer & Mathematics in Louisville, KY?
40222 has the Highest Percentage of Population Employed in Computer & Mathematics in Louisville, KY with 7.6%.
What is the Percentage of Population Employed in Computer & Mathematics in Louisville, KY?
Percentage of Population Employed in Computer & Mathematics in Louisville is 2.7%.
What is the Percentage of Population Employed in Computer & Mathematics in Kentucky?
Percentage of Population Employed in Computer & Mathematics in Kentucky is 2.2%.
What is the Percentage of Population Employed in Computer & Mathematics in the United States?
Percentage of Population Employed in Computer & Mathematics in the United States is 3.5%.