Zip Codes with the Highest Percentage of Population Employed in Community & Social Service in Louisville, KY
RELATED REPORTS & OPTIONS
Community & Social Service
Louisville
Compare Zip Codes
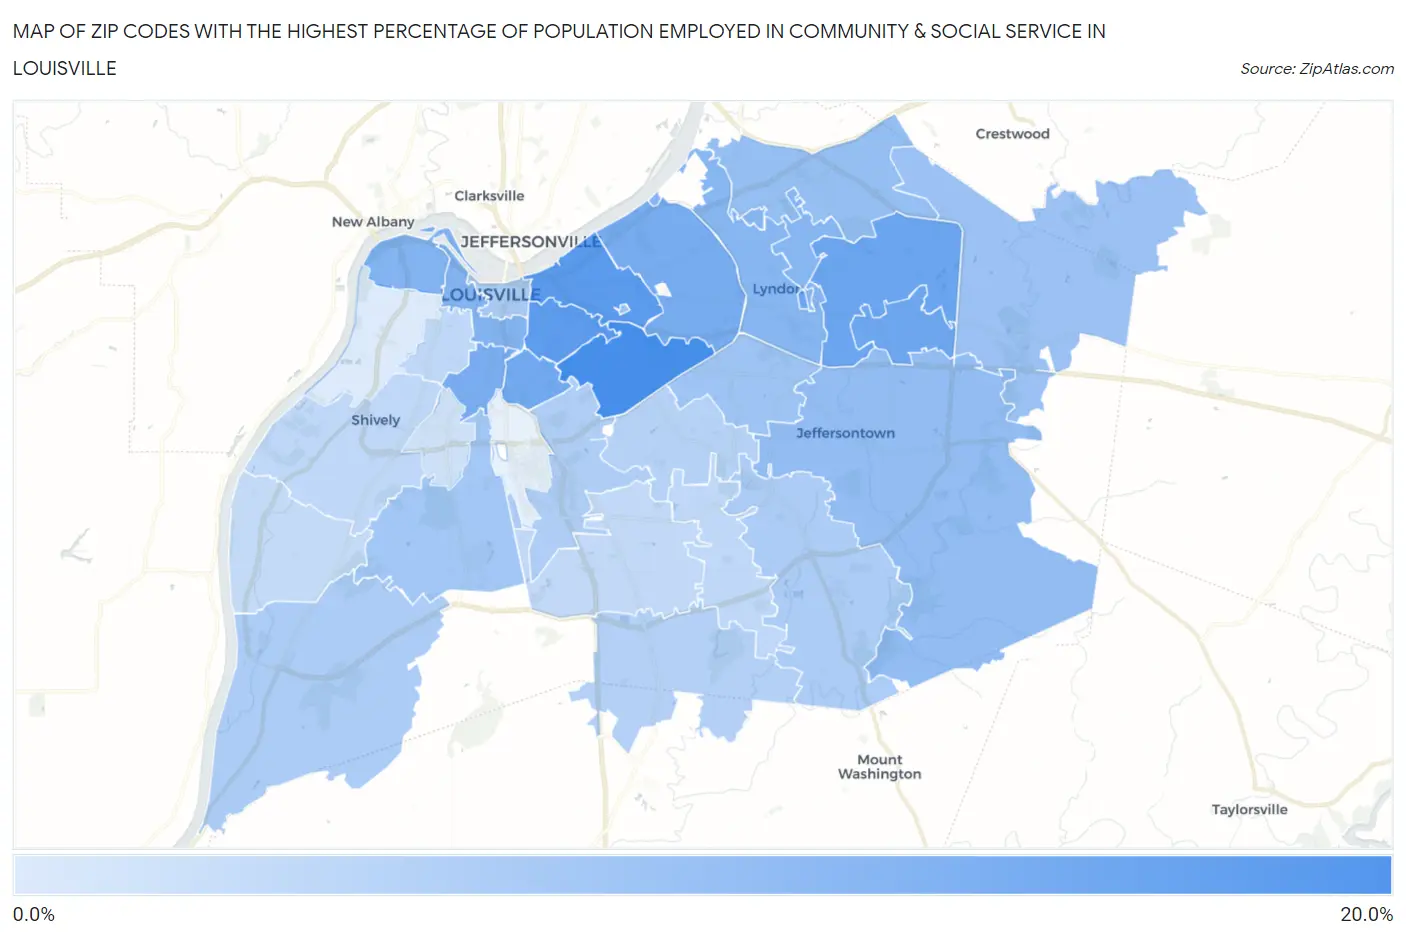
Map of Zip Codes with the Highest Percentage of Population Employed in Community & Social Service in Louisville
4.1%
19.7%
Zip Codes with the Highest Percentage of Population Employed in Community & Social Service in Louisville, KY
| Zip Code | % Employed | vs State | vs National | |
| 1. | 40205 | 19.7% | 10.3%(+9.38)#55 | 11.2%(+8.50)#2,123 |
| 2. | 40206 | 17.6% | 10.3%(+7.27)#77 | 11.2%(+6.38)#3,020 |
| 3. | 40204 | 17.3% | 10.3%(+6.95)#78 | 11.2%(+6.07)#3,195 |
| 4. | 40223 | 15.7% | 10.3%(+5.32)#105 | 11.2%(+4.44)#4,370 |
| 5. | 40243 | 15.4% | 10.3%(+5.05)#108 | 11.2%(+4.17)#4,630 |
| 6. | 40217 | 15.0% | 10.3%(+4.70)#114 | 11.2%(+3.82)#4,938 |
| 7. | 40207 | 14.4% | 10.3%(+4.08)#128 | 11.2%(+3.20)#5,569 |
| 8. | 40208 | 14.1% | 10.3%(+3.76)#136 | 11.2%(+2.88)#5,978 |
| 9. | 40203 | 13.3% | 10.3%(+2.93)#147 | 11.2%(+2.05)#7,135 |
| 10. | 40212 | 13.2% | 10.3%(+2.83)#149 | 11.2%(+1.95)#7,297 |
| 11. | 40222 | 12.8% | 10.3%(+2.46)#161 | 11.2%(+1.58)#7,901 |
| 12. | 40242 | 12.8% | 10.3%(+2.43)#164 | 11.2%(+1.55)#7,958 |
| 13. | 40299 | 11.5% | 10.3%(+1.12)#216 | 11.2%(+0.241)#10,556 |
| 14. | 40241 | 11.2% | 10.3%(+0.872)#224 | 11.2%(-0.011)#11,119 |
| 15. | 40245 | 10.9% | 10.3%(+0.564)#235 | 11.2%(-0.319)#11,907 |
| 16. | 40280 | 10.8% | 10.3%(+0.429)#241 | 11.2%(-0.455)#12,219 |
| 17. | 40220 | 10.4% | 10.3%(+0.091)#255 | 11.2%(-0.793)#13,060 |
| 18. | 40214 | 9.9% | 10.3%(-0.405)#277 | 11.2%(-1.29)#14,329 |
| 19. | 40202 | 9.1% | 10.3%(-1.27)#330 | 11.2%(-2.16)#16,667 |
| 20. | 40291 | 9.0% | 10.3%(-1.34)#334 | 11.2%(-2.23)#16,858 |
| 21. | 40272 | 8.9% | 10.3%(-1.40)#340 | 11.2%(-2.28)#17,001 |
| 22. | 40213 | 8.6% | 10.3%(-1.73)#356 | 11.2%(-2.62)#17,904 |
| 23. | 40229 | 8.2% | 10.3%(-2.10)#371 | 11.2%(-2.99)#18,944 |
| 24. | 40218 | 8.0% | 10.3%(-2.38)#389 | 11.2%(-3.26)#19,694 |
| 25. | 40216 | 7.1% | 10.3%(-3.19)#421 | 11.2%(-4.07)#21,799 |
| 26. | 40228 | 7.1% | 10.3%(-3.27)#429 | 11.2%(-4.15)#21,974 |
| 27. | 40210 | 7.0% | 10.3%(-3.30)#433 | 11.2%(-4.19)#22,071 |
| 28. | 40219 | 6.9% | 10.3%(-3.44)#439 | 11.2%(-4.32)#22,393 |
| 29. | 40258 | 6.6% | 10.3%(-3.78)#451 | 11.2%(-4.66)#23,143 |
| 30. | 40215 | 5.5% | 10.3%(-4.80)#493 | 11.2%(-5.68)#25,286 |
| 31. | 40211 | 4.1% | 10.3%(-6.20)#548 | 11.2%(-7.09)#27,399 |
1
Common Questions
What are the Top 10 Zip Codes with the Highest Percentage of Population Employed in Community & Social Service in Louisville, KY?
Top 10 Zip Codes with the Highest Percentage of Population Employed in Community & Social Service in Louisville, KY are:
What zip code has the Highest Percentage of Population Employed in Community & Social Service in Louisville, KY?
40205 has the Highest Percentage of Population Employed in Community & Social Service in Louisville, KY with 19.7%.
What is the Percentage of Population Employed in Community & Social Service in Louisville, KY?
Percentage of Population Employed in Community & Social Service in Louisville is 10.5%.
What is the Percentage of Population Employed in Community & Social Service in Kentucky?
Percentage of Population Employed in Community & Social Service in Kentucky is 10.3%.
What is the Percentage of Population Employed in Community & Social Service in the United States?
Percentage of Population Employed in Community & Social Service in the United States is 11.2%.