Zip Codes with the Lowest Poverty Level Among Children Under the Age of 5 in Louisville, KY

RELATED REPORTS & OPTIONS

Lowest Poverty | Child 0-5
Population
Families and Households
Female Fertility
Female Fertility (Unmarried)
Race (Community Size)
Race (Percentage)
Ancestry (Community Size)
AfghanAfricanAlaska NativeAlbanianAlsatianAmericanApacheArabArgentineanArmenianAssyrian / Chaldean / SyriacAustralianAustrianBahamianBangladeshiBarbadianBelgianBelizeanBhutaneseBlackfeetBolivianBrazilianBritishBritish West IndianBulgarianBurmeseCajunCambodianCanadianCape VerdeanCelticCentral AmericanCentral American IndianCherokeeChickasawChileanChippewaChoctawColombianComancheCosta RicanCreekCroatianCrowCubanCzechCzechoslovakianDanishDominicanDutchEastern EuropeanEcuadorianEgyptianEnglishEstonianEthiopianEuropeanFilipinoFinnishFrenchFrench American IndianFrench CanadianGermanGhanaianGreekGuamanian / ChamorroGuatemalanHaitianHonduranHungarianIcelanderIndian (Asian)IndonesianInupiatIranianIraqiIrishIroquoisIsraeliItalianJamaicanJapaneseJordanianKenyanKoreanLaotianLatvianLebaneseLiberianLithuanianLumbeeLuxembourgerMalaysianMexicanMexican American IndianMongolianMoroccanNative HawaiianNew ZealanderNicaraguanNigerianNorthern EuropeanNorwegianOsagePakistaniPalestinianPanamanianParaguayanPennsylvania GermanPeruvianPolishPortuguesePotawatomiPuebloPuerto RicanRomanianRussianSalvadoranSamoanScandinavianScotch-IrishScottishSeminoleSerbianSiouxSlavicSlovakSloveneSomaliSouth AfricanSouth AmericanSpaniardSpanishSri LankanSubsaharan AfricanSudaneseSwedishSwissSyrianThaiTohono O'OdhamTrinidadian and TobagonianTurkishU.S. Virgin IslanderUgandanUkrainianVenezuelanWelshWest IndianYugoslavian
Ancestry (Percentage)
AfghanAfricanAlaska NativeAlbanianAlsatianAmericanApacheArabArgentineanArmenianAssyrian / Chaldean / SyriacAustralianAustrianBahamianBangladeshiBarbadianBelgianBelizeanBhutaneseBlackfeetBolivianBrazilianBritishBritish West IndianBulgarianBurmeseCajunCambodianCanadianCape VerdeanCelticCentral AmericanCentral American IndianCherokeeChickasawChileanChippewaChoctawColombianComancheCosta RicanCreekCroatianCrowCubanCzechCzechoslovakianDanishDominicanDutchEastern EuropeanEcuadorianEgyptianEnglishEstonianEthiopianEuropeanFilipinoFinnishFrenchFrench American IndianFrench CanadianGermanGhanaianGreekGuamanian / ChamorroGuatemalanHaitianHonduranHungarianIcelanderIndian (Asian)IndonesianInupiatIranianIraqiIrishIroquoisIsraeliItalianJamaicanJapaneseJordanianKenyanKoreanLaotianLatvianLebaneseLiberianLithuanianLumbeeLuxembourgerMalaysianMexicanMexican American IndianMongolianMoroccanNative HawaiianNew ZealanderNicaraguanNigerianNorthern EuropeanNorwegianOsagePakistaniPalestinianPanamanianParaguayanPennsylvania GermanPeruvianPolishPortuguesePotawatomiPuebloPuerto RicanRomanianRussianSalvadoranSamoanScandinavianScotch-IrishScottishSeminoleSerbianSiouxSlavicSlovakSloveneSomaliSouth AfricanSouth AmericanSpaniardSpanishSri LankanSubsaharan AfricanSudaneseSwedishSwissSyrianThaiTohono O'OdhamTrinidadian and TobagonianTurkishU.S. Virgin IslanderUgandanUkrainianVenezuelanWelshWest IndianYugoslavian
Immigrant Origin (Total)
AfghanistanAfricaAlbaniaArgentinaAsiaAustraliaAustriaBangladeshBarbadosBelarusBelgiumBelizeBoliviaBosnia and HerzegovinaBrazilBulgariaBurma / MyanmarCambodiaCameroonCanadaCaribbeanCentral AmericaChileChinaColombiaCongoCosta RicaCroatiaCubaCzechoslovakiaDenmarkDominican RepublicEastern AfricaEastern AsiaEastern EuropeEcuadorEgyptEl SalvadorEnglandEritreaEthiopiaEuropeFranceGermanyGhanaGuatemalaGuyanaHaitiHondurasHong KongHungaryIndiaIndonesiaIranIraqIrelandIsraelItalyJamaicaJapanJordanKazakhstanKenyaKoreaKuwaitLaosLatin AmericaLebanonLiberiaLithuaniaMalaysiaMexicoMicronesiaMiddle AfricaMoldovaMoroccoNepalNetherlandsNicaraguaNigeriaNorthern AfricaNorthern EuropeNorwayOceaniaPakistanPanamaPeruPhilippinesPolandPortugalRomaniaRussiaSaudi ArabiaScotlandSenegalSerbiaSingaporeSomaliaSouth AfricaSouth AmericaSouth Central AsiaSouth Eastern AsiaSouthern EuropeSpainSri LankaSudanSwedenSyriaTaiwanThailandTrinidad and TobagoTurkeyUgandaUkraineUzbekistanVenezuelaVietnamWestern AfricaWestern AsiaWestern EuropeZaire
Immigrant Origin (Percentage)
AfghanistanAfricaAlbaniaArgentinaAsiaAustraliaAustriaBangladeshBarbadosBelarusBelgiumBelizeBoliviaBosnia and HerzegovinaBrazilBulgariaBurma / MyanmarCambodiaCameroonCanadaCaribbeanCentral AmericaChileChinaColombiaCongoCosta RicaCroatiaCubaCzechoslovakiaDenmarkDominican RepublicEastern AfricaEastern AsiaEastern EuropeEcuadorEgyptEl SalvadorEnglandEritreaEthiopiaEuropeFranceGermanyGhanaGuatemalaGuyanaHaitiHondurasHong KongHungaryIndiaIndonesiaIranIraqIrelandIsraelItalyJamaicaJapanJordanKazakhstanKenyaKoreaKuwaitLaosLatin AmericaLebanonLiberiaLithuaniaMalaysiaMexicoMicronesiaMiddle AfricaMoldovaMoroccoNepalNetherlandsNicaraguaNigeriaNorthern AfricaNorthern EuropeNorwayOceaniaPakistanPanamaPeruPhilippinesPolandPortugalRomaniaRussiaSaudi ArabiaScotlandSenegalSerbiaSingaporeSomaliaSouth AfricaSouth AmericaSouth Central AsiaSouth Eastern AsiaSouthern EuropeSpainSri LankaSudanSwedenSyriaTaiwanThailandTrinidad and TobagoTurkeyUgandaUkraineUzbekistanVenezuelaVietnamWestern AfricaWestern AsiaWestern EuropeZaire
Income
Income (Families)
Income (Households)
Poverty
Poverty (Families)
Unemployment
Employment Occupations
Employment Industries
Employer Class
Commute Time
Commute Means
School Enrollment
Education by Degree Field
Occupancy
Finances
Physical Characteristics
Louisville
Compare Zip Codes
Comparison Subject

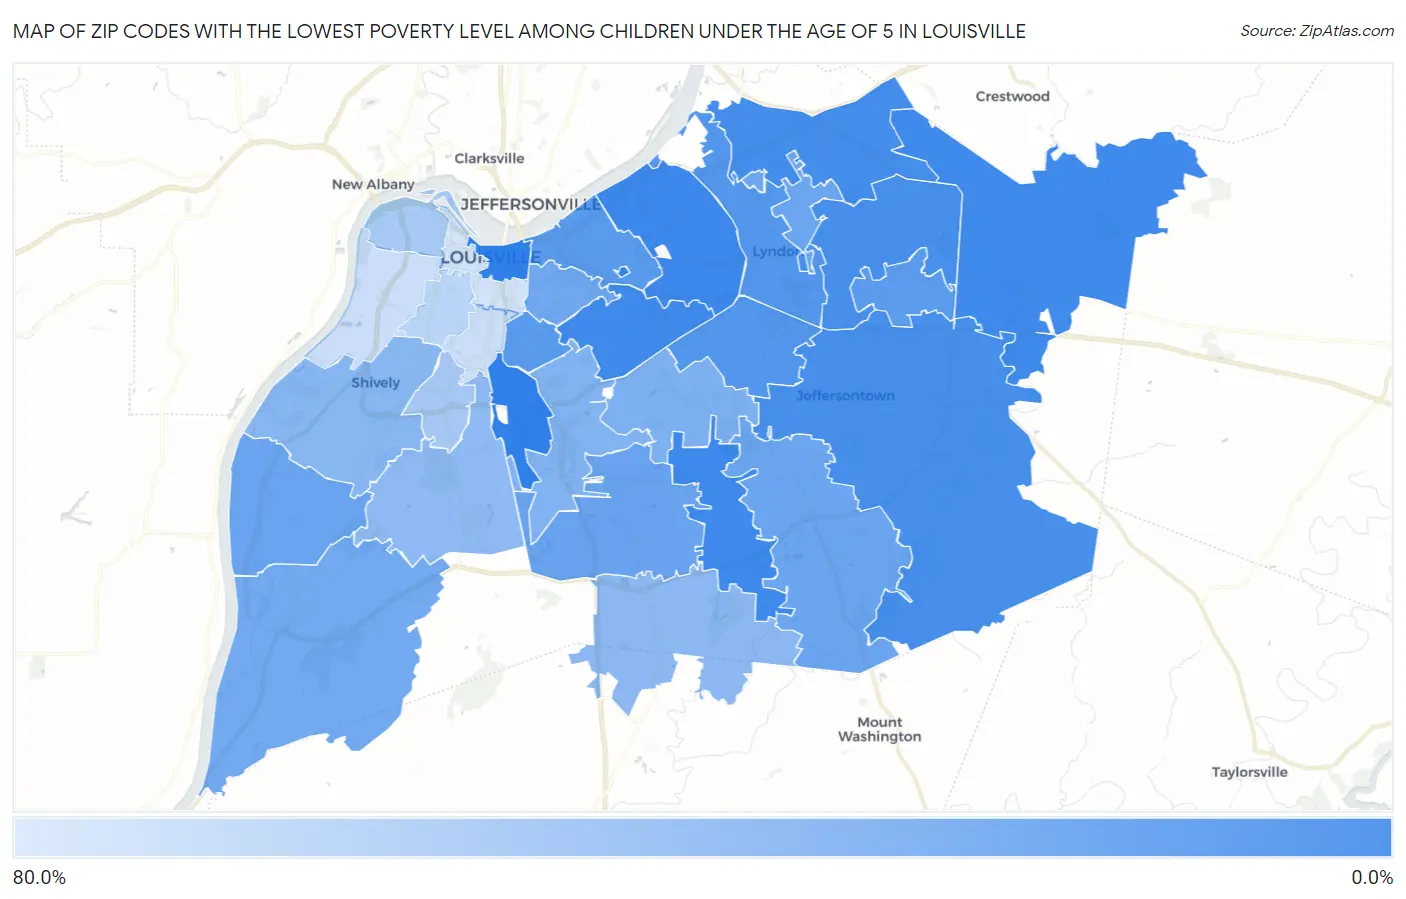
Map of Zip Codes with the Lowest Poverty Level Among Children Under the Age of 5 in Louisville

80.0%
0.0%
Zip Codes with the Lowest Poverty Level Among Children Under the Age of 5 in Louisville Map

Zip Codes with the Lowest Poverty Level Among Children Under the Age of 5 in Louisville, KY

Zip Code Child Poverty vs State vs National
1.402070.86%23.3%(-22.5)#118.1%(-17.2)#212
2.402281.6%23.3%(-21.7)#418.1%(-16.4)#605
3.402052.3%23.3%(-21.1)#918.1%(-15.8)#1,016
4.402452.4%23.3%(-20.9)#1018.1%(-15.6)#1,136
5.402414.5%23.3%(-18.8)#3118.1%(-13.6)#2,555
6.402234.6%23.3%(-18.7)#3218.1%(-13.4)#2,659
7.402994.9%23.3%(-18.4)#3718.1%(-13.1)#2,859
8.402209.3%23.3%(-14.0)#6818.1%(-8.72)#5,847
9.402229.5%23.3%(-13.8)#6918.1%(-8.59)#5,927
10.4021711.5%23.3%(-11.8)#8418.1%(-6.58)#7,138
11.4020612.1%23.3%(-11.2)#9418.1%(-5.98)#7,510
12.4024312.4%23.3%(-11.0)#9818.1%(-5.70)#7,680
13.4021917.5%23.3%(-5.86)#14218.1%(-0.597)#10,466
14.4025818.0%23.3%(-5.32)#14418.1%(-0.063)#10,714
15.4024218.7%23.3%(-4.60)#14918.1%(+0.657)#11,038
16.4029118.8%23.3%(-4.49)#15018.1%(+0.772)#11,097
17.4020421.0%23.3%(-2.30)#17518.1%(+2.96)#12,083
18.4027222.3%23.3%(-1.04)#18318.1%(+4.22)#12,618
19.4021825.5%23.3%(+2.22)#21418.1%(+7.48)#13,865
20.4021327.7%23.3%(+4.37)#23018.1%(+9.63)#14,612
21.4021630.4%23.3%(+7.07)#24818.1%(+12.3)#15,432
22.4022932.7%23.3%(+9.33)#26418.1%(+14.6)#15,992
23.4021434.3%23.3%(+11.0)#27418.1%(+16.3)#16,455
24.4021545.1%23.3%(+21.8)#32318.1%(+27.0)#18,504
25.4021246.4%23.3%(+23.1)#32818.1%(+28.3)#18,678
26.4021055.9%23.3%(+32.6)#36418.1%(+37.8)#19,676
27.4020864.2%23.3%(+40.9)#38418.1%(+46.2)#20,236
28.4021164.3%23.3%(+40.9)#38518.1%(+46.2)#20,237
29.4020368.5%23.3%(+45.2)#39418.1%(+50.5)#20,463

Common Questions

What are the Top 10 Zip Codes with the Lowest Poverty Level Among Children Under the Age of 5 in Louisville, KY?
Top 10 Zip Codes with the Lowest Poverty Level Among Children Under the Age of 5 in Louisville, KY are:
#1
0.0%
#2
0.0%
#3
0.0%
#4
0.86%
#5
1.6%
#6
2.3%
#7
2.4%
#8
4.5%
#9
4.6%
#10
4.9%
What zip code has the Lowest Poverty Level Among Children Under the Age of 5 in Louisville, KY?
40207 has the Lowest Poverty Level Among Children Under the Age of 5 in Louisville, KY with 0.86%.
What is the Poverty Level Among Children Under the Age of 5 in Louisville, KY?
Poverty Level Among Children Under the Age of 5 in Louisville is 24.7%.
What is the Poverty Level Among Children Under the Age of 5 in Kentucky?
Poverty Level Among Children Under the Age of 5 in Kentucky is 23.3%.
What is the Poverty Level Among Children Under the Age of 5 in the United States?
Poverty Level Among Children Under the Age of 5 in the United States is 18.1%.