Zip Codes with the Highest Percentage of Population Employed in Information in Louisville, KY

RELATED REPORTS & OPTIONS

Information & Technology
Population
Families and Households
Female Fertility
Female Fertility (Unmarried)
Race (Community Size)
Race (Percentage)
Ancestry (Community Size)
AfghanAfricanAlaska NativeAlbanianAlsatianAmericanApacheArabArgentineanArmenianAssyrian / Chaldean / SyriacAustralianAustrianBahamianBangladeshiBarbadianBelgianBelizeanBhutaneseBlackfeetBolivianBrazilianBritishBritish West IndianBulgarianBurmeseCajunCambodianCanadianCape VerdeanCelticCentral AmericanCentral American IndianCherokeeChickasawChileanChippewaChoctawColombianComancheCosta RicanCreekCroatianCrowCubanCzechCzechoslovakianDanishDominicanDutchEastern EuropeanEcuadorianEgyptianEnglishEstonianEthiopianEuropeanFilipinoFinnishFrenchFrench American IndianFrench CanadianGermanGhanaianGreekGuamanian / ChamorroGuatemalanHaitianHonduranHungarianIcelanderIndian (Asian)IndonesianInupiatIranianIraqiIrishIroquoisIsraeliItalianJamaicanJapaneseJordanianKenyanKoreanLaotianLatvianLebaneseLiberianLithuanianLumbeeLuxembourgerMalaysianMexicanMexican American IndianMongolianMoroccanNative HawaiianNew ZealanderNicaraguanNigerianNorthern EuropeanNorwegianOsagePakistaniPalestinianPanamanianParaguayanPennsylvania GermanPeruvianPolishPortuguesePotawatomiPuebloPuerto RicanRomanianRussianSalvadoranSamoanScandinavianScotch-IrishScottishSeminoleSerbianSiouxSlavicSlovakSloveneSomaliSouth AfricanSouth AmericanSpaniardSpanishSri LankanSubsaharan AfricanSudaneseSwedishSwissSyrianThaiTohono O'OdhamTrinidadian and TobagonianTurkishU.S. Virgin IslanderUgandanUkrainianVenezuelanWelshWest IndianYugoslavian
Ancestry (Percentage)
AfghanAfricanAlaska NativeAlbanianAlsatianAmericanApacheArabArgentineanArmenianAssyrian / Chaldean / SyriacAustralianAustrianBahamianBangladeshiBarbadianBelgianBelizeanBhutaneseBlackfeetBolivianBrazilianBritishBritish West IndianBulgarianBurmeseCajunCambodianCanadianCape VerdeanCelticCentral AmericanCentral American IndianCherokeeChickasawChileanChippewaChoctawColombianComancheCosta RicanCreekCroatianCrowCubanCzechCzechoslovakianDanishDominicanDutchEastern EuropeanEcuadorianEgyptianEnglishEstonianEthiopianEuropeanFilipinoFinnishFrenchFrench American IndianFrench CanadianGermanGhanaianGreekGuamanian / ChamorroGuatemalanHaitianHonduranHungarianIcelanderIndian (Asian)IndonesianInupiatIranianIraqiIrishIroquoisIsraeliItalianJamaicanJapaneseJordanianKenyanKoreanLaotianLatvianLebaneseLiberianLithuanianLumbeeLuxembourgerMalaysianMexicanMexican American IndianMongolianMoroccanNative HawaiianNew ZealanderNicaraguanNigerianNorthern EuropeanNorwegianOsagePakistaniPalestinianPanamanianParaguayanPennsylvania GermanPeruvianPolishPortuguesePotawatomiPuebloPuerto RicanRomanianRussianSalvadoranSamoanScandinavianScotch-IrishScottishSeminoleSerbianSiouxSlavicSlovakSloveneSomaliSouth AfricanSouth AmericanSpaniardSpanishSri LankanSubsaharan AfricanSudaneseSwedishSwissSyrianThaiTohono O'OdhamTrinidadian and TobagonianTurkishU.S. Virgin IslanderUgandanUkrainianVenezuelanWelshWest IndianYugoslavian
Immigrant Origin (Total)
AfghanistanAfricaAlbaniaArgentinaAsiaAustraliaAustriaBangladeshBarbadosBelarusBelgiumBelizeBoliviaBosnia and HerzegovinaBrazilBulgariaBurma / MyanmarCambodiaCameroonCanadaCaribbeanCentral AmericaChileChinaColombiaCongoCosta RicaCroatiaCubaCzechoslovakiaDenmarkDominican RepublicEastern AfricaEastern AsiaEastern EuropeEcuadorEgyptEl SalvadorEnglandEritreaEthiopiaEuropeFranceGermanyGhanaGuatemalaGuyanaHaitiHondurasHong KongHungaryIndiaIndonesiaIranIraqIrelandIsraelItalyJamaicaJapanJordanKazakhstanKenyaKoreaKuwaitLaosLatin AmericaLebanonLiberiaLithuaniaMalaysiaMexicoMicronesiaMiddle AfricaMoldovaMoroccoNepalNetherlandsNicaraguaNigeriaNorthern AfricaNorthern EuropeNorwayOceaniaPakistanPanamaPeruPhilippinesPolandPortugalRomaniaRussiaSaudi ArabiaScotlandSenegalSerbiaSingaporeSomaliaSouth AfricaSouth AmericaSouth Central AsiaSouth Eastern AsiaSouthern EuropeSpainSri LankaSudanSwedenSyriaTaiwanThailandTrinidad and TobagoTurkeyUgandaUkraineUzbekistanVenezuelaVietnamWestern AfricaWestern AsiaWestern EuropeZaire
Immigrant Origin (Percentage)
AfghanistanAfricaAlbaniaArgentinaAsiaAustraliaAustriaBangladeshBarbadosBelarusBelgiumBelizeBoliviaBosnia and HerzegovinaBrazilBulgariaBurma / MyanmarCambodiaCameroonCanadaCaribbeanCentral AmericaChileChinaColombiaCongoCosta RicaCroatiaCubaCzechoslovakiaDenmarkDominican RepublicEastern AfricaEastern AsiaEastern EuropeEcuadorEgyptEl SalvadorEnglandEritreaEthiopiaEuropeFranceGermanyGhanaGuatemalaGuyanaHaitiHondurasHong KongHungaryIndiaIndonesiaIranIraqIrelandIsraelItalyJamaicaJapanJordanKazakhstanKenyaKoreaKuwaitLaosLatin AmericaLebanonLiberiaLithuaniaMalaysiaMexicoMicronesiaMiddle AfricaMoldovaMoroccoNepalNetherlandsNicaraguaNigeriaNorthern AfricaNorthern EuropeNorwayOceaniaPakistanPanamaPeruPhilippinesPolandPortugalRomaniaRussiaSaudi ArabiaScotlandSenegalSerbiaSingaporeSomaliaSouth AfricaSouth AmericaSouth Central AsiaSouth Eastern AsiaSouthern EuropeSpainSri LankaSudanSwedenSyriaTaiwanThailandTrinidad and TobagoTurkeyUgandaUkraineUzbekistanVenezuelaVietnamWestern AfricaWestern AsiaWestern EuropeZaire
Income
Income (Families)
Income (Households)
Poverty
Poverty (Families)
Unemployment
Employment Occupations
Employment Industries
Employer Class
Commute Time
Commute Means
School Enrollment
Education by Degree Field
Occupancy
Finances
Physical Characteristics
Louisville
Compare Zip Codes
Comparison Subject

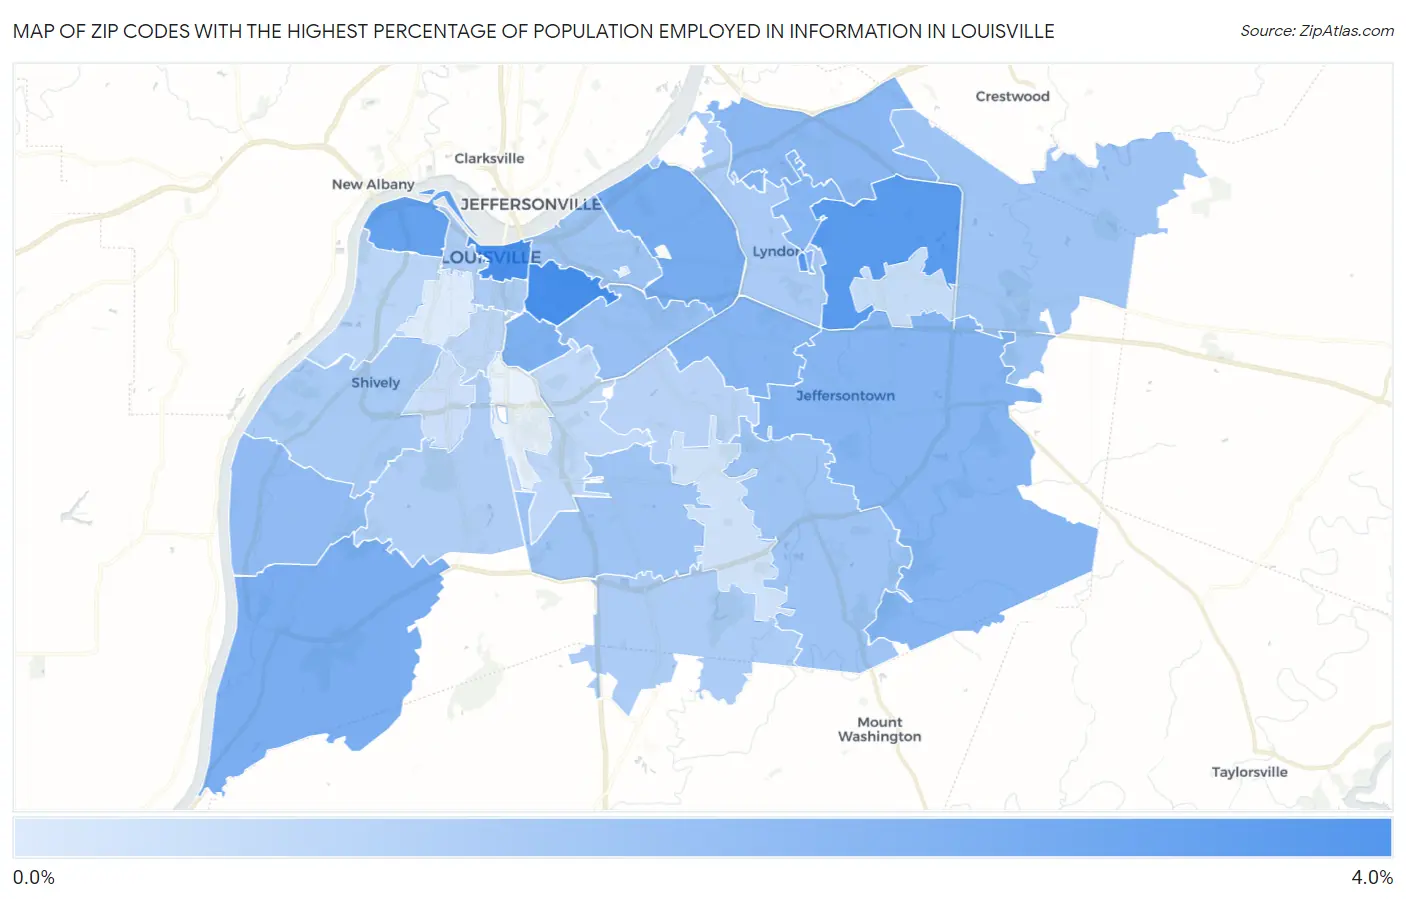
Map of Zip Codes with the Highest Percentage of Population Employed in Information in Louisville

0.0%
4.0%
Zip Codes with the Highest Percentage of Population Employed in Information in Louisville Map

Zip Codes with the Highest Percentage of Population Employed in Information in Louisville, KY

Zip Code % Employed vs State vs National
1.402043.6%1.4%(+2.25)#541.9%(+1.74)#2,440
2.402023.6%1.4%(+2.22)#551.9%(+1.70)#2,485
3.402233.3%1.4%(+1.88)#671.9%(+1.37)#3,017
4.402123.0%1.4%(+1.60)#741.9%(+1.08)#3,583
5.402072.5%1.4%(+1.16)#911.9%(+0.645)#4,826
6.402722.5%1.4%(+1.13)#941.9%(+0.615)#4,921
7.402172.4%1.4%(+1.03)#1011.9%(+0.512)#5,273
8.402992.3%1.4%(+0.896)#1131.9%(+0.379)#5,781
9.402202.3%1.4%(+0.884)#1141.9%(+0.367)#5,821
10.402422.2%1.4%(+0.868)#1161.9%(+0.351)#5,888
11.402412.2%1.4%(+0.781)#1201.9%(+0.264)#6,304
12.402582.0%1.4%(+0.598)#1331.9%(+0.082)#7,225
13.402051.9%1.4%(+0.480)#1381.9%(-0.037)#7,919
14.402061.7%1.4%(+0.338)#1491.9%(-0.179)#8,831
15.402911.7%1.4%(+0.323)#1501.9%(-0.194)#8,946
16.402451.7%1.4%(+0.319)#1511.9%(-0.198)#8,977
17.402191.7%1.4%(+0.306)#1551.9%(-0.211)#9,061
18.402161.5%1.4%(+0.122)#1721.9%(-0.395)#10,364
19.402221.4%1.4%(+0.050)#1861.9%(-0.467)#10,937
20.402291.4%1.4%(+0.025)#1941.9%(-0.492)#11,147
21.402031.4%1.4%(-0.001)#1951.9%(-0.518)#11,330
22.402141.3%1.4%(-0.035)#1981.9%(-0.552)#11,604
23.402181.2%1.4%(-0.231)#2321.9%(-0.748)#13,383
24.402111.1%1.4%(-0.290)#2401.9%(-0.807)#13,905
25.402081.1%1.4%(-0.325)#2461.9%(-0.842)#14,189
26.402131.0%1.4%(-0.367)#2501.9%(-0.883)#14,548
27.402430.82%1.4%(-0.557)#2831.9%(-1.07)#16,334
28.402150.76%1.4%(-0.620)#2951.9%(-1.14)#16,918
29.402280.63%1.4%(-0.753)#3121.9%(-1.27)#18,143
30.402100.34%1.4%(-1.04)#3431.9%(-1.56)#20,509

Common Questions

What are the Top 10 Zip Codes with the Highest Percentage of Population Employed in Information in Louisville, KY?
Top 10 Zip Codes with the Highest Percentage of Population Employed in Information in Louisville, KY are:
#1
3.6%
#2
3.6%
#3
3.3%
#4
3.0%
#5
2.5%
#6
2.5%
#7
2.4%
#8
2.3%
#9
2.3%
#10
2.2%
What zip code has the Highest Percentage of Population Employed in Information in Louisville, KY?
40204 has the Highest Percentage of Population Employed in Information in Louisville, KY with 3.6%.
What is the Percentage of Population Employed in Information in Louisville, KY?
Percentage of Population Employed in Information in Louisville is 1.7%.
What is the Percentage of Population Employed in Information in Kentucky?
Percentage of Population Employed in Information in Kentucky is 1.4%.
What is the Percentage of Population Employed in Information in the United States?
Percentage of Population Employed in Information in the United States is 1.9%.