Zip Codes with the Highest Percentage of Population with a Degree in Social Sciences in Louisville, KY
RELATED REPORTS & OPTIONS
Social Sciences
Louisville
Compare Zip Codes
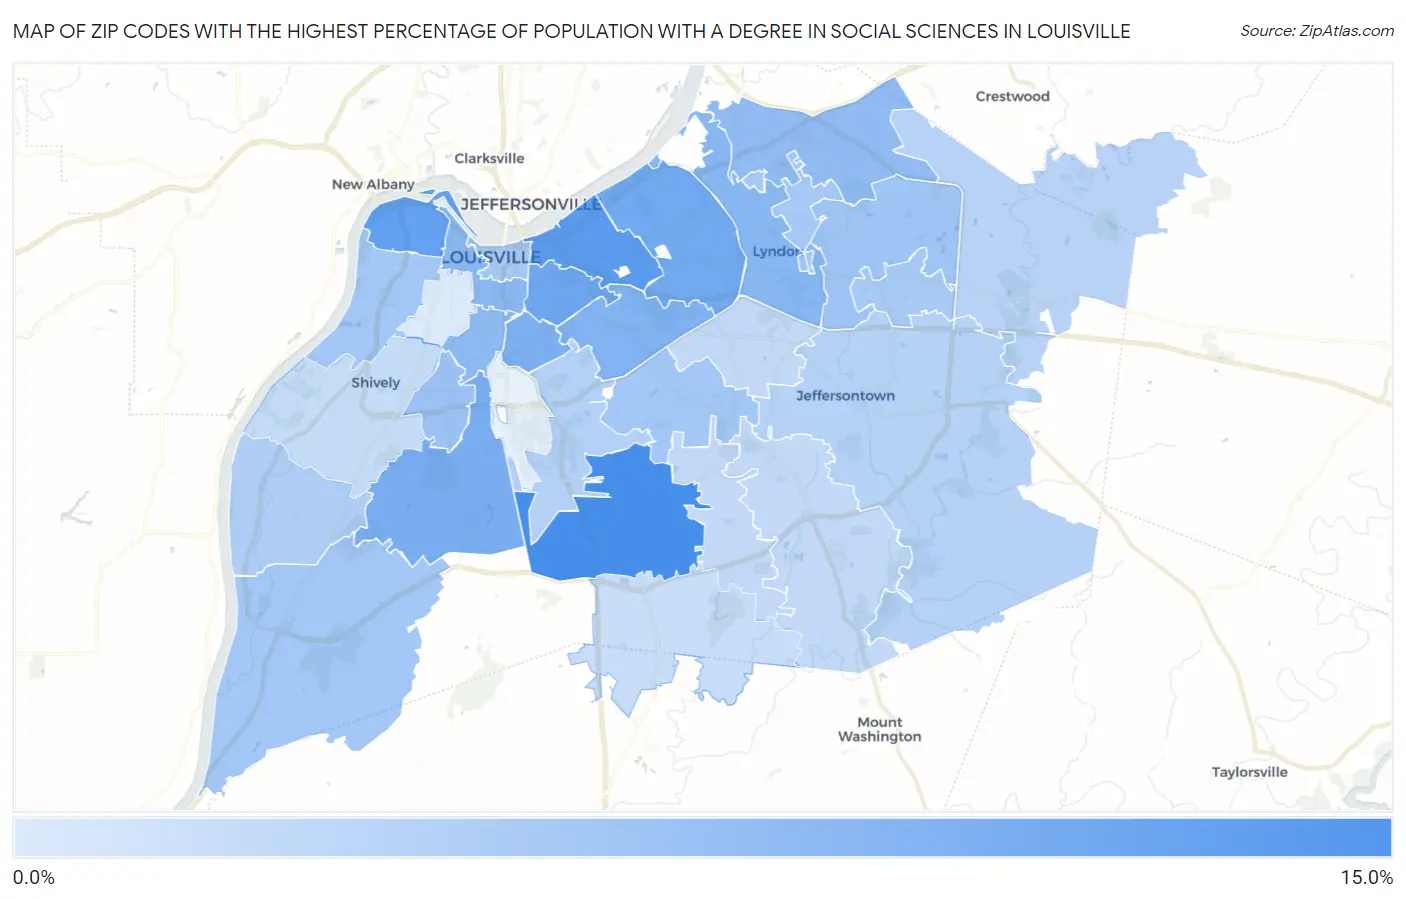
Map of Zip Codes with the Highest Percentage of Population with a Degree in Social Sciences in Louisville
2.3%
13.7%
Zip Codes with the Highest Percentage of Population with a Degree in Social Sciences in Louisville, KY
| Zip Code | % Graduates | vs State | vs National | |
| 1. | 40219 | 13.7% | 6.0%(+7.70)#45 | 8.1%(+5.62)#2,483 |
| 2. | 40206 | 12.1% | 6.0%(+6.12)#56 | 8.1%(+4.05)#3,412 |
| 3. | 40212 | 11.5% | 6.0%(+5.55)#58 | 8.1%(+3.48)#3,880 |
| 4. | 40204 | 10.6% | 6.0%(+4.63)#68 | 8.1%(+2.55)#4,791 |
| 5. | 40207 | 10.2% | 6.0%(+4.20)#73 | 8.1%(+2.13)#5,305 |
| 6. | 40214 | 9.8% | 6.0%(+3.77)#77 | 8.1%(+1.70)#5,853 |
| 7. | 40217 | 9.6% | 6.0%(+3.56)#80 | 8.1%(+1.49)#6,140 |
| 8. | 40205 | 9.2% | 6.0%(+3.20)#83 | 8.1%(+1.12)#6,637 |
| 9. | 40222 | 8.6% | 6.0%(+2.65)#93 | 8.1%(+0.572)#7,530 |
| 10. | 40203 | 8.4% | 6.0%(+2.44)#96 | 8.1%(+0.361)#7,945 |
| 11. | 40208 | 8.1% | 6.0%(+2.10)#103 | 8.1%(+0.024)#8,557 |
| 12. | 40241 | 7.9% | 6.0%(+1.90)#108 | 8.1%(-0.180)#8,978 |
| 13. | 40215 | 7.1% | 6.0%(+1.09)#129 | 8.1%(-0.982)#10,709 |
| 14. | 40223 | 6.8% | 6.0%(+0.839)#135 | 8.1%(-1.24)#11,305 |
| 15. | 40272 | 6.6% | 6.0%(+0.609)#140 | 8.1%(-1.47)#11,848 |
| 16. | 40218 | 6.6% | 6.0%(+0.597)#141 | 8.1%(-1.48)#11,877 |
| 17. | 40211 | 6.5% | 6.0%(+0.527)#149 | 8.1%(-1.55)#12,050 |
| 18. | 40242 | 6.4% | 6.0%(+0.392)#156 | 8.1%(-1.68)#12,409 |
| 19. | 40202 | 6.3% | 6.0%(+0.290)#159 | 8.1%(-1.79)#12,666 |
| 20. | 40243 | 6.2% | 6.0%(+0.167)#163 | 8.1%(-1.91)#12,938 |
| 21. | 40258 | 5.7% | 6.0%(-0.285)#183 | 8.1%(-2.36)#14,044 |
| 22. | 40213 | 5.4% | 6.0%(-0.625)#194 | 8.1%(-2.70)#14,902 |
| 23. | 40299 | 5.2% | 6.0%(-0.805)#204 | 8.1%(-2.88)#15,370 |
| 24. | 40245 | 5.0% | 6.0%(-0.963)#209 | 8.1%(-3.04)#15,751 |
| 25. | 40228 | 4.4% | 6.0%(-1.60)#232 | 8.1%(-3.67)#17,273 |
| 26. | 40291 | 4.4% | 6.0%(-1.62)#233 | 8.1%(-3.70)#17,318 |
| 27. | 40220 | 4.3% | 6.0%(-1.69)#239 | 8.1%(-3.77)#17,516 |
| 28. | 40216 | 3.9% | 6.0%(-2.05)#251 | 8.1%(-4.12)#18,319 |
| 29. | 40229 | 3.8% | 6.0%(-2.19)#255 | 8.1%(-4.27)#18,661 |
| 30. | 40210 | 2.3% | 6.0%(-3.65)#319 | 8.1%(-5.73)#21,593 |
1
Common Questions
What are the Top 10 Zip Codes with the Highest Percentage of Population with a Degree in Social Sciences in Louisville, KY?
Top 10 Zip Codes with the Highest Percentage of Population with a Degree in Social Sciences in Louisville, KY are:
What zip code has the Highest Percentage of Population with a Degree in Social Sciences in Louisville, KY?
40219 has the Highest Percentage of Population with a Degree in Social Sciences in Louisville, KY with 13.7%.
What is the Percentage of Population with a Degree in Social Sciences in Louisville, KY?
Percentage of Population with a Degree in Social Sciences in Louisville is 7.2%.
What is the Percentage of Population with a Degree in Social Sciences in Kentucky?
Percentage of Population with a Degree in Social Sciences in Kentucky is 6.0%.
What is the Percentage of Population with a Degree in Social Sciences in the United States?
Percentage of Population with a Degree in Social Sciences in the United States is 8.1%.