Zip Codes with the Highest Percentage of Population Employed in Education, Arts & Media in Louisville, KY
RELATED REPORTS & OPTIONS
Education, Arts & Media
Louisville
Compare Zip Codes
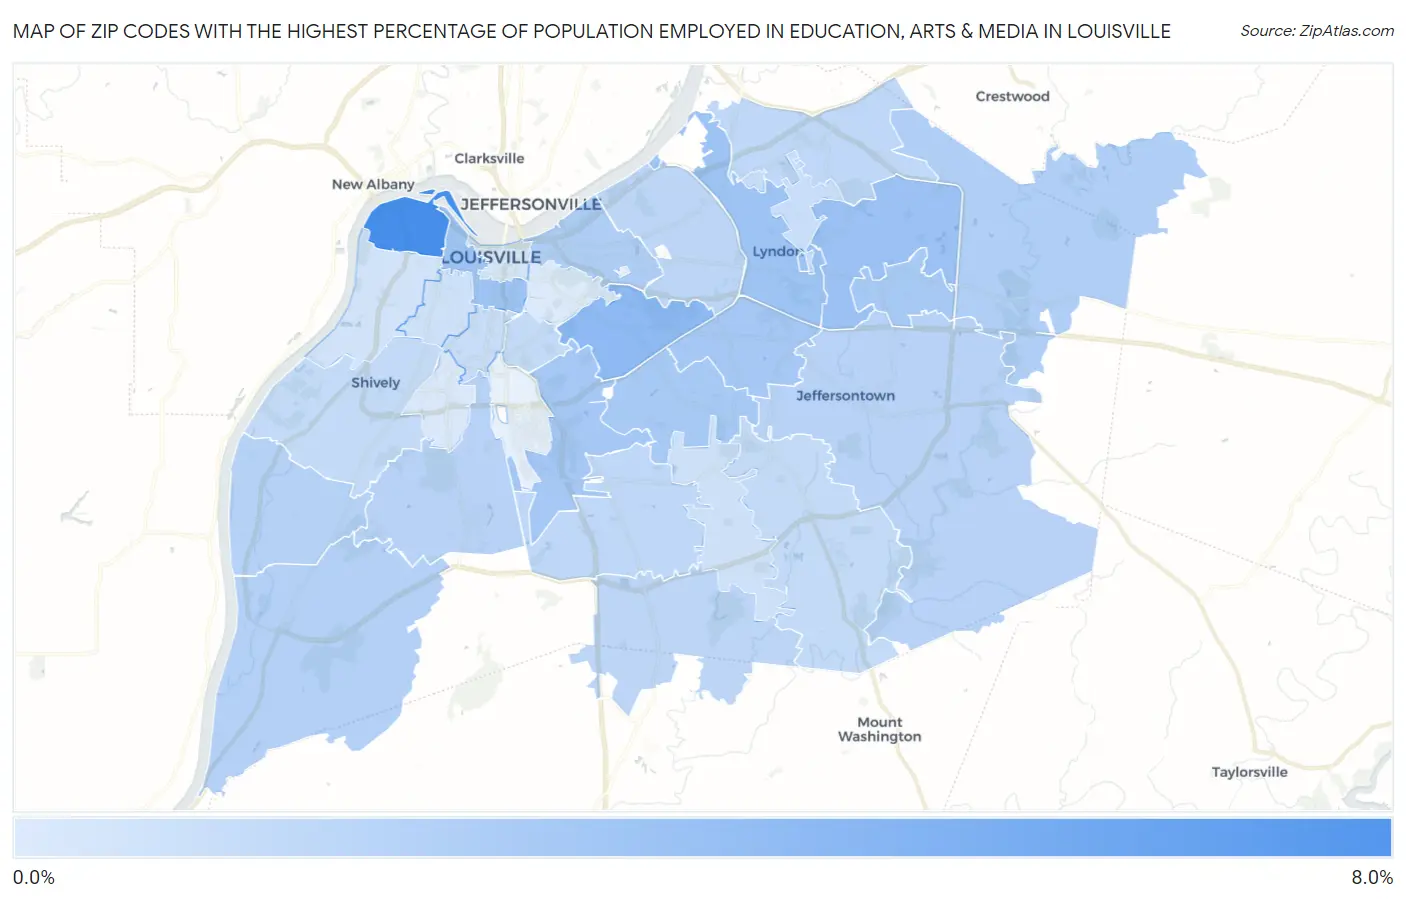
Map of Zip Codes with the Highest Percentage of Population Employed in Education, Arts & Media in Louisville
0.68%
6.0%
Zip Codes with the Highest Percentage of Population Employed in Education, Arts & Media in Louisville, KY
| Zip Code | % Employed | vs State | vs National | |
| 1. | 40212 | 6.0% | 2.0%(+3.99)#50 | 1.8%(+4.25)#1,062 |
| 2. | 40205 | 3.4% | 2.0%(+1.37)#112 | 1.8%(+1.63)#3,426 |
| 3. | 40223 | 2.9% | 2.0%(+0.875)#132 | 1.8%(+1.14)#4,747 |
| 4. | 40203 | 2.8% | 2.0%(+0.803)#145 | 1.8%(+1.06)#4,997 |
| 5. | 40222 | 2.8% | 2.0%(+0.800)#146 | 1.8%(+1.06)#5,008 |
| 6. | 40213 | 2.7% | 2.0%(+0.616)#164 | 1.8%(+0.877)#5,763 |
| 7. | 40220 | 2.6% | 2.0%(+0.578)#169 | 1.8%(+0.838)#5,931 |
| 8. | 40218 | 2.5% | 2.0%(+0.494)#177 | 1.8%(+0.755)#6,326 |
| 9. | 40243 | 2.5% | 2.0%(+0.477)#178 | 1.8%(+0.738)#6,407 |
| 10. | 40206 | 2.3% | 2.0%(+0.222)#203 | 1.8%(+0.482)#7,792 |
| 11. | 40245 | 2.2% | 2.0%(+0.181)#207 | 1.8%(+0.442)#8,021 |
| 12. | 40272 | 2.1% | 2.0%(+0.095)#214 | 1.8%(+0.356)#8,576 |
| 13. | 40258 | 2.1% | 2.0%(+0.017)#226 | 1.8%(+0.277)#9,125 |
| 14. | 40214 | 2.0% | 2.0%(-0.062)#233 | 1.8%(+0.198)#9,672 |
| 15. | 40299 | 2.0% | 2.0%(-0.080)#236 | 1.8%(+0.180)#9,822 |
| 16. | 40229 | 1.8% | 2.0%(-0.208)#252 | 1.8%(+0.053)#10,850 |
| 17. | 40207 | 1.8% | 2.0%(-0.273)#262 | 1.8%(-0.012)#11,367 |
| 18. | 40241 | 1.8% | 2.0%(-0.283)#263 | 1.8%(-0.022)#11,445 |
| 19. | 40219 | 1.7% | 2.0%(-0.308)#267 | 1.8%(-0.047)#11,636 |
| 20. | 40291 | 1.6% | 2.0%(-0.455)#286 | 1.8%(-0.194)#12,913 |
| 21. | 40217 | 1.6% | 2.0%(-0.482)#291 | 1.8%(-0.222)#13,170 |
| 22. | 40216 | 1.6% | 2.0%(-0.496)#294 | 1.8%(-0.235)#13,297 |
| 23. | 40208 | 1.4% | 2.0%(-0.659)#314 | 1.8%(-0.399)#14,877 |
| 24. | 40242 | 1.4% | 2.0%(-0.680)#318 | 1.8%(-0.420)#15,079 |
| 25. | 40210 | 1.1% | 2.0%(-0.909)#345 | 1.8%(-0.649)#17,254 |
| 26. | 40228 | 1.1% | 2.0%(-0.922)#348 | 1.8%(-0.661)#17,363 |
| 27. | 40211 | 1.1% | 2.0%(-0.968)#355 | 1.8%(-0.708)#17,779 |
| 28. | 40202 | 0.91% | 2.0%(-1.14)#373 | 1.8%(-0.876)#19,313 |
| 29. | 40215 | 0.75% | 2.0%(-1.30)#392 | 1.8%(-1.04)#20,633 |
| 30. | 40204 | 0.68% | 2.0%(-1.37)#398 | 1.8%(-1.11)#21,120 |
1
Common Questions
What are the Top 10 Zip Codes with the Highest Percentage of Population Employed in Education, Arts & Media in Louisville, KY?
Top 10 Zip Codes with the Highest Percentage of Population Employed in Education, Arts & Media in Louisville, KY are:
What zip code has the Highest Percentage of Population Employed in Education, Arts & Media in Louisville, KY?
40212 has the Highest Percentage of Population Employed in Education, Arts & Media in Louisville, KY with 6.0%.
What is the Percentage of Population Employed in Education, Arts & Media in Louisville, KY?
Percentage of Population Employed in Education, Arts & Media in Louisville is 2.1%.
What is the Percentage of Population Employed in Education, Arts & Media in Kentucky?
Percentage of Population Employed in Education, Arts & Media in Kentucky is 2.0%.
What is the Percentage of Population Employed in Education, Arts & Media in the United States?
Percentage of Population Employed in Education, Arts & Media in the United States is 1.8%.