Zip Codes with the Lowest Percentage of Owner-Occupied Units in Louisville, KY
RELATED REPORTS & OPTIONS
Lowest Owner-Occupied
Louisville
Compare Zip Codes
Map of Zip Codes with the Lowest Percentage of Owner-Occupied Units in Louisville
79.0%
9.3%
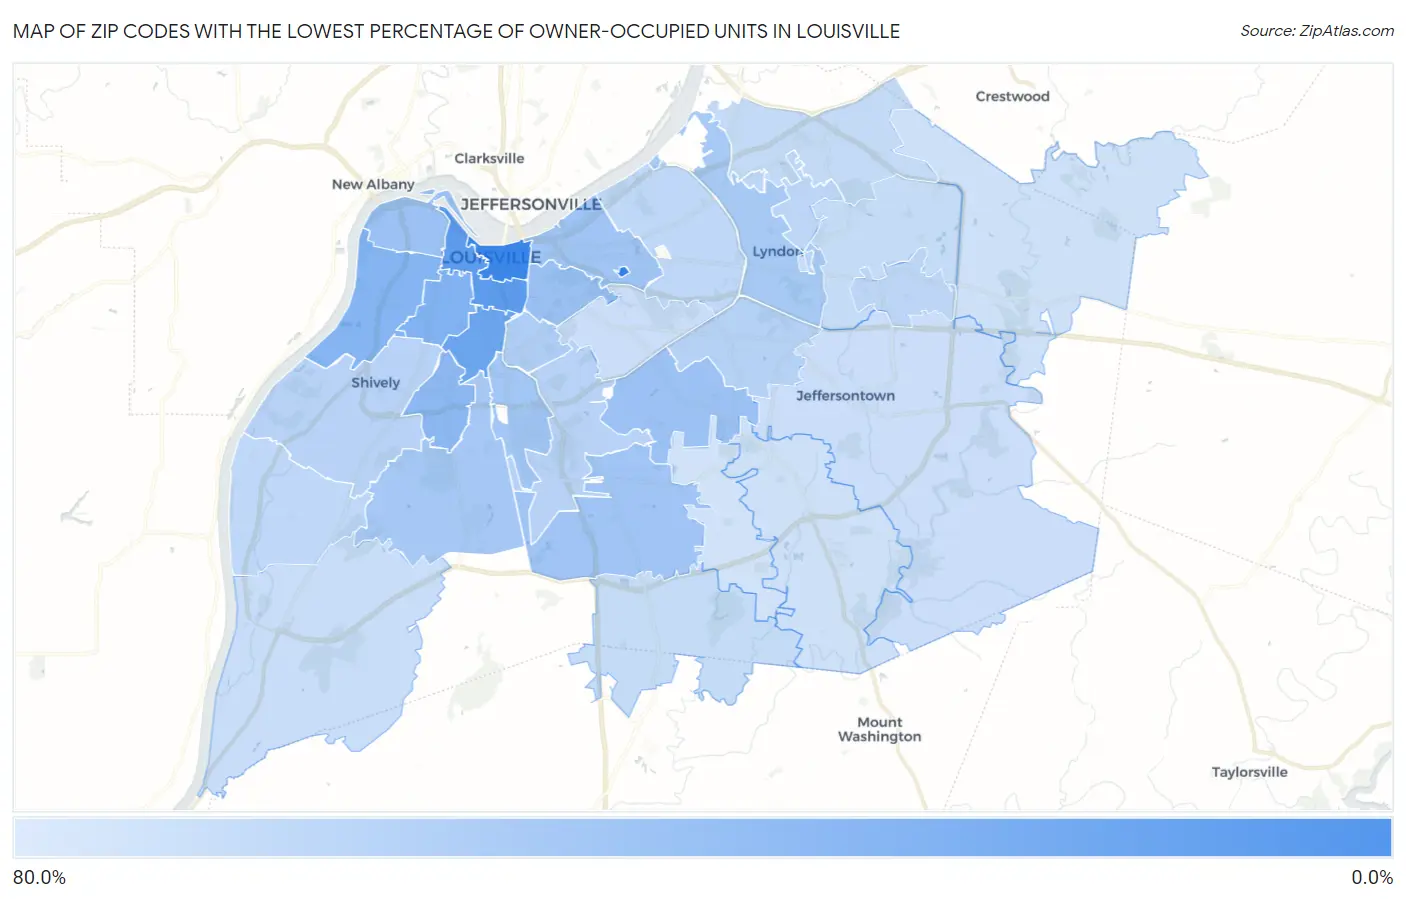
Zip Codes with the Lowest Percentage of Owner-Occupied Units in Louisville, KY
| Zip Code | % Owner-Occupied | vs State | vs National | |
| 1. | 40202 | 9.3% | 68.1% (-58.8)#4 | 64.8% (-55.5)#152 |
| 2. | 40203 | 22.5% | 68.1% (-45.6)#10 | 64.8% (-42.3)#463 |
| 3. | 40208 | 28.3% | 68.1% (-39.8)#14 | 64.8% (-36.5)#671 |
| 4. | 40210 | 37.2% | 68.1% (-31.0)#19 | 64.8% (-27.7)#1,264 |
| 5. | 40211 | 39.1% | 68.1% (-29.1)#22 | 64.8% (-25.7)#1,418 |
| 6. | 40215 | 42.5% | 68.1% (-25.7)#26 | 64.8% (-22.4)#1,746 |
| 7. | 40204 | 49.5% | 68.1% (-18.6)#42 | 64.8% (-15.3)#2,718 |
| 8. | 40218 | 50.1% | 68.1% (-18.0)#43 | 64.8% (-14.7)#2,813 |
| 9. | 40212 | 50.6% | 68.1% (-17.5)#44 | 64.8% (-14.2)#2,903 |
| 10. | 40219 | 52.7% | 68.1% (-15.4)#51 | 64.8% (-12.1)#3,287 |
| 11. | 40206 | 52.8% | 68.1% (-15.3)#53 | 64.8% (-12.0)#3,309 |
| 12. | 40209 | 53.8% | 68.1% (-14.4)#59 | 64.8% (-11.1)#3,480 |
| 13. | 40214 | 55.0% | 68.1% (-13.1)#63 | 64.8% (-9.81)#3,756 |
| 14. | 40222 | 55.6% | 68.1% (-12.5)#68 | 64.8% (-9.23)#3,915 |
| 15. | 40217 | 60.2% | 68.1% (-7.92)#89 | 64.8% (-4.62)#5,173 |
| 16. | 40220 | 63.1% | 68.1% (-5.06)#111 | 64.8% (-1.76)#6,211 |
| 17. | 40216 | 64.1% | 68.1% (-4.06)#122 | 64.8% (-0.762)#6,631 |
| 18. | 40213 | 64.5% | 68.1% (-3.65)#129 | 64.8% (-0.347)#6,804 |
| 19. | 40243 | 67.2% | 68.1% (-0.955)#163 | 64.8% (+2.35)#8,116 |
| 20. | 40242 | 68.9% | 68.1% (+0.759)#187 | 64.8% (+4.06)#9,073 |
| 21. | 40258 | 69.3% | 68.1% (+1.20)#190 | 64.8% (+4.50)#9,331 |
| 22. | 40207 | 69.8% | 68.1% (+1.67)#200 | 64.8% (+4.97)#9,623 |
| 23. | 40241 | 71.0% | 68.1% (+2.85)#218 | 64.8% (+6.15)#10,373 |
| 24. | 40229 | 72.6% | 68.1% (+4.49)#251 | 64.8% (+7.79)#11,533 |
| 25. | 40223 | 72.9% | 68.1% (+4.82)#263 | 64.8% (+8.12)#11,758 |
| 26. | 40272 | 73.0% | 68.1% (+4.91)#266 | 64.8% (+8.21)#11,826 |
| 27. | 40205 | 74.9% | 68.1% (+6.75)#296 | 64.8% (+10.1)#13,204 |
| 28. | 40299 | 75.6% | 68.1% (+7.47)#316 | 64.8% (+10.8)#13,858 |
| 29. | 40291 | 77.4% | 68.1% (+9.30)#353 | 64.8% (+12.6)#15,519 |
| 30. | 40245 | 78.2% | 68.1% (+10.1)#374 | 64.8% (+13.4)#16,265 |
| 31. | 40228 | 79.0% | 68.1% (+10.9)#389 | 64.8% (+14.2)#16,985 |
1
Common Questions
What are the Top 10 Zip Codes with the Lowest Percentage of Owner-Occupied Units in Louisville, KY?
Top 10 Zip Codes with the Lowest Percentage of Owner-Occupied Units in Louisville, KY are:
What zip code has the Lowest Percentage of Owner-Occupied Units in Louisville, KY?
40202 has the Lowest Percentage of Owner-Occupied Units in Louisville, KY with 9.3%.
What is the Percentage of Owner-Occupied Units in Louisville, KY?
Percentage of Owner-Occupied Units in Louisville is 60.4%.
What is the Percentage of Owner-Occupied Units in Kentucky?
Percentage of Owner-Occupied Units in Kentucky is 68.1%.
What is the Percentage of Owner-Occupied Units in the United States?
Percentage of Owner-Occupied Units in the United States is 64.8%.