Zip Codes with the Highest Percentage of Population Employed in Business & Financial in Louisville, KY
RELATED REPORTS & OPTIONS
Business & Financial
Louisville
Compare Zip Codes
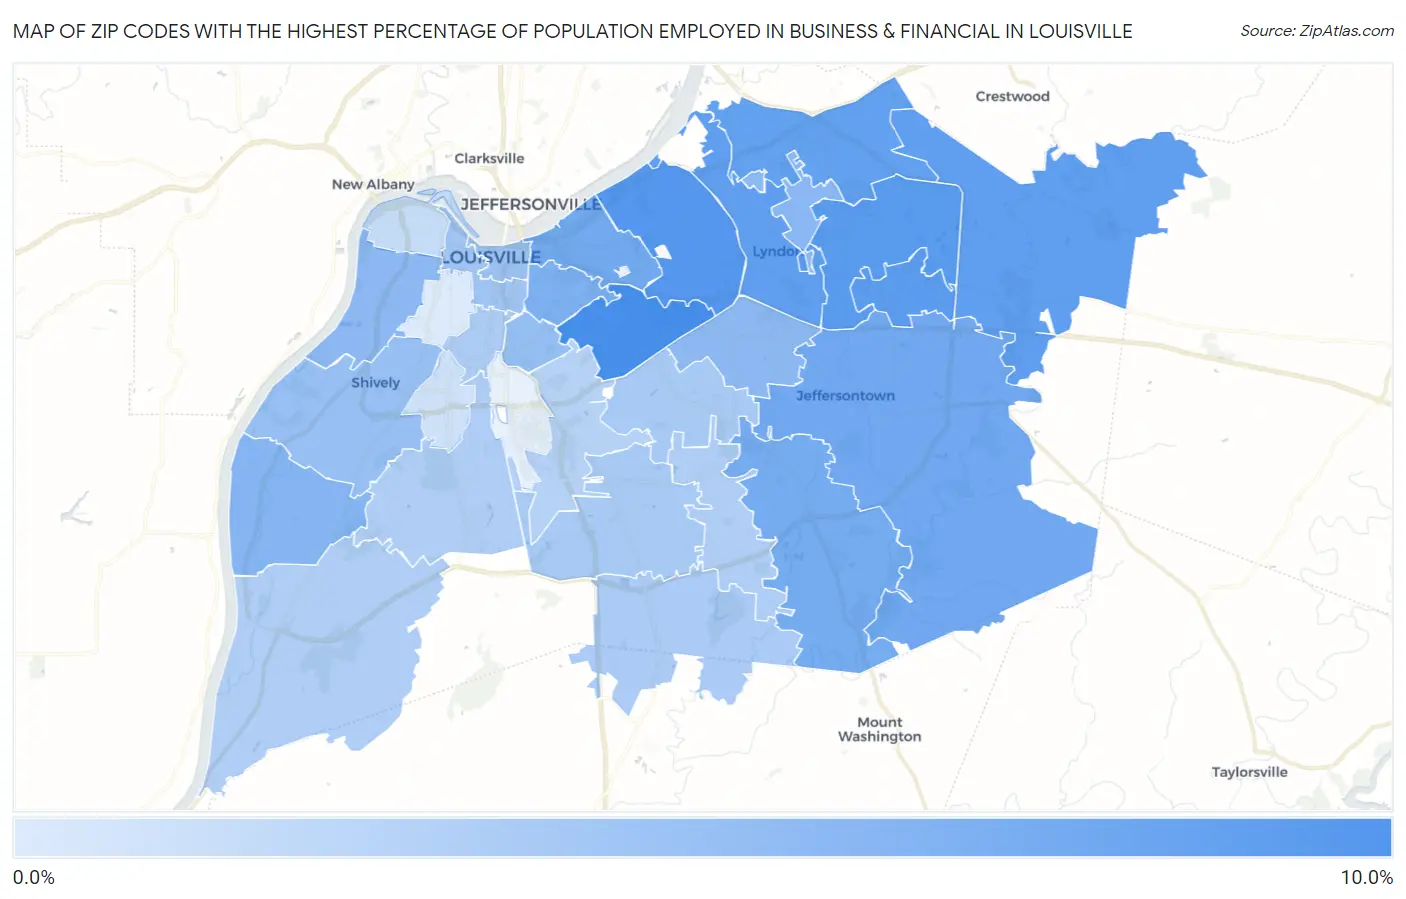
Map of Zip Codes with the Highest Percentage of Population Employed in Business & Financial in Louisville
1.0%
9.9%
Zip Codes with the Highest Percentage of Population Employed in Business & Financial in Louisville, KY
| Zip Code | % Employed | vs State | vs National | |
| 1. | 40205 | 9.9% | 4.6%(+5.33)#34 | 5.8%(+4.18)#2,242 |
| 2. | 40207 | 9.1% | 4.6%(+4.45)#44 | 5.8%(+3.31)#3,011 |
| 3. | 40223 | 8.9% | 4.6%(+4.32)#46 | 5.8%(+3.18)#3,134 |
| 4. | 40243 | 8.6% | 4.6%(+4.03)#51 | 5.8%(+2.89)#3,442 |
| 5. | 40222 | 8.4% | 4.6%(+3.82)#56 | 5.8%(+2.68)#3,668 |
| 6. | 40245 | 8.4% | 4.6%(+3.73)#57 | 5.8%(+2.59)#3,793 |
| 7. | 40241 | 8.2% | 4.6%(+3.59)#59 | 5.8%(+2.45)#3,971 |
| 8. | 40299 | 7.4% | 4.6%(+2.73)#78 | 5.8%(+1.59)#5,214 |
| 9. | 40206 | 7.3% | 4.6%(+2.68)#80 | 5.8%(+1.54)#5,287 |
| 10. | 40291 | 7.1% | 4.6%(+2.52)#85 | 5.8%(+1.38)#5,556 |
| 11. | 40204 | 6.6% | 4.6%(+1.94)#96 | 5.8%(+0.795)#6,657 |
| 12. | 40258 | 6.1% | 4.6%(+1.48)#105 | 5.8%(+0.337)#7,605 |
| 13. | 40242 | 5.9% | 4.6%(+1.28)#115 | 5.8%(+0.136)#8,077 |
| 14. | 40220 | 5.7% | 4.6%(+1.06)#124 | 5.8%(-0.079)#8,577 |
| 15. | 40211 | 5.7% | 4.6%(+1.05)#125 | 5.8%(-0.094)#8,608 |
| 16. | 40217 | 5.2% | 4.6%(+0.534)#144 | 5.8%(-0.607)#10,017 |
| 17. | 40216 | 5.0% | 4.6%(+0.400)#148 | 5.8%(-0.742)#10,399 |
| 18. | 40202 | 4.8% | 4.6%(+0.217)#158 | 5.8%(-0.924)#10,928 |
| 19. | 40203 | 4.4% | 4.6%(-0.187)#183 | 5.8%(-1.33)#12,310 |
| 20. | 40219 | 4.1% | 4.6%(-0.566)#204 | 5.8%(-1.71)#13,647 |
| 21. | 40218 | 4.0% | 4.6%(-0.581)#205 | 5.8%(-1.72)#13,698 |
| 22. | 40229 | 3.9% | 4.6%(-0.726)#215 | 5.8%(-1.87)#14,224 |
| 23. | 40208 | 3.8% | 4.6%(-0.866)#226 | 5.8%(-2.01)#14,770 |
| 24. | 40214 | 3.8% | 4.6%(-0.871)#227 | 5.8%(-2.01)#14,788 |
| 25. | 40272 | 3.7% | 4.6%(-0.888)#228 | 5.8%(-2.03)#14,862 |
| 26. | 40228 | 3.7% | 4.6%(-0.921)#233 | 5.8%(-2.06)#15,033 |
| 27. | 40213 | 3.3% | 4.6%(-1.30)#261 | 5.8%(-2.44)#16,569 |
| 28. | 40212 | 2.4% | 4.6%(-2.26)#341 | 5.8%(-3.41)#20,392 |
| 29. | 40215 | 1.8% | 4.6%(-2.85)#383 | 5.8%(-3.99)#22,598 |
| 30. | 40210 | 1.0% | 4.6%(-3.60)#442 | 5.8%(-4.74)#24,982 |
1
Common Questions
What are the Top 10 Zip Codes with the Highest Percentage of Population Employed in Business & Financial in Louisville, KY?
Top 10 Zip Codes with the Highest Percentage of Population Employed in Business & Financial in Louisville, KY are:
What zip code has the Highest Percentage of Population Employed in Business & Financial in Louisville, KY?
40205 has the Highest Percentage of Population Employed in Business & Financial in Louisville, KY with 9.9%.
What is the Percentage of Population Employed in Business & Financial in Louisville, KY?
Percentage of Population Employed in Business & Financial in Louisville is 5.5%.
What is the Percentage of Population Employed in Business & Financial in Kentucky?
Percentage of Population Employed in Business & Financial in Kentucky is 4.6%.
What is the Percentage of Population Employed in Business & Financial in the United States?
Percentage of Population Employed in Business & Financial in the United States is 5.8%.