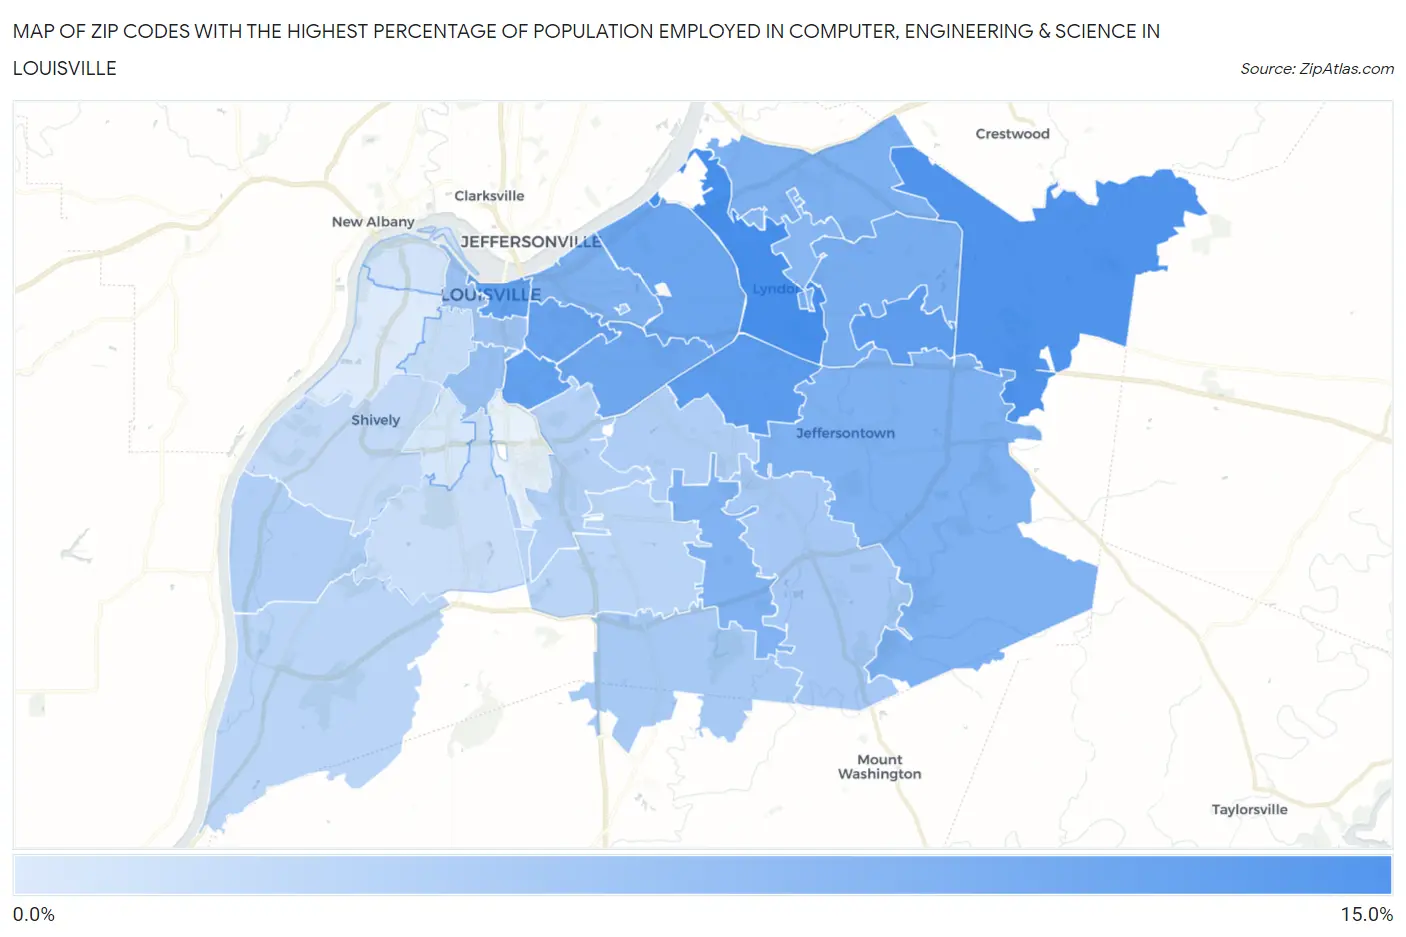
Zip Codes with the Highest Percentage of Population Employed in Computer, Engineering & Science in Louisville, KY
RELATED REPORTS & OPTIONS
Computer, Engineering & Science
Louisville
Compare Zip Codes
Map of Zip Codes with the Highest Percentage of Population Employed in Computer, Engineering & Science in Louisville
0.85%
11.4%

Zip Codes with the Highest Percentage of Population Employed in Computer, Engineering & Science in Louisville, KY
| Zip Code | % Employed | vs State | vs National | |
| 1. | 40222 | 11.4% | 4.6%(+6.79)#19 | 6.8%(+4.66)#2,344 |
| 2. | 40245 | 10.7% | 4.6%(+6.08)#25 | 6.8%(+3.94)#2,724 |
| 3. | 40220 | 9.9% | 4.6%(+5.28)#29 | 6.8%(+3.14)#3,298 |
| 4. | 40243 | 9.7% | 4.6%(+5.06)#32 | 6.8%(+2.93)#3,450 |
| 5. | 40202 | 9.4% | 4.6%(+4.76)#38 | 6.8%(+2.62)#3,695 |
| 6. | 40217 | 9.3% | 4.6%(+4.71)#40 | 6.8%(+2.57)#3,750 |
| 7. | 40204 | 9.0% | 4.6%(+4.38)#45 | 6.8%(+2.25)#4,053 |
| 8. | 40207 | 8.7% | 4.6%(+4.11)#48 | 6.8%(+1.97)#4,320 |
| 9. | 40205 | 8.6% | 4.6%(+3.92)#50 | 6.8%(+1.79)#4,547 |
| 10. | 40223 | 7.9% | 4.6%(+3.29)#61 | 6.8%(+1.16)#5,379 |
| 11. | 40241 | 7.6% | 4.6%(+2.94)#69 | 6.8%(+0.806)#5,884 |
| 12. | 40206 | 7.5% | 4.6%(+2.82)#71 | 6.8%(+0.686)#6,073 |
| 13. | 40299 | 7.4% | 4.6%(+2.80)#72 | 6.8%(+0.665)#6,112 |
| 14. | 40228 | 7.2% | 4.6%(+2.62)#76 | 6.8%(+0.483)#6,384 |
| 15. | 40242 | 6.7% | 4.6%(+2.04)#89 | 6.8%(-0.099)#7,423 |
| 16. | 40208 | 5.6% | 4.6%(+0.984)#126 | 6.8%(-1.15)#9,770 |
| 17. | 40203 | 5.5% | 4.6%(+0.840)#130 | 6.8%(-1.30)#10,139 |
| 18. | 40280 | 5.1% | 4.6%(+0.433)#140 | 6.8%(-1.70)#11,199 |
| 19. | 40291 | 4.6% | 4.6%(-0.076)#162 | 6.8%(-2.21)#12,643 |
| 20. | 40229 | 4.4% | 4.6%(-0.196)#169 | 6.8%(-2.33)#13,057 |
| 21. | 40218 | 3.9% | 4.6%(-0.693)#199 | 6.8%(-2.83)#14,682 |
| 22. | 40258 | 3.8% | 4.6%(-0.829)#210 | 6.8%(-2.96)#15,154 |
| 23. | 40213 | 3.7% | 4.6%(-0.940)#218 | 6.8%(-3.08)#15,511 |
| 24. | 40272 | 3.2% | 4.6%(-1.43)#257 | 6.8%(-3.57)#17,386 |
| 25. | 40219 | 3.2% | 4.6%(-1.47)#260 | 6.8%(-3.60)#17,523 |
| 26. | 40216 | 2.7% | 4.6%(-1.95)#298 | 6.8%(-4.08)#19,321 |
| 27. | 40210 | 2.4% | 4.6%(-2.22)#317 | 6.8%(-4.35)#20,356 |
| 28. | 40214 | 2.3% | 4.6%(-2.38)#329 | 6.8%(-4.51)#20,912 |
| 29. | 40212 | 1.6% | 4.6%(-3.04)#379 | 6.8%(-5.18)#23,306 |
| 30. | 40215 | 1.3% | 4.6%(-3.29)#396 | 6.8%(-5.42)#24,071 |
| 31. | 40211 | 0.85% | 4.6%(-3.78)#421 | 6.8%(-5.91)#25,443 |
1
Common Questions
What are the Top 10 Zip Codes with the Highest Percentage of Population Employed in Computer, Engineering & Science in Louisville, KY?
Top 10 Zip Codes with the Highest Percentage of Population Employed in Computer, Engineering & Science in Louisville, KY are:
What zip code has the Highest Percentage of Population Employed in Computer, Engineering & Science in Louisville, KY?
40222 has the Highest Percentage of Population Employed in Computer, Engineering & Science in Louisville, KY with 11.4%.
What is the Percentage of Population Employed in Computer, Engineering & Science in Louisville, KY?
Percentage of Population Employed in Computer, Engineering & Science in Louisville is 5.2%.
What is the Percentage of Population Employed in Computer, Engineering & Science in Kentucky?
Percentage of Population Employed in Computer, Engineering & Science in Kentucky is 4.6%.
What is the Percentage of Population Employed in Computer, Engineering & Science in the United States?
Percentage of Population Employed in Computer, Engineering & Science in the United States is 6.8%.