Zip Codes with the Highest Percentage of Population with a Degree in Arts and Humanities in Louisville, KY
RELATED REPORTS & OPTIONS
Arts and Humanities
Louisville
Compare Zip Codes
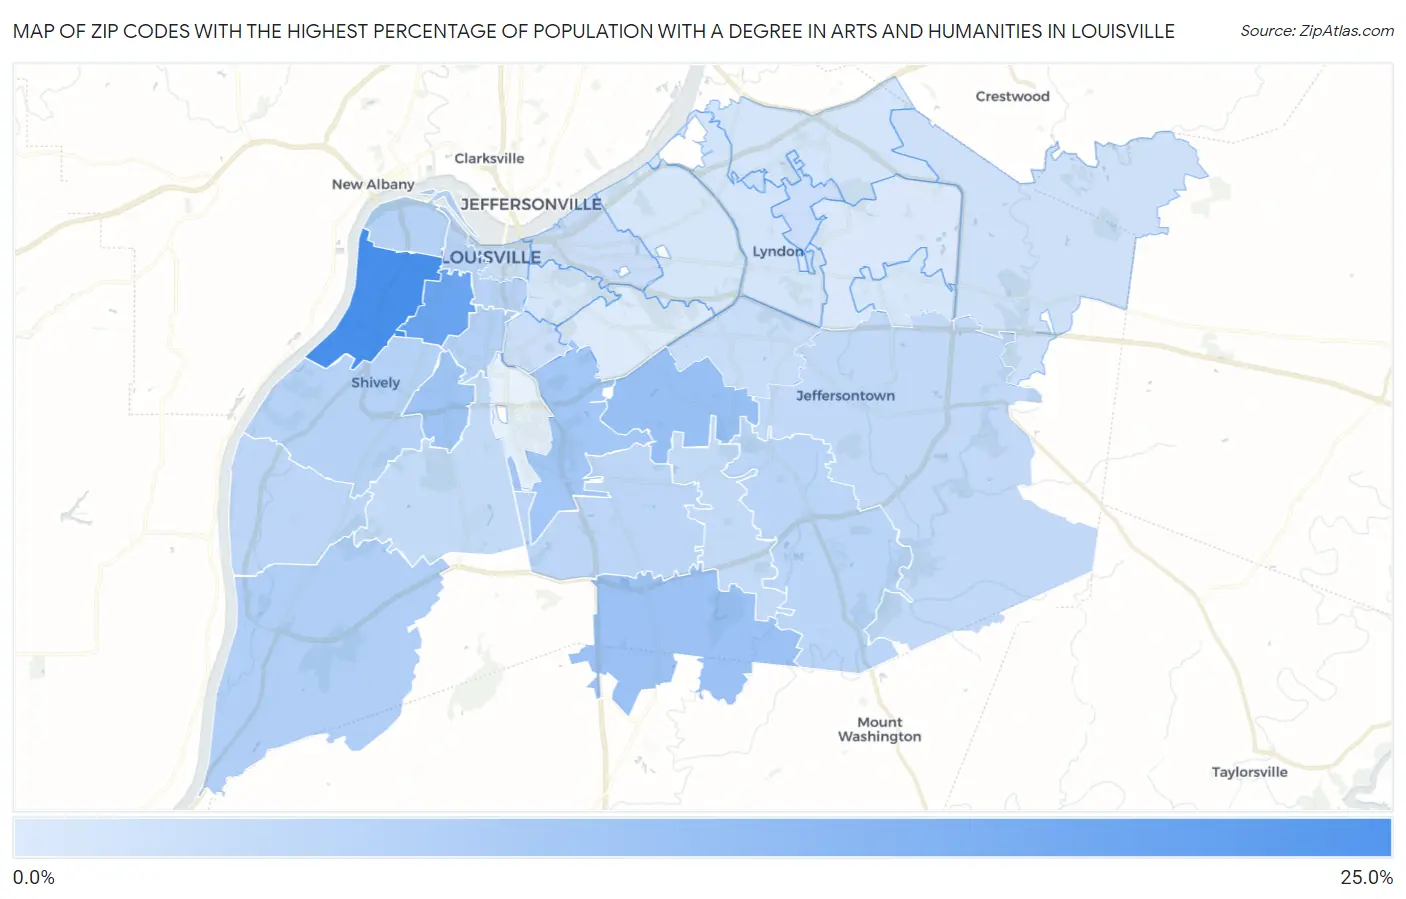
Map of Zip Codes with the Highest Percentage of Population with a Degree in Arts and Humanities in Louisville
3.7%
23.1%
Zip Codes with the Highest Percentage of Population with a Degree in Arts and Humanities in Louisville, KY
| Zip Code | % Graduates | vs State | vs National | |
| 1. | 40211 | 23.1% | 7.5%(+15.6)#54 | 6.0%(+17.1)#1,104 |
| 2. | 40210 | 18.3% | 7.5%(+10.8)#81 | 6.0%(+12.4)#1,765 |
| 3. | 40218 | 12.1% | 7.5%(+4.57)#144 | 6.0%(+6.08)#4,264 |
| 4. | 40229 | 11.7% | 7.5%(+4.24)#147 | 6.0%(+5.75)#4,507 |
| 5. | 40215 | 11.2% | 7.5%(+3.74)#154 | 6.0%(+5.25)#4,918 |
| 6. | 40213 | 10.7% | 7.5%(+3.23)#162 | 6.0%(+4.74)#5,376 |
| 7. | 40272 | 9.1% | 7.5%(+1.57)#208 | 6.0%(+3.08)#7,627 |
| 8. | 40208 | 8.8% | 7.5%(+1.34)#215 | 6.0%(+2.85)#8,000 |
| 9. | 40212 | 8.6% | 7.5%(+1.05)#219 | 6.0%(+2.56)#8,525 |
| 10. | 40216 | 8.4% | 7.5%(+0.897)#222 | 6.0%(+2.41)#8,804 |
| 11. | 40203 | 8.0% | 7.5%(+0.520)#232 | 6.0%(+2.03)#9,604 |
| 12. | 40291 | 8.0% | 7.5%(+0.455)#238 | 6.0%(+1.97)#9,757 |
| 13. | 40258 | 7.6% | 7.5%(+0.044)#254 | 6.0%(+1.56)#10,593 |
| 14. | 40219 | 7.5% | 7.5%(+0.032)#256 | 6.0%(+1.54)#10,621 |
| 15. | 40299 | 6.9% | 7.5%(-0.567)#275 | 6.0%(+0.944)#12,118 |
| 16. | 40228 | 6.7% | 7.5%(-0.806)#284 | 6.0%(+0.705)#12,760 |
| 17. | 40214 | 6.7% | 7.5%(-0.839)#286 | 6.0%(+0.672)#12,813 |
| 18. | 40220 | 6.0% | 7.5%(-1.47)#315 | 6.0%(+0.036)#14,589 |
| 19. | 40202 | 5.8% | 7.5%(-1.72)#325 | 6.0%(-0.208)#15,274 |
| 20. | 40217 | 5.8% | 7.5%(-1.76)#327 | 6.0%(-0.245)#15,374 |
| 21. | 40242 | 5.7% | 7.5%(-1.77)#328 | 6.0%(-0.255)#15,403 |
| 22. | 40206 | 5.7% | 7.5%(-1.77)#329 | 6.0%(-0.255)#15,406 |
| 23. | 40245 | 5.3% | 7.5%(-2.18)#341 | 6.0%(-0.668)#16,635 |
| 24. | 40241 | 4.8% | 7.5%(-2.66)#356 | 6.0%(-1.15)#18,054 |
| 25. | 40222 | 4.8% | 7.5%(-2.75)#360 | 6.0%(-1.24)#18,307 |
| 26. | 40207 | 4.5% | 7.5%(-3.05)#368 | 6.0%(-1.54)#19,140 |
| 27. | 40204 | 4.4% | 7.5%(-3.09)#373 | 6.0%(-1.57)#19,230 |
| 28. | 40243 | 4.4% | 7.5%(-3.11)#375 | 6.0%(-1.60)#19,320 |
| 29. | 40223 | 4.0% | 7.5%(-3.46)#382 | 6.0%(-1.95)#20,215 |
| 30. | 40205 | 3.7% | 7.5%(-3.86)#396 | 6.0%(-2.34)#21,219 |
1
Common Questions
What are the Top 10 Zip Codes with the Highest Percentage of Population with a Degree in Arts and Humanities in Louisville, KY?
Top 10 Zip Codes with the Highest Percentage of Population with a Degree in Arts and Humanities in Louisville, KY are:
What zip code has the Highest Percentage of Population with a Degree in Arts and Humanities in Louisville, KY?
40211 has the Highest Percentage of Population with a Degree in Arts and Humanities in Louisville, KY with 23.1%.
What is the Percentage of Population with a Degree in Arts and Humanities in Louisville, KY?
Percentage of Population with a Degree in Arts and Humanities in Louisville is 6.9%.
What is the Percentage of Population with a Degree in Arts and Humanities in Kentucky?
Percentage of Population with a Degree in Arts and Humanities in Kentucky is 7.5%.
What is the Percentage of Population with a Degree in Arts and Humanities in the United States?
Percentage of Population with a Degree in Arts and Humanities in the United States is 6.0%.