Zip Codes with the Highest Percentage of Population Employed in Office & Administration in Louisville, KY
RELATED REPORTS & OPTIONS
Office & Administration
Louisville
Compare Zip Codes
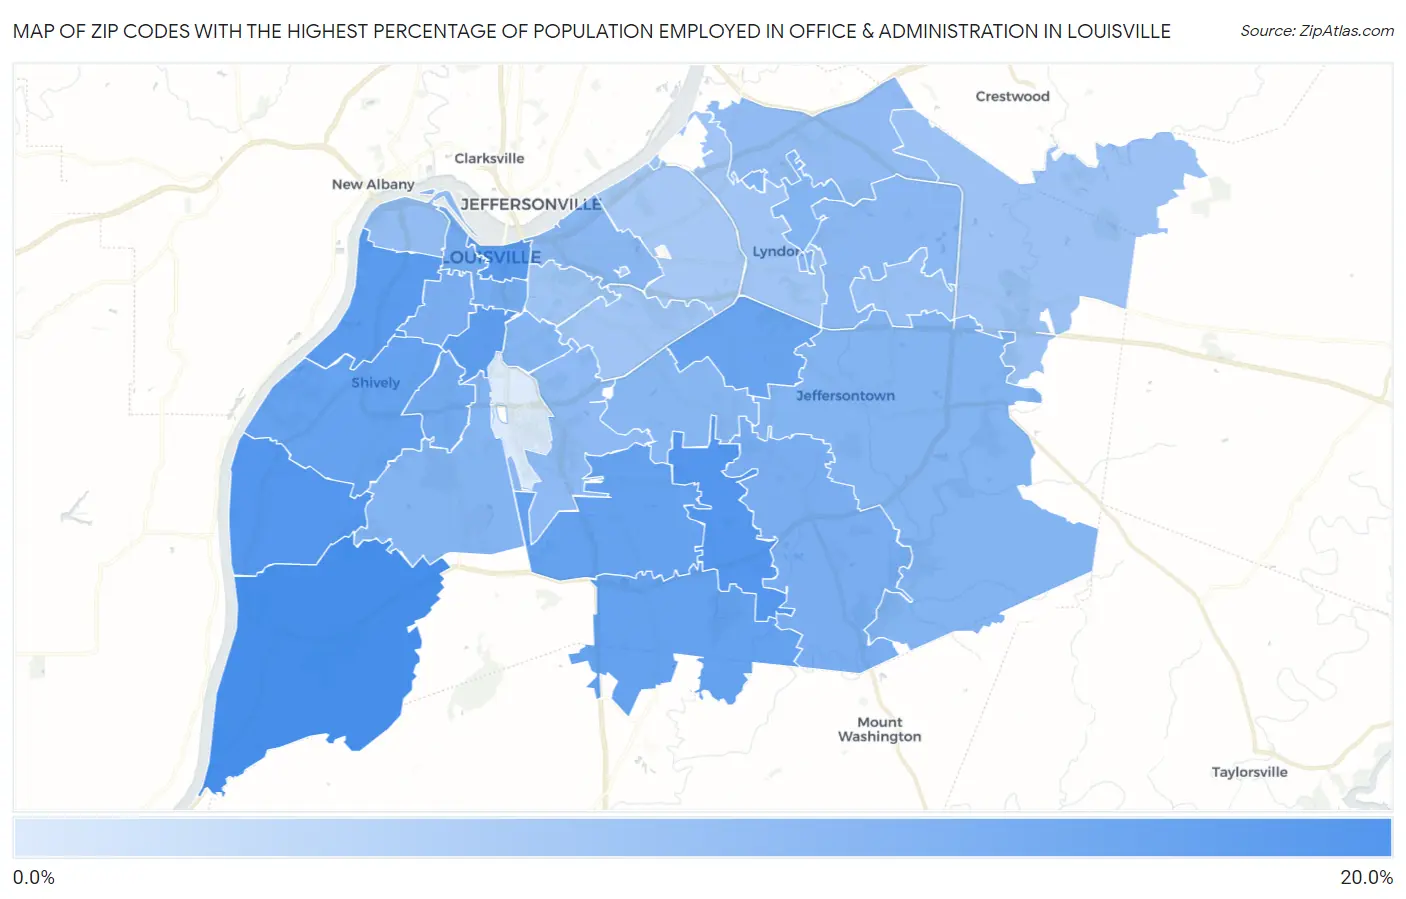
Map of Zip Codes with the Highest Percentage of Population Employed in Office & Administration in Louisville
2.5%
16.6%
Zip Codes with the Highest Percentage of Population Employed in Office & Administration in Louisville, KY
| Zip Code | % Employed | vs State | vs National | |
| 1. | 40272 | 16.6% | 11.4%(+5.27)#121 | 10.9%(+5.79)#3,075 |
| 2. | 40258 | 15.3% | 11.4%(+3.91)#142 | 10.9%(+4.43)#4,222 |
| 3. | 40228 | 15.2% | 11.4%(+3.80)#146 | 10.9%(+4.32)#4,348 |
| 4. | 40211 | 14.9% | 11.4%(+3.52)#151 | 10.9%(+4.04)#4,695 |
| 5. | 40202 | 14.6% | 11.4%(+3.22)#164 | 10.9%(+3.74)#5,118 |
| 6. | 40208 | 14.2% | 11.4%(+2.87)#169 | 10.9%(+3.39)#5,645 |
| 7. | 40216 | 13.7% | 11.4%(+2.34)#188 | 10.9%(+2.86)#6,515 |
| 8. | 40229 | 13.7% | 11.4%(+2.29)#190 | 10.9%(+2.81)#6,592 |
| 9. | 40219 | 13.6% | 11.4%(+2.18)#194 | 10.9%(+2.70)#6,804 |
| 10. | 40220 | 13.3% | 11.4%(+1.91)#210 | 10.9%(+2.43)#7,409 |
| 11. | 40215 | 12.3% | 11.4%(+0.960)#251 | 10.9%(+1.48)#9,755 |
| 12. | 40203 | 12.0% | 11.4%(+0.662)#264 | 10.9%(+1.18)#10,600 |
| 13. | 40210 | 11.7% | 11.4%(+0.338)#284 | 10.9%(+0.858)#11,583 |
| 14. | 40291 | 11.7% | 11.4%(+0.319)#286 | 10.9%(+0.840)#11,631 |
| 15. | 40242 | 10.8% | 11.4%(-0.528)#334 | 10.9%(-0.008)#14,373 |
| 16. | 40214 | 10.8% | 11.4%(-0.536)#335 | 10.9%(-0.016)#14,395 |
| 17. | 40299 | 10.7% | 11.4%(-0.664)#339 | 10.9%(-0.144)#14,781 |
| 18. | 40217 | 10.6% | 11.4%(-0.797)#347 | 10.9%(-0.277)#15,204 |
| 19. | 40218 | 10.4% | 11.4%(-0.972)#357 | 10.9%(-0.452)#15,810 |
| 20. | 40206 | 10.2% | 11.4%(-1.21)#370 | 10.9%(-0.685)#16,557 |
| 21. | 40223 | 10.2% | 11.4%(-1.22)#372 | 10.9%(-0.700)#16,614 |
| 22. | 40213 | 9.6% | 11.4%(-1.76)#399 | 10.9%(-1.24)#18,382 |
| 23. | 40241 | 9.4% | 11.4%(-2.02)#420 | 10.9%(-1.50)#19,229 |
| 24. | 40212 | 9.2% | 11.4%(-2.21)#427 | 10.9%(-1.69)#19,769 |
| 25. | 40243 | 8.8% | 11.4%(-2.56)#444 | 10.9%(-2.04)#20,781 |
| 26. | 40245 | 8.4% | 11.4%(-2.93)#464 | 10.9%(-2.41)#21,837 |
| 27. | 40204 | 8.1% | 11.4%(-3.30)#474 | 10.9%(-2.78)#22,831 |
| 28. | 40205 | 7.9% | 11.4%(-3.43)#476 | 10.9%(-2.91)#23,148 |
| 29. | 40222 | 7.8% | 11.4%(-3.54)#484 | 10.9%(-3.02)#23,403 |
| 30. | 40207 | 7.5% | 11.4%(-3.85)#493 | 10.9%(-3.33)#24,091 |
| 31. | 40280 | 7.0% | 11.4%(-4.41)#512 | 10.9%(-3.89)#25,283 |
| 32. | 40209 | 2.5% | 11.4%(-8.89)#625 | 10.9%(-8.37)#29,902 |
1
Common Questions
What are the Top 10 Zip Codes with the Highest Percentage of Population Employed in Office & Administration in Louisville, KY?
Top 10 Zip Codes with the Highest Percentage of Population Employed in Office & Administration in Louisville, KY are:
What zip code has the Highest Percentage of Population Employed in Office & Administration in Louisville, KY?
40272 has the Highest Percentage of Population Employed in Office & Administration in Louisville, KY with 16.6%.
What is the Percentage of Population Employed in Office & Administration in Louisville, KY?
Percentage of Population Employed in Office & Administration in Louisville is 11.8%.
What is the Percentage of Population Employed in Office & Administration in Kentucky?
Percentage of Population Employed in Office & Administration in Kentucky is 11.4%.
What is the Percentage of Population Employed in Office & Administration in the United States?
Percentage of Population Employed in Office & Administration in the United States is 10.9%.