Zip Codes with the Highest Percentage of Population Taking Taxi / Cab to Work in Louisville, KY
RELATED REPORTS & OPTIONS
Taxi / Cab
Louisville
Compare Zip Codes
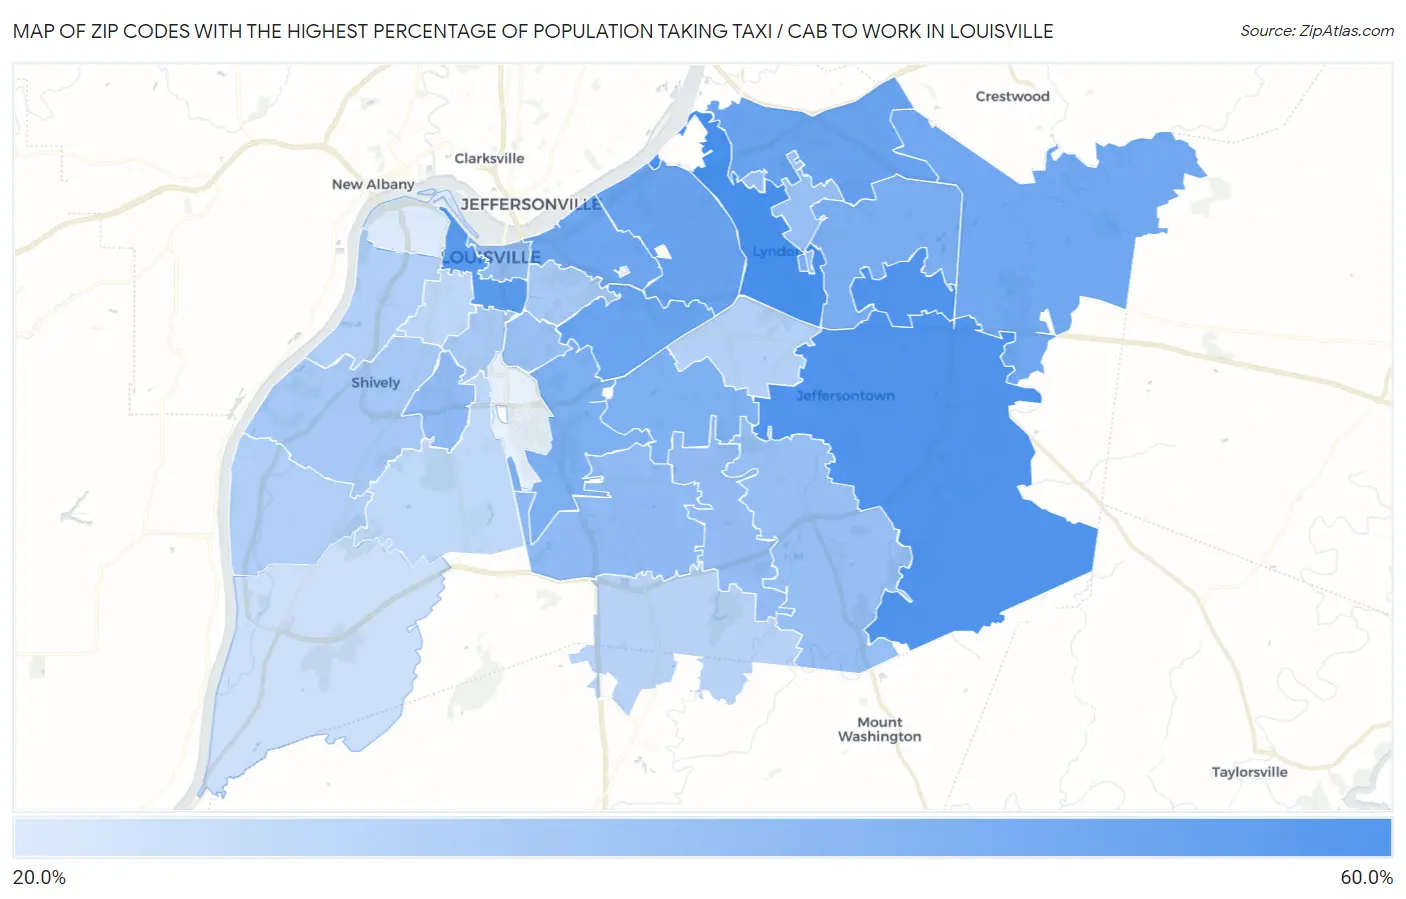
Map of Zip Codes with the Highest Percentage of Population Taking Taxi / Cab to Work in Louisville
22.0%
53.4%
Zip Codes with the Highest Percentage of Population Taking Taxi / Cab to Work in Louisville, KY
| Zip Code | % Take Taxi / Cab | vs State | vs National | |
| 1. | 40222 | 53.4% | 37.9%(+15.5)#30 | 38.2%(+15.2)#1,992 |
| 2. | 40243 | 51.7% | 37.9%(+13.8)#38 | 38.2%(+13.5)#2,456 |
| 3. | 40299 | 51.2% | 37.9%(+13.3)#41 | 38.2%(+13.0)#2,602 |
| 4. | 40203 | 49.5% | 37.9%(+11.6)#45 | 38.2%(+11.3)#3,096 |
| 5. | 40207 | 46.1% | 37.9%(+8.20)#53 | 38.2%(+7.90)#4,281 |
| 6. | 40241 | 45.9% | 37.9%(+8.00)#54 | 38.2%(+7.70)#4,332 |
| 7. | 40205 | 45.4% | 37.9%(+7.50)#59 | 38.2%(+7.20)#4,510 |
| 8. | 40206 | 44.5% | 37.9%(+6.60)#60 | 38.2%(+6.30)#4,817 |
| 9. | 40245 | 43.9% | 37.9%(+6.00)#63 | 38.2%(+5.70)#5,019 |
| 10. | 40223 | 42.1% | 37.9%(+4.20)#69 | 38.2%(+3.90)#5,693 |
| 11. | 40213 | 41.3% | 37.9%(+3.40)#79 | 38.2%(+3.10)#6,046 |
| 12. | 40218 | 41.0% | 37.9%(+3.10)#82 | 38.2%(+2.80)#6,146 |
| 13. | 40219 | 37.5% | 37.9%(-0.400)#96 | 38.2%(-0.700)#7,709 |
| 14. | 40215 | 37.3% | 37.9%(-0.600)#97 | 38.2%(-0.900)#7,817 |
| 15. | 40202 | 37.0% | 37.9%(-0.900)#99 | 38.2%(-1.20)#7,959 |
| 16. | 40228 | 36.9% | 37.9%(-1.00)#100 | 38.2%(-1.30)#7,997 |
| 17. | 40242 | 36.3% | 37.9%(-1.60)#102 | 38.2%(-1.90)#8,330 |
| 18. | 40291 | 36.1% | 37.9%(-1.80)#104 | 38.2%(-2.10)#8,378 |
| 19. | 40217 | 35.8% | 37.9%(-2.10)#107 | 38.2%(-2.40)#8,530 |
| 20. | 40208 | 33.0% | 37.9%(-4.90)#117 | 38.2%(-5.20)#9,760 |
| 21. | 40216 | 32.9% | 37.9%(-5.00)#118 | 38.2%(-5.30)#9,781 |
| 22. | 40204 | 32.7% | 37.9%(-5.20)#119 | 38.2%(-5.50)#9,915 |
| 23. | 40258 | 30.6% | 37.9%(-7.30)#125 | 38.2%(-7.60)#10,718 |
| 24. | 40211 | 30.4% | 37.9%(-7.50)#126 | 38.2%(-7.80)#10,800 |
| 25. | 40220 | 29.8% | 37.9%(-8.10)#129 | 38.2%(-8.40)#10,975 |
| 26. | 40229 | 29.3% | 37.9%(-8.60)#131 | 38.2%(-8.90)#11,177 |
| 27. | 40210 | 28.0% | 37.9%(-9.90)#138 | 38.2%(-10.2)#11,537 |
| 28. | 40214 | 27.6% | 37.9%(-10.3)#141 | 38.2%(-10.6)#11,666 |
| 29. | 40272 | 24.9% | 37.9%(-13.0)#148 | 38.2%(-13.3)#12,234 |
| 30. | 40212 | 22.0% | 37.9%(-15.9)#156 | 38.2%(-16.2)#12,758 |
1
Common Questions
What are the Top 10 Zip Codes with the Highest Percentage of Population Taking Taxi / Cab to Work in Louisville, KY?
Top 10 Zip Codes with the Highest Percentage of Population Taking Taxi / Cab to Work in Louisville, KY are:
What zip code has the Highest Percentage of Population Taking Taxi / Cab to Work in Louisville, KY?
40222 has the Highest Percentage of Population Taking Taxi / Cab to Work in Louisville, KY with 53.4%.
What is the Percentage of Population Taking Taxi / Cab to Work in Louisville, KY?
Percentage of Population Taking Taxi / Cab to Work in Louisville is 33.4%.
What is the Percentage of Population Taking Taxi / Cab to Work in Kentucky?
Percentage of Population Taking Taxi / Cab to Work in Kentucky is 37.9%.
What is the Percentage of Population Taking Taxi / Cab to Work in the United States?
Percentage of Population Taking Taxi / Cab to Work in the United States is 38.2%.