Zip Codes with the Highest Percentage of Households Without a Vehicle in Louisville, KY
RELATED REPORTS & OPTIONS
Households without a Cars
Louisville
Compare Zip Codes
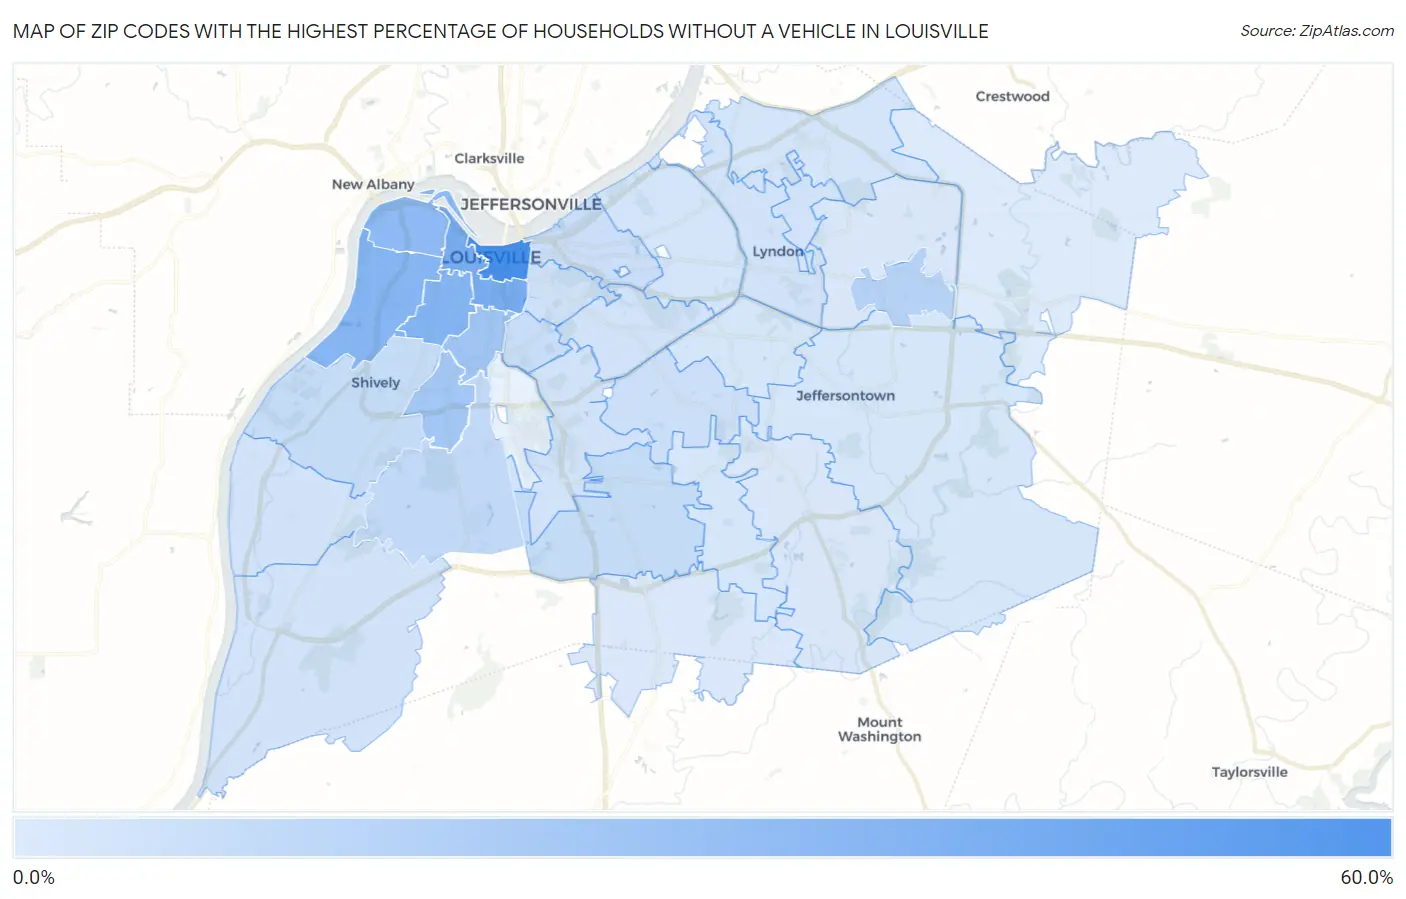
Map of Zip Codes with the Highest Percentage of Households Without a Vehicle in Louisville
2.0%
54.2%
Zip Codes with the Highest Percentage of Households Without a Vehicle in Louisville, KY
| Zip Code | Housholds Without a Car | vs State | vs National | |
| 1. | 40202 | 54.2% | 6.7%(+47.5)#3 | 8.3%(+45.9)#316 |
| 2. | 40203 | 34.7% | 6.7%(+28.0)#11 | 8.3%(+26.4)#642 |
| 3. | 40210 | 31.0% | 6.7%(+24.3)#13 | 8.3%(+22.7)#764 |
| 4. | 40211 | 29.8% | 6.7%(+23.1)#14 | 8.3%(+21.5)#808 |
| 5. | 40212 | 26.9% | 6.7%(+20.2)#21 | 8.3%(+18.6)#947 |
| 6. | 40208 | 20.1% | 6.7%(+13.4)#39 | 8.3%(+11.8)#1,487 |
| 7. | 40215 | 19.6% | 6.7%(+12.9)#40 | 8.3%(+11.3)#1,554 |
| 8. | 40243 | 13.6% | 6.7%(+6.90)#81 | 8.3%(+5.30)#2,849 |
| 9. | 40214 | 10.0% | 6.7%(+3.30)#147 | 8.3%(+1.70)#4,839 |
| 10. | 40216 | 9.0% | 6.7%(+2.30)#178 | 8.3%(+0.700)#5,723 |
| 11. | 40219 | 8.9% | 6.7%(+2.20)#185 | 8.3%(+0.600)#5,830 |
| 12. | 40217 | 7.8% | 6.7%(+1.10)#215 | 8.3%(-0.500)#7,260 |
| 13. | 40206 | 7.3% | 6.7%(+0.600)#237 | 8.3%(-1.00)#8,055 |
| 14. | 40218 | 6.8% | 6.7%(+0.100)#261 | 8.3%(-1.50)#8,855 |
| 15. | 40204 | 5.8% | 6.7%(-0.900)#308 | 8.3%(-2.50)#10,945 |
| 16. | 40222 | 5.5% | 6.7%(-1.20)#324 | 8.3%(-2.80)#11,644 |
| 17. | 40242 | 5.4% | 6.7%(-1.30)#332 | 8.3%(-2.90)#11,904 |
| 18. | 40205 | 5.2% | 6.7%(-1.50)#343 | 8.3%(-3.10)#12,361 |
| 19. | 40272 | 5.1% | 6.7%(-1.60)#350 | 8.3%(-3.20)#12,592 |
| 20. | 40258 | 5.1% | 6.7%(-1.60)#351 | 8.3%(-3.20)#12,613 |
| 21. | 40213 | 5.0% | 6.7%(-1.70)#355 | 8.3%(-3.30)#12,901 |
| 22. | 40241 | 4.4% | 6.7%(-2.30)#382 | 8.3%(-3.90)#14,491 |
| 23. | 40207 | 4.3% | 6.7%(-2.40)#389 | 8.3%(-4.00)#14,801 |
| 24. | 40220 | 4.2% | 6.7%(-2.50)#399 | 8.3%(-4.10)#15,105 |
| 25. | 40228 | 4.0% | 6.7%(-2.70)#416 | 8.3%(-4.30)#15,750 |
| 26. | 40299 | 3.7% | 6.7%(-3.00)#430 | 8.3%(-4.60)#16,647 |
| 27. | 40291 | 3.5% | 6.7%(-3.20)#443 | 8.3%(-4.80)#17,306 |
| 28. | 40223 | 3.1% | 6.7%(-3.60)#470 | 8.3%(-5.20)#18,748 |
| 29. | 40229 | 2.9% | 6.7%(-3.80)#482 | 8.3%(-5.40)#19,382 |
| 30. | 40245 | 2.0% | 6.7%(-4.70)#529 | 8.3%(-6.30)#22,433 |
1
Common Questions
What are the Top 10 Zip Codes with the Highest Percentage of Households Without a Vehicle in Louisville, KY?
Top 10 Zip Codes with the Highest Percentage of Households Without a Vehicle in Louisville, KY are:
What zip code has the Highest Percentage of Households Without a Vehicle in Louisville, KY?
40202 has the Highest Percentage of Households Without a Vehicle in Louisville, KY with 54.2%.
What is the Percentage of Households Without a Vehicle in Louisville, KY?
Percentage of Households Without a Vehicle in Louisville is 10.0%.
What is the Percentage of Households Without a Vehicle in Kentucky?
Percentage of Households Without a Vehicle in Kentucky is 6.7%.
What is the Percentage of Households Without a Vehicle in the United States?
Percentage of Households Without a Vehicle in the United States is 8.3%.