Zip Codes with the Highest Percentage of Population with a Degree in Bio, Nature & Agricultural in Louisville, KY
RELATED REPORTS & OPTIONS
Bio, Nature & Agricultural
Louisville
Compare Zip Codes
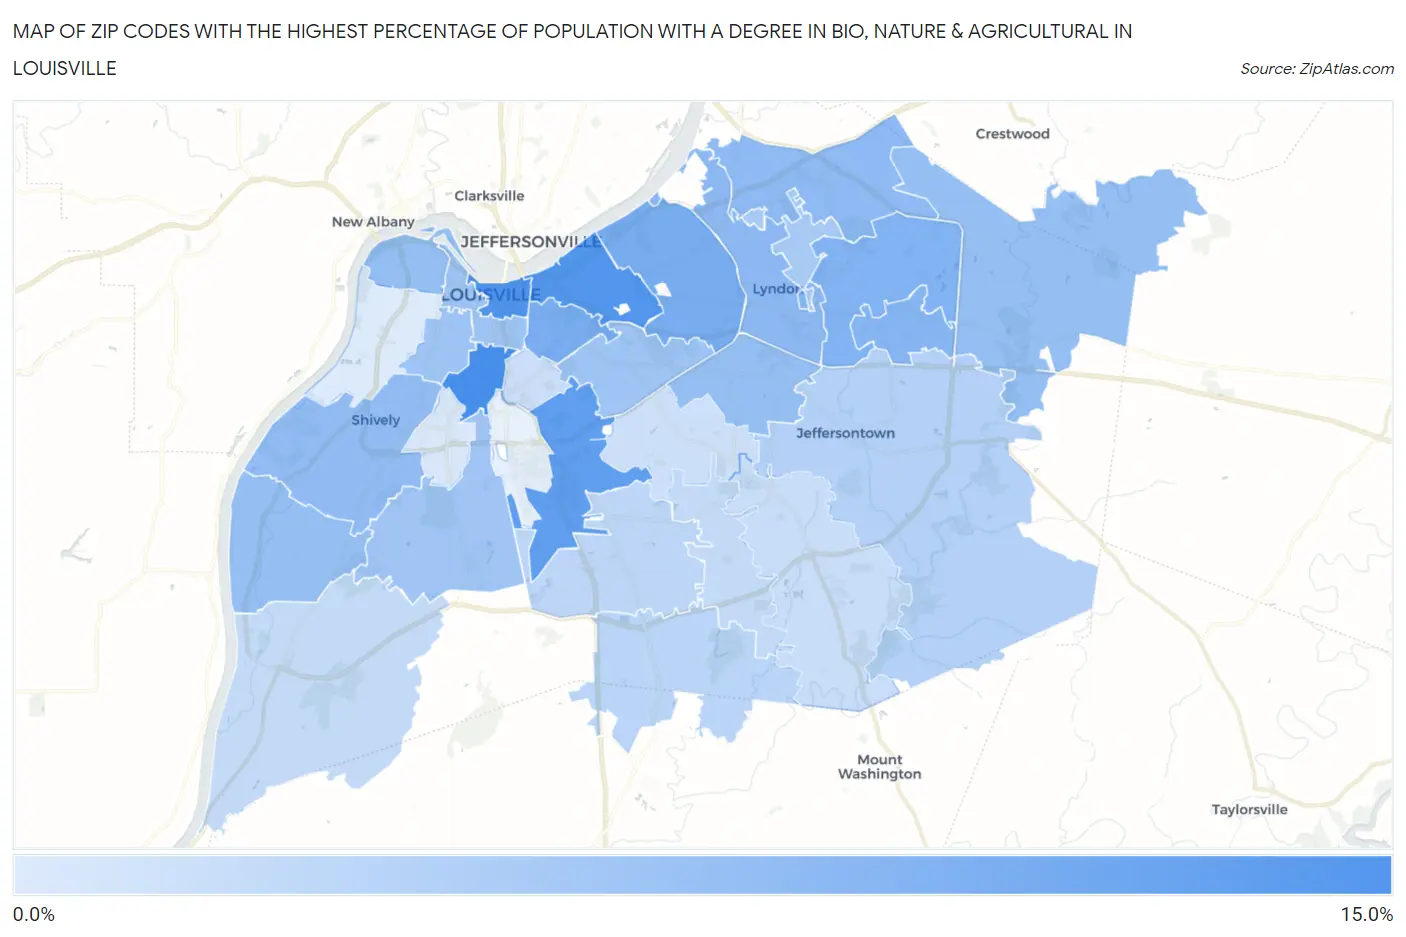
Map of Zip Codes with the Highest Percentage of Population with a Degree in Bio, Nature & Agricultural in Louisville
1.4%
10.5%
Zip Codes with the Highest Percentage of Population with a Degree in Bio, Nature & Agricultural in Louisville, KY
| Zip Code | % Graduates | vs State | vs National | |
| 1. | 40208 | 10.5% | 6.6%(+3.94)#146 | 6.4%(+4.16)#7,565 |
| 2. | 40202 | 10.1% | 6.6%(+3.50)#154 | 6.4%(+3.73)#8,026 |
| 3. | 40206 | 9.8% | 6.6%(+3.27)#162 | 6.4%(+3.49)#8,317 |
| 4. | 40213 | 9.0% | 6.6%(+2.41)#183 | 6.4%(+2.64)#9,552 |
| 5. | 40207 | 7.5% | 6.6%(+0.916)#218 | 6.4%(+1.14)#12,192 |
| 6. | 40204 | 7.4% | 6.6%(+0.782)#225 | 6.4%(+1.01)#12,500 |
| 7. | 40223 | 6.9% | 6.6%(+0.311)#242 | 6.4%(+0.536)#13,615 |
| 8. | 40243 | 6.6% | 6.6%(+0.030)#251 | 6.4%(+0.255)#14,343 |
| 9. | 40222 | 6.3% | 6.6%(-0.321)#261 | 6.4%(-0.096)#15,227 |
| 10. | 40241 | 6.1% | 6.6%(-0.522)#268 | 6.4%(-0.297)#15,756 |
| 11. | 40216 | 5.9% | 6.6%(-0.657)#270 | 6.4%(-0.432)#16,154 |
| 12. | 40258 | 5.7% | 6.6%(-0.868)#275 | 6.4%(-0.643)#16,734 |
| 13. | 40220 | 5.7% | 6.6%(-0.908)#277 | 6.4%(-0.683)#16,822 |
| 14. | 40245 | 5.7% | 6.6%(-0.919)#278 | 6.4%(-0.694)#16,847 |
| 15. | 40212 | 5.6% | 6.6%(-0.948)#280 | 6.4%(-0.723)#16,932 |
| 16. | 40205 | 5.1% | 6.6%(-1.47)#299 | 6.4%(-1.25)#18,490 |
| 17. | 40203 | 5.1% | 6.6%(-1.51)#301 | 6.4%(-1.28)#18,598 |
| 18. | 40210 | 5.0% | 6.6%(-1.53)#303 | 6.4%(-1.30)#18,652 |
| 19. | 40214 | 5.0% | 6.6%(-1.62)#307 | 6.4%(-1.39)#18,909 |
| 20. | 40242 | 4.5% | 6.6%(-2.06)#326 | 6.4%(-1.83)#20,205 |
| 21. | 40299 | 3.9% | 6.6%(-2.68)#347 | 6.4%(-2.46)#21,920 |
| 22. | 40229 | 3.5% | 6.6%(-3.13)#369 | 6.4%(-2.90)#22,910 |
| 23. | 40219 | 3.3% | 6.6%(-3.28)#374 | 6.4%(-3.05)#23,255 |
| 24. | 40272 | 3.0% | 6.6%(-3.62)#384 | 6.4%(-3.40)#23,979 |
| 25. | 40228 | 2.9% | 6.6%(-3.65)#385 | 6.4%(-3.42)#24,019 |
| 26. | 40291 | 2.7% | 6.6%(-3.87)#391 | 6.4%(-3.65)#24,384 |
| 27. | 40217 | 2.5% | 6.6%(-4.07)#398 | 6.4%(-3.85)#24,702 |
| 28. | 40218 | 2.3% | 6.6%(-4.25)#402 | 6.4%(-4.02)#24,944 |
| 29. | 40215 | 1.7% | 6.6%(-4.87)#425 | 6.4%(-4.65)#25,665 |
| 30. | 40211 | 1.4% | 6.6%(-5.15)#431 | 6.4%(-4.93)#25,900 |
1
Common Questions
What are the Top 10 Zip Codes with the Highest Percentage of Population with a Degree in Bio, Nature & Agricultural in Louisville, KY?
Top 10 Zip Codes with the Highest Percentage of Population with a Degree in Bio, Nature & Agricultural in Louisville, KY are:
What zip code has the Highest Percentage of Population with a Degree in Bio, Nature & Agricultural in Louisville, KY?
40208 has the Highest Percentage of Population with a Degree in Bio, Nature & Agricultural in Louisville, KY with 10.5%.
What is the Percentage of Population with a Degree in Bio, Nature & Agricultural in Louisville, KY?
Percentage of Population with a Degree in Bio, Nature & Agricultural in Louisville is 5.1%.
What is the Percentage of Population with a Degree in Bio, Nature & Agricultural in Kentucky?
Percentage of Population with a Degree in Bio, Nature & Agricultural in Kentucky is 6.6%.
What is the Percentage of Population with a Degree in Bio, Nature & Agricultural in the United States?
Percentage of Population with a Degree in Bio, Nature & Agricultural in the United States is 6.4%.