Zip Codes with the Highest Percentage of Population Employed in Administrative & Support Services in Louisville, KY
RELATED REPORTS & OPTIONS
Administrative & Support Services
Louisville
Compare Zip Codes
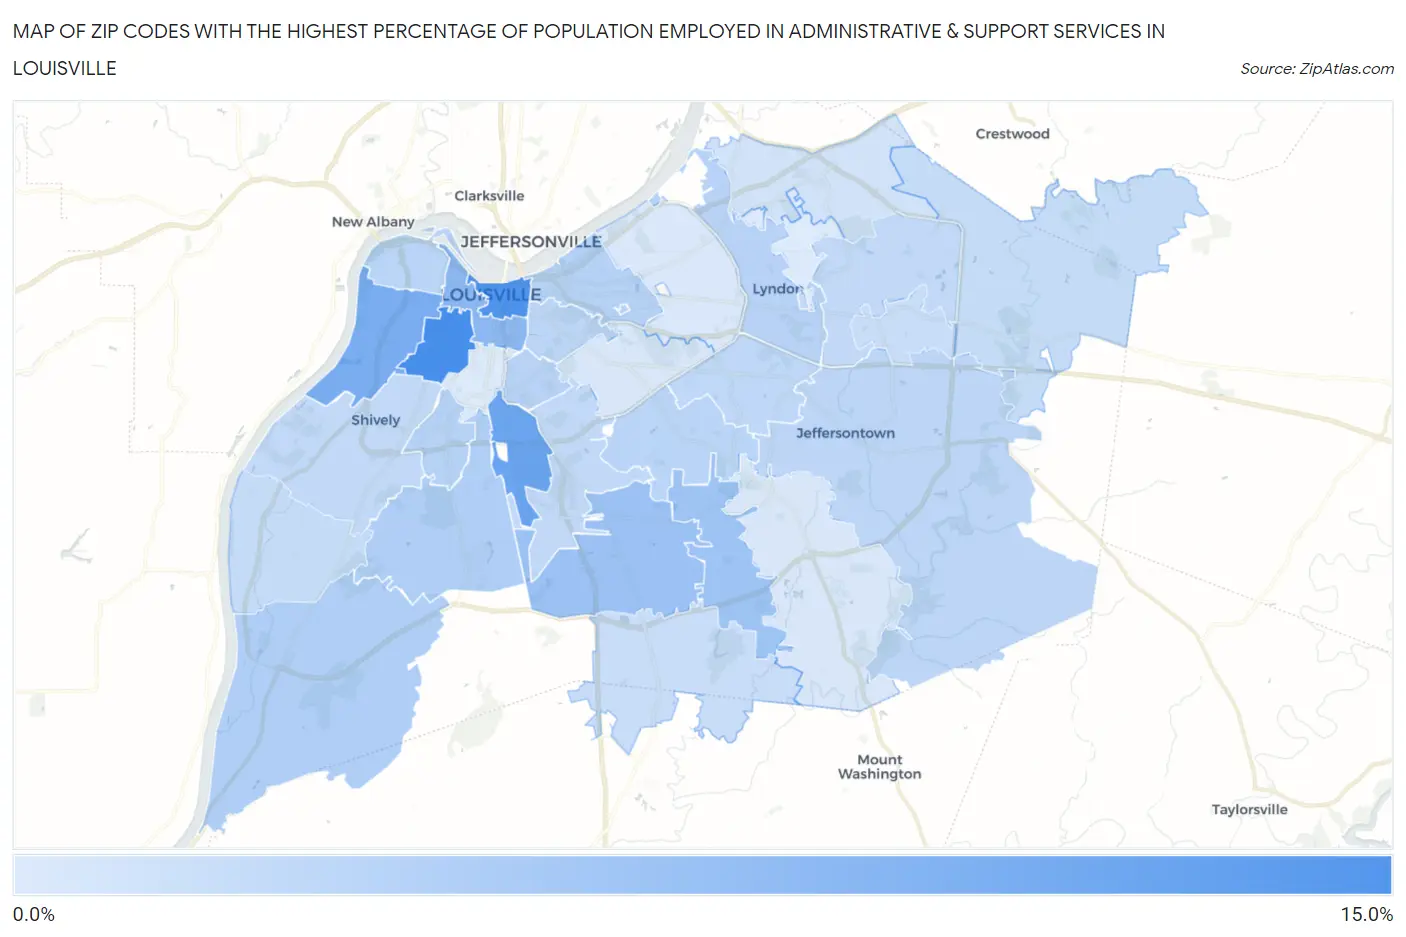
Map of Zip Codes with the Highest Percentage of Population Employed in Administrative & Support Services in Louisville
2.4%
12.0%
Zip Codes with the Highest Percentage of Population Employed in Administrative & Support Services in Louisville, KY
| Zip Code | % Employed | vs State | vs National | |
| 1. | 40210 | 12.0% | 4.0%(+8.03)#44 | 4.1%(+7.84)#850 |
| 2. | 40202 | 11.3% | 4.0%(+7.37)#47 | 4.1%(+7.18)#955 |
| 3. | 40209 | 9.6% | 4.0%(+5.62)#60 | 4.1%(+5.42)#1,441 |
| 4. | 40211 | 8.6% | 4.0%(+4.68)#69 | 4.1%(+4.49)#1,887 |
| 5. | 40203 | 7.5% | 4.0%(+3.52)#86 | 4.1%(+3.33)#2,710 |
| 6. | 40219 | 6.5% | 4.0%(+2.57)#114 | 4.1%(+2.38)#3,860 |
| 7. | 40228 | 6.3% | 4.0%(+2.36)#121 | 4.1%(+2.17)#4,216 |
| 8. | 40214 | 5.1% | 4.0%(+1.11)#176 | 4.1%(+0.922)#6,916 |
| 9. | 40272 | 5.0% | 4.0%(+1.06)#178 | 4.1%(+0.871)#7,049 |
| 10. | 40206 | 4.8% | 4.0%(+0.812)#194 | 4.1%(+0.621)#7,818 |
| 11. | 40215 | 4.7% | 4.0%(+0.788)#195 | 4.1%(+0.597)#7,887 |
| 12. | 40222 | 4.7% | 4.0%(+0.705)#199 | 4.1%(+0.514)#8,150 |
| 13. | 40217 | 4.6% | 4.0%(+0.632)#205 | 4.1%(+0.441)#8,408 |
| 14. | 40212 | 4.5% | 4.0%(+0.560)#208 | 4.1%(+0.369)#8,664 |
| 15. | 40218 | 4.5% | 4.0%(+0.494)#215 | 4.1%(+0.303)#8,868 |
| 16. | 40280 | 4.4% | 4.0%(+0.471)#217 | 4.1%(+0.281)#8,952 |
| 17. | 40204 | 4.4% | 4.0%(+0.465)#219 | 4.1%(+0.274)#8,980 |
| 18. | 40299 | 4.3% | 4.0%(+0.340)#229 | 4.1%(+0.149)#9,453 |
| 19. | 40220 | 4.2% | 4.0%(+0.230)#239 | 4.1%(+0.039)#9,869 |
| 20. | 40223 | 4.1% | 4.0%(+0.140)#245 | 4.1%(-0.051)#10,242 |
| 21. | 40213 | 4.1% | 4.0%(+0.137)#246 | 4.1%(-0.054)#10,251 |
| 22. | 40216 | 4.1% | 4.0%(+0.100)#248 | 4.1%(-0.091)#10,429 |
| 23. | 40245 | 3.8% | 4.0%(-0.116)#263 | 4.1%(-0.307)#11,356 |
| 24. | 40258 | 3.7% | 4.0%(-0.234)#274 | 4.1%(-0.425)#11,890 |
| 25. | 40243 | 3.6% | 4.0%(-0.324)#278 | 4.1%(-0.515)#12,303 |
| 26. | 40229 | 3.6% | 4.0%(-0.369)#282 | 4.1%(-0.560)#12,516 |
| 27. | 40241 | 3.1% | 4.0%(-0.878)#313 | 4.1%(-1.07)#15,087 |
| 28. | 40291 | 2.7% | 4.0%(-1.29)#351 | 4.1%(-1.48)#17,232 |
| 29. | 40205 | 2.6% | 4.0%(-1.32)#354 | 4.1%(-1.51)#17,419 |
| 30. | 40207 | 2.5% | 4.0%(-1.48)#372 | 4.1%(-1.67)#18,240 |
| 31. | 40208 | 2.4% | 4.0%(-1.57)#382 | 4.1%(-1.76)#18,695 |
| 32. | 40242 | 2.4% | 4.0%(-1.59)#383 | 4.1%(-1.78)#18,841 |
1
Common Questions
What are the Top 10 Zip Codes with the Highest Percentage of Population Employed in Administrative & Support Services in Louisville, KY?
Top 10 Zip Codes with the Highest Percentage of Population Employed in Administrative & Support Services in Louisville, KY are:
What zip code has the Highest Percentage of Population Employed in Administrative & Support Services in Louisville, KY?
40210 has the Highest Percentage of Population Employed in Administrative & Support Services in Louisville, KY with 12.0%.
What is the Percentage of Population Employed in Administrative & Support Services in Louisville, KY?
Percentage of Population Employed in Administrative & Support Services in Louisville is 4.5%.
What is the Percentage of Population Employed in Administrative & Support Services in Kentucky?
Percentage of Population Employed in Administrative & Support Services in Kentucky is 4.0%.
What is the Percentage of Population Employed in Administrative & Support Services in the United States?
Percentage of Population Employed in Administrative & Support Services in the United States is 4.1%.