Zip Codes with the Highest Percentage of Self-Employed / Not Incorporated in Louisville, KY

RELATED REPORTS & OPTIONS

Self-Employed / Not Incorporated
Population
Families and Households
Female Fertility
Female Fertility (Unmarried)
Race (Community Size)
Race (Percentage)
Ancestry (Community Size)
AfghanAfricanAlaska NativeAlbanianAlsatianAmericanApacheArabArgentineanArmenianAssyrian / Chaldean / SyriacAustralianAustrianBahamianBangladeshiBarbadianBelgianBelizeanBhutaneseBlackfeetBolivianBrazilianBritishBritish West IndianBulgarianBurmeseCajunCambodianCanadianCape VerdeanCelticCentral AmericanCentral American IndianCherokeeChickasawChileanChippewaChoctawColombianComancheCosta RicanCreekCroatianCrowCubanCzechCzechoslovakianDanishDominicanDutchEastern EuropeanEcuadorianEgyptianEnglishEstonianEthiopianEuropeanFilipinoFinnishFrenchFrench American IndianFrench CanadianGermanGhanaianGreekGuamanian / ChamorroGuatemalanHaitianHonduranHungarianIcelanderIndian (Asian)IndonesianInupiatIranianIraqiIrishIroquoisIsraeliItalianJamaicanJapaneseJordanianKenyanKoreanLaotianLatvianLebaneseLiberianLithuanianLumbeeLuxembourgerMalaysianMexicanMexican American IndianMongolianMoroccanNative HawaiianNew ZealanderNicaraguanNigerianNorthern EuropeanNorwegianOsagePakistaniPalestinianPanamanianParaguayanPennsylvania GermanPeruvianPolishPortuguesePotawatomiPuebloPuerto RicanRomanianRussianSalvadoranSamoanScandinavianScotch-IrishScottishSeminoleSerbianSiouxSlavicSlovakSloveneSomaliSouth AfricanSouth AmericanSpaniardSpanishSri LankanSubsaharan AfricanSudaneseSwedishSwissSyrianThaiTohono O'OdhamTrinidadian and TobagonianTurkishU.S. Virgin IslanderUgandanUkrainianVenezuelanWelshWest IndianYugoslavian
Ancestry (Percentage)
AfghanAfricanAlaska NativeAlbanianAlsatianAmericanApacheArabArgentineanArmenianAssyrian / Chaldean / SyriacAustralianAustrianBahamianBangladeshiBarbadianBelgianBelizeanBhutaneseBlackfeetBolivianBrazilianBritishBritish West IndianBulgarianBurmeseCajunCambodianCanadianCape VerdeanCelticCentral AmericanCentral American IndianCherokeeChickasawChileanChippewaChoctawColombianComancheCosta RicanCreekCroatianCrowCubanCzechCzechoslovakianDanishDominicanDutchEastern EuropeanEcuadorianEgyptianEnglishEstonianEthiopianEuropeanFilipinoFinnishFrenchFrench American IndianFrench CanadianGermanGhanaianGreekGuamanian / ChamorroGuatemalanHaitianHonduranHungarianIcelanderIndian (Asian)IndonesianInupiatIranianIraqiIrishIroquoisIsraeliItalianJamaicanJapaneseJordanianKenyanKoreanLaotianLatvianLebaneseLiberianLithuanianLumbeeLuxembourgerMalaysianMexicanMexican American IndianMongolianMoroccanNative HawaiianNew ZealanderNicaraguanNigerianNorthern EuropeanNorwegianOsagePakistaniPalestinianPanamanianParaguayanPennsylvania GermanPeruvianPolishPortuguesePotawatomiPuebloPuerto RicanRomanianRussianSalvadoranSamoanScandinavianScotch-IrishScottishSeminoleSerbianSiouxSlavicSlovakSloveneSomaliSouth AfricanSouth AmericanSpaniardSpanishSri LankanSubsaharan AfricanSudaneseSwedishSwissSyrianThaiTohono O'OdhamTrinidadian and TobagonianTurkishU.S. Virgin IslanderUgandanUkrainianVenezuelanWelshWest IndianYugoslavian
Immigrant Origin (Total)
AfghanistanAfricaAlbaniaArgentinaAsiaAustraliaAustriaBangladeshBarbadosBelarusBelgiumBelizeBoliviaBosnia and HerzegovinaBrazilBulgariaBurma / MyanmarCambodiaCameroonCanadaCaribbeanCentral AmericaChileChinaColombiaCongoCosta RicaCroatiaCubaCzechoslovakiaDenmarkDominican RepublicEastern AfricaEastern AsiaEastern EuropeEcuadorEgyptEl SalvadorEnglandEritreaEthiopiaEuropeFranceGermanyGhanaGuatemalaGuyanaHaitiHondurasHong KongHungaryIndiaIndonesiaIranIraqIrelandIsraelItalyJamaicaJapanJordanKazakhstanKenyaKoreaKuwaitLaosLatin AmericaLebanonLiberiaLithuaniaMalaysiaMexicoMicronesiaMiddle AfricaMoldovaMoroccoNepalNetherlandsNicaraguaNigeriaNorthern AfricaNorthern EuropeNorwayOceaniaPakistanPanamaPeruPhilippinesPolandPortugalRomaniaRussiaSaudi ArabiaScotlandSenegalSerbiaSingaporeSomaliaSouth AfricaSouth AmericaSouth Central AsiaSouth Eastern AsiaSouthern EuropeSpainSri LankaSudanSwedenSyriaTaiwanThailandTrinidad and TobagoTurkeyUgandaUkraineUzbekistanVenezuelaVietnamWestern AfricaWestern AsiaWestern EuropeZaire
Immigrant Origin (Percentage)
AfghanistanAfricaAlbaniaArgentinaAsiaAustraliaAustriaBangladeshBarbadosBelarusBelgiumBelizeBoliviaBosnia and HerzegovinaBrazilBulgariaBurma / MyanmarCambodiaCameroonCanadaCaribbeanCentral AmericaChileChinaColombiaCongoCosta RicaCroatiaCubaCzechoslovakiaDenmarkDominican RepublicEastern AfricaEastern AsiaEastern EuropeEcuadorEgyptEl SalvadorEnglandEritreaEthiopiaEuropeFranceGermanyGhanaGuatemalaGuyanaHaitiHondurasHong KongHungaryIndiaIndonesiaIranIraqIrelandIsraelItalyJamaicaJapanJordanKazakhstanKenyaKoreaKuwaitLaosLatin AmericaLebanonLiberiaLithuaniaMalaysiaMexicoMicronesiaMiddle AfricaMoldovaMoroccoNepalNetherlandsNicaraguaNigeriaNorthern AfricaNorthern EuropeNorwayOceaniaPakistanPanamaPeruPhilippinesPolandPortugalRomaniaRussiaSaudi ArabiaScotlandSenegalSerbiaSingaporeSomaliaSouth AfricaSouth AmericaSouth Central AsiaSouth Eastern AsiaSouthern EuropeSpainSri LankaSudanSwedenSyriaTaiwanThailandTrinidad and TobagoTurkeyUgandaUkraineUzbekistanVenezuelaVietnamWestern AfricaWestern AsiaWestern EuropeZaire
Income
Income (Families)
Income (Households)
Poverty
Poverty (Families)
Unemployment
Employment Occupations
Employment Industries
Employer Class
Commute Time
Commute Means
School Enrollment
Education by Degree Field
Occupancy
Finances
Physical Characteristics
Louisville
Compare Zip Codes
Comparison Subject

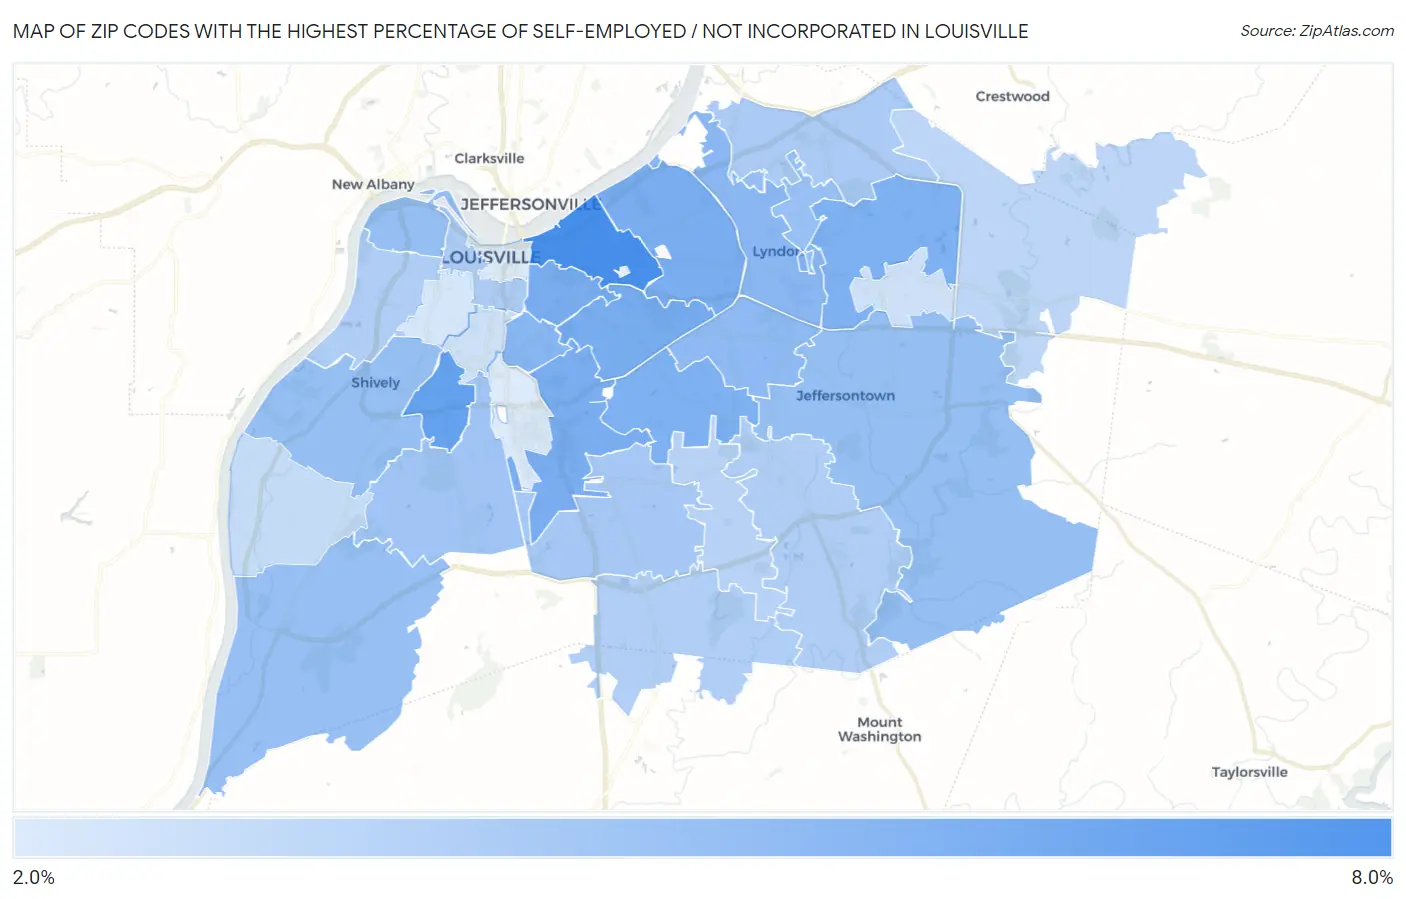
Map of Zip Codes with the Highest Percentage of Self-Employed / Not Incorporated in Louisville

0.0%
8.0%
Zip Codes with the Highest Percentage of Self-Employed / Not Incorporated in Louisville Map

Zip Codes with the Highest Percentage of Self-Employed / Not Incorporated in Louisville, KY

Zip Code % Self-Employed / Not Incorporated vs State vs National
1.402067.3%5.1%(+2.17)#2235.8%(+1.50)#12,260
2.402156.2%5.1%(+1.08)#2595.8%(+0.400)#15,368
3.402055.6%5.1%(+0.462)#2965.8%(-0.214)#17,399
4.402075.6%5.1%(+0.421)#2995.8%(-0.255)#17,559
5.402045.6%5.1%(+0.417)#3005.8%(-0.259)#17,573
6.402135.5%5.1%(+0.363)#3055.8%(-0.313)#17,771
7.402185.4%5.1%(+0.249)#3135.8%(-0.427)#18,171
8.402235.4%5.1%(+0.237)#3165.8%(-0.439)#18,218
9.402175.0%5.1%(-0.131)#3395.8%(-0.807)#19,638
10.402225.0%5.1%(-0.173)#3455.8%(-0.849)#19,785
11.402204.8%5.1%(-0.373)#3515.8%(-1.05)#20,556
12.402164.6%5.1%(-0.573)#3715.8%(-1.25)#21,292
13.402124.5%5.1%(-0.604)#3755.8%(-1.28)#21,440
14.402994.5%5.1%(-0.607)#3765.8%(-1.28)#21,453
15.402724.5%5.1%(-0.628)#3785.8%(-1.30)#21,533
16.402424.4%5.1%(-0.694)#3815.8%(-1.37)#21,800
17.402144.2%5.1%(-0.944)#3955.8%(-1.62)#22,694
18.402194.0%5.1%(-1.14)#4095.8%(-1.82)#23,399
19.402413.8%5.1%(-1.31)#4255.8%(-1.99)#23,985
20.402033.8%5.1%(-1.34)#4295.8%(-2.02)#24,073
21.402913.7%5.1%(-1.43)#4365.8%(-2.10)#24,366
22.402113.6%5.1%(-1.49)#4405.8%(-2.17)#24,567
23.402293.6%5.1%(-1.50)#4415.8%(-2.18)#24,598
24.402283.4%5.1%(-1.74)#4585.8%(-2.42)#25,319
25.402453.2%5.1%(-1.89)#4685.8%(-2.57)#25,744
26.402582.9%5.1%(-2.26)#4855.8%(-2.93)#26,649
27.402432.6%5.1%(-2.52)#4995.8%(-3.20)#27,208
28.402082.6%5.1%(-2.55)#5025.8%(-3.23)#27,272
29.402102.4%5.1%(-2.78)#5085.8%(-3.46)#27,654
30.402092.1%5.1%(-3.01)#5235.8%(-3.69)#28,054
31.402022.1%5.1%(-3.03)#5245.8%(-3.70)#28,078

Common Questions

What are the Top 10 Zip Codes with the Highest Percentage of Self-Employed / Not Incorporated in Louisville, KY?
Top 10 Zip Codes with the Highest Percentage of Self-Employed / Not Incorporated in Louisville, KY are:
#1
7.3%
#2
6.2%
#3
5.6%
#4
5.6%
#5
5.6%
#6
5.5%
#7
5.4%
#8
5.4%
#9
5.0%
#10
5.0%
What zip code has the Highest Percentage of Self-Employed / Not Incorporated in Louisville, KY?
40206 has the Highest Percentage of Self-Employed / Not Incorporated in Louisville, KY with 7.3%.
What is the Percentage of Self-Employed / Not Incorporated in Louisville, KY?
Percentage of Self-Employed / Not Incorporated in Louisville is 4.6%.
What is the Percentage of Self-Employed / Not Incorporated in Kentucky?
Percentage of Self-Employed / Not Incorporated in Kentucky is 5.1%.
What is the Percentage of Self-Employed / Not Incorporated in the United States?
Percentage of Self-Employed / Not Incorporated in the United States is 5.8%.