Zip Codes with the Highest Percentage of Population Employed in Education Instruction & Library in Louisville, KY
RELATED REPORTS & OPTIONS
Education Instruction & Library
Louisville
Compare Zip Codes
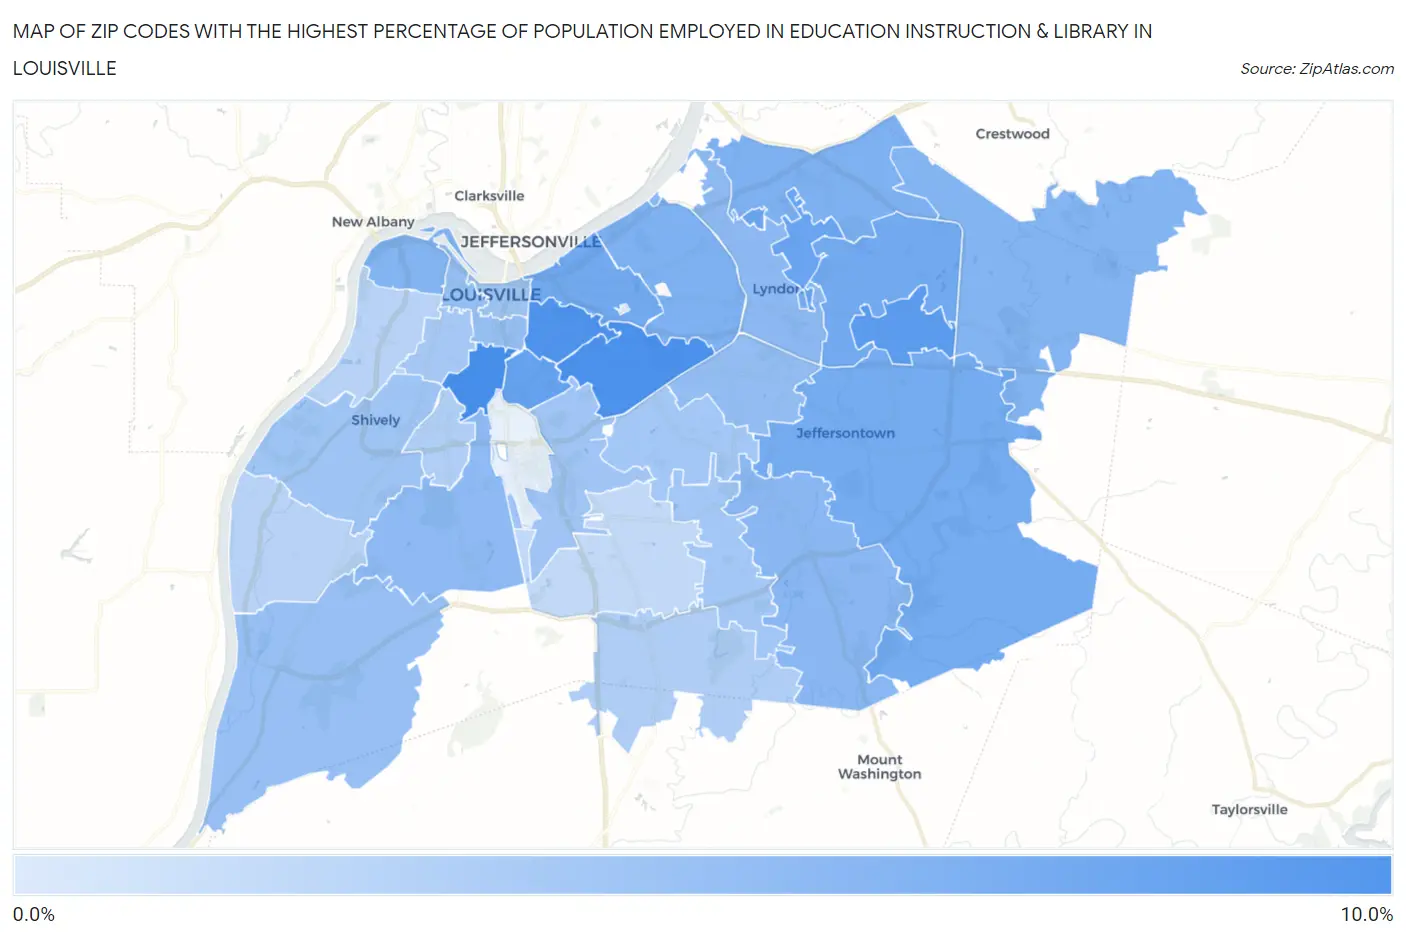
Map of Zip Codes with the Highest Percentage of Population Employed in Education Instruction & Library in Louisville
0.63%
9.8%
Zip Codes with the Highest Percentage of Population Employed in Education Instruction & Library in Louisville, KY
| Zip Code | % Employed | vs State | vs National | |
| 1. | 40208 | 9.8% | 6.0%(+3.87)#101 | 6.2%(+3.64)#4,145 |
| 2. | 40205 | 9.6% | 6.0%(+3.59)#105 | 6.2%(+3.37)#4,467 |
| 3. | 40204 | 9.4% | 6.0%(+3.42)#108 | 6.2%(+3.20)#4,671 |
| 4. | 40243 | 8.5% | 6.0%(+2.57)#136 | 6.2%(+2.35)#6,032 |
| 5. | 40217 | 7.9% | 6.0%(+1.97)#155 | 6.2%(+1.74)#7,325 |
| 6. | 40242 | 7.6% | 6.0%(+1.69)#167 | 6.2%(+1.47)#8,052 |
| 7. | 40206 | 7.1% | 6.0%(+1.13)#196 | 6.2%(+0.904)#9,634 |
| 8. | 40223 | 7.0% | 6.0%(+1.07)#199 | 6.2%(+0.845)#9,810 |
| 9. | 40299 | 6.9% | 6.0%(+0.966)#206 | 6.2%(+0.740)#10,159 |
| 10. | 40241 | 6.3% | 6.0%(+0.339)#253 | 6.2%(+0.113)#12,385 |
| 11. | 40207 | 6.3% | 6.0%(+0.338)#254 | 6.2%(+0.112)#12,390 |
| 12. | 40245 | 6.1% | 6.0%(+0.098)#268 | 6.2%(-0.128)#13,291 |
| 13. | 40212 | 6.0% | 6.0%(+0.062)#269 | 6.2%(-0.164)#13,423 |
| 14. | 40291 | 5.6% | 6.0%(-0.365)#298 | 6.2%(-0.591)#15,182 |
| 15. | 40222 | 5.5% | 6.0%(-0.445)#307 | 6.2%(-0.671)#15,503 |
| 16. | 40214 | 5.3% | 6.0%(-0.629)#314 | 6.2%(-0.855)#16,277 |
| 17. | 40220 | 5.1% | 6.0%(-0.834)#331 | 6.2%(-1.06)#17,108 |
| 18. | 40203 | 4.9% | 6.0%(-1.06)#354 | 6.2%(-1.29)#18,081 |
| 19. | 40272 | 4.7% | 6.0%(-1.21)#364 | 6.2%(-1.44)#18,738 |
| 20. | 40216 | 4.4% | 6.0%(-1.58)#390 | 6.2%(-1.80)#20,213 |
| 21. | 40202 | 4.3% | 6.0%(-1.66)#397 | 6.2%(-1.88)#20,500 |
| 22. | 40213 | 4.2% | 6.0%(-1.80)#403 | 6.2%(-2.03)#21,084 |
| 23. | 40218 | 4.1% | 6.0%(-1.84)#411 | 6.2%(-2.07)#21,245 |
| 24. | 40228 | 4.1% | 6.0%(-1.88)#412 | 6.2%(-2.11)#21,402 |
| 25. | 40210 | 4.0% | 6.0%(-2.00)#425 | 6.2%(-2.23)#21,823 |
| 26. | 40229 | 3.4% | 6.0%(-2.56)#465 | 6.2%(-2.79)#23,678 |
| 27. | 40215 | 3.2% | 6.0%(-2.75)#482 | 6.2%(-2.97)#24,309 |
| 28. | 40258 | 2.9% | 6.0%(-3.11)#501 | 6.2%(-3.33)#25,179 |
| 29. | 40211 | 2.8% | 6.0%(-3.19)#505 | 6.2%(-3.41)#25,379 |
| 30. | 40219 | 2.3% | 6.0%(-3.64)#525 | 6.2%(-3.86)#26,376 |
| 31. | 40280 | 0.63% | 6.0%(-5.32)#570 | 6.2%(-5.55)#28,520 |
1
Common Questions
What are the Top 10 Zip Codes with the Highest Percentage of Population Employed in Education Instruction & Library in Louisville, KY?
Top 10 Zip Codes with the Highest Percentage of Population Employed in Education Instruction & Library in Louisville, KY are:
What zip code has the Highest Percentage of Population Employed in Education Instruction & Library in Louisville, KY?
40208 has the Highest Percentage of Population Employed in Education Instruction & Library in Louisville, KY with 9.8%.
What is the Percentage of Population Employed in Education Instruction & Library in Louisville, KY?
Percentage of Population Employed in Education Instruction & Library in Louisville is 5.4%.
What is the Percentage of Population Employed in Education Instruction & Library in Kentucky?
Percentage of Population Employed in Education Instruction & Library in Kentucky is 6.0%.
What is the Percentage of Population Employed in Education Instruction & Library in the United States?
Percentage of Population Employed in Education Instruction & Library in the United States is 6.2%.