Zip Codes with the Highest Percentage of Population with a Degree in Computers and Mathematics in Louisville, KY

RELATED REPORTS & OPTIONS

Computers and Mathematics
Population
Families and Households
Female Fertility
Female Fertility (Unmarried)
Race (Community Size)
Race (Percentage)
Ancestry (Community Size)
AfghanAfricanAlaska NativeAlbanianAlsatianAmericanApacheArabArgentineanArmenianAssyrian / Chaldean / SyriacAustralianAustrianBahamianBangladeshiBarbadianBelgianBelizeanBhutaneseBlackfeetBolivianBrazilianBritishBritish West IndianBulgarianBurmeseCajunCambodianCanadianCape VerdeanCelticCentral AmericanCentral American IndianCherokeeChickasawChileanChippewaChoctawColombianComancheCosta RicanCreekCroatianCrowCubanCzechCzechoslovakianDanishDominicanDutchEastern EuropeanEcuadorianEgyptianEnglishEstonianEthiopianEuropeanFilipinoFinnishFrenchFrench American IndianFrench CanadianGermanGhanaianGreekGuamanian / ChamorroGuatemalanHaitianHonduranHungarianIcelanderIndian (Asian)IndonesianInupiatIranianIraqiIrishIroquoisIsraeliItalianJamaicanJapaneseJordanianKenyanKoreanLaotianLatvianLebaneseLiberianLithuanianLumbeeLuxembourgerMalaysianMexicanMexican American IndianMongolianMoroccanNative HawaiianNew ZealanderNicaraguanNigerianNorthern EuropeanNorwegianOsagePakistaniPalestinianPanamanianParaguayanPennsylvania GermanPeruvianPolishPortuguesePotawatomiPuebloPuerto RicanRomanianRussianSalvadoranSamoanScandinavianScotch-IrishScottishSeminoleSerbianSiouxSlavicSlovakSloveneSomaliSouth AfricanSouth AmericanSpaniardSpanishSri LankanSubsaharan AfricanSudaneseSwedishSwissSyrianThaiTohono O'OdhamTrinidadian and TobagonianTurkishU.S. Virgin IslanderUgandanUkrainianVenezuelanWelshWest IndianYugoslavian
Ancestry (Percentage)
AfghanAfricanAlaska NativeAlbanianAlsatianAmericanApacheArabArgentineanArmenianAssyrian / Chaldean / SyriacAustralianAustrianBahamianBangladeshiBarbadianBelgianBelizeanBhutaneseBlackfeetBolivianBrazilianBritishBritish West IndianBulgarianBurmeseCajunCambodianCanadianCape VerdeanCelticCentral AmericanCentral American IndianCherokeeChickasawChileanChippewaChoctawColombianComancheCosta RicanCreekCroatianCrowCubanCzechCzechoslovakianDanishDominicanDutchEastern EuropeanEcuadorianEgyptianEnglishEstonianEthiopianEuropeanFilipinoFinnishFrenchFrench American IndianFrench CanadianGermanGhanaianGreekGuamanian / ChamorroGuatemalanHaitianHonduranHungarianIcelanderIndian (Asian)IndonesianInupiatIranianIraqiIrishIroquoisIsraeliItalianJamaicanJapaneseJordanianKenyanKoreanLaotianLatvianLebaneseLiberianLithuanianLumbeeLuxembourgerMalaysianMexicanMexican American IndianMongolianMoroccanNative HawaiianNew ZealanderNicaraguanNigerianNorthern EuropeanNorwegianOsagePakistaniPalestinianPanamanianParaguayanPennsylvania GermanPeruvianPolishPortuguesePotawatomiPuebloPuerto RicanRomanianRussianSalvadoranSamoanScandinavianScotch-IrishScottishSeminoleSerbianSiouxSlavicSlovakSloveneSomaliSouth AfricanSouth AmericanSpaniardSpanishSri LankanSubsaharan AfricanSudaneseSwedishSwissSyrianThaiTohono O'OdhamTrinidadian and TobagonianTurkishU.S. Virgin IslanderUgandanUkrainianVenezuelanWelshWest IndianYugoslavian
Immigrant Origin (Total)
AfghanistanAfricaAlbaniaArgentinaAsiaAustraliaAustriaBangladeshBarbadosBelarusBelgiumBelizeBoliviaBosnia and HerzegovinaBrazilBulgariaBurma / MyanmarCambodiaCameroonCanadaCaribbeanCentral AmericaChileChinaColombiaCongoCosta RicaCroatiaCubaCzechoslovakiaDenmarkDominican RepublicEastern AfricaEastern AsiaEastern EuropeEcuadorEgyptEl SalvadorEnglandEritreaEthiopiaEuropeFranceGermanyGhanaGuatemalaGuyanaHaitiHondurasHong KongHungaryIndiaIndonesiaIranIraqIrelandIsraelItalyJamaicaJapanJordanKazakhstanKenyaKoreaKuwaitLaosLatin AmericaLebanonLiberiaLithuaniaMalaysiaMexicoMicronesiaMiddle AfricaMoldovaMoroccoNepalNetherlandsNicaraguaNigeriaNorthern AfricaNorthern EuropeNorwayOceaniaPakistanPanamaPeruPhilippinesPolandPortugalRomaniaRussiaSaudi ArabiaScotlandSenegalSerbiaSingaporeSomaliaSouth AfricaSouth AmericaSouth Central AsiaSouth Eastern AsiaSouthern EuropeSpainSri LankaSudanSwedenSyriaTaiwanThailandTrinidad and TobagoTurkeyUgandaUkraineUzbekistanVenezuelaVietnamWestern AfricaWestern AsiaWestern EuropeZaire
Immigrant Origin (Percentage)
AfghanistanAfricaAlbaniaArgentinaAsiaAustraliaAustriaBangladeshBarbadosBelarusBelgiumBelizeBoliviaBosnia and HerzegovinaBrazilBulgariaBurma / MyanmarCambodiaCameroonCanadaCaribbeanCentral AmericaChileChinaColombiaCongoCosta RicaCroatiaCubaCzechoslovakiaDenmarkDominican RepublicEastern AfricaEastern AsiaEastern EuropeEcuadorEgyptEl SalvadorEnglandEritreaEthiopiaEuropeFranceGermanyGhanaGuatemalaGuyanaHaitiHondurasHong KongHungaryIndiaIndonesiaIranIraqIrelandIsraelItalyJamaicaJapanJordanKazakhstanKenyaKoreaKuwaitLaosLatin AmericaLebanonLiberiaLithuaniaMalaysiaMexicoMicronesiaMiddle AfricaMoldovaMoroccoNepalNetherlandsNicaraguaNigeriaNorthern AfricaNorthern EuropeNorwayOceaniaPakistanPanamaPeruPhilippinesPolandPortugalRomaniaRussiaSaudi ArabiaScotlandSenegalSerbiaSingaporeSomaliaSouth AfricaSouth AmericaSouth Central AsiaSouth Eastern AsiaSouthern EuropeSpainSri LankaSudanSwedenSyriaTaiwanThailandTrinidad and TobagoTurkeyUgandaUkraineUzbekistanVenezuelaVietnamWestern AfricaWestern AsiaWestern EuropeZaire
Income
Income (Families)
Income (Households)
Poverty
Poverty (Families)
Unemployment
Employment Occupations
Employment Industries
Employer Class
Commute Time
Commute Means
School Enrollment
Education by Degree Field
Occupancy
Finances
Physical Characteristics
Louisville
Compare Zip Codes
Comparison Subject

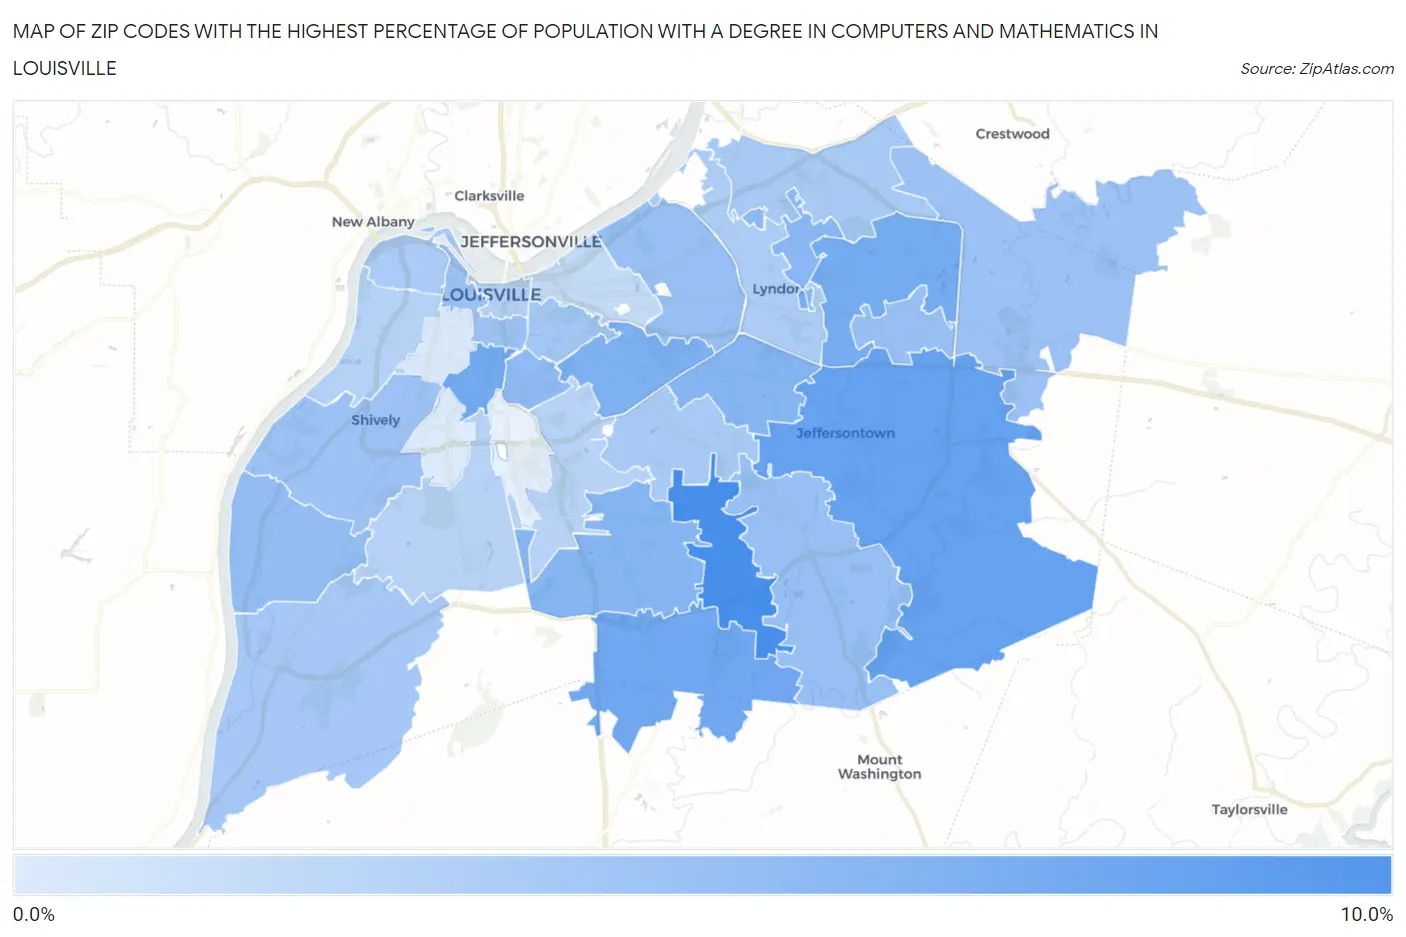
Map of Zip Codes with the Highest Percentage of Population with a Degree in Computers and Mathematics in Louisville

0.0%
10.0%
Zip Codes with the Highest Percentage of Population with a Degree in Computers and Mathematics in Louisville Map

Zip Codes with the Highest Percentage of Population with a Degree in Computers and Mathematics in Louisville, KY

Zip Code % Graduates vs State vs National
1.402288.0%3.8%(+4.18)#674.9%(+3.12)#2,883
2.402996.7%3.8%(+2.83)#754.9%(+1.77)#4,265
3.402296.1%3.8%(+2.23)#874.9%(+1.18)#5,173
4.402086.0%3.8%(+2.19)#884.9%(+1.13)#5,257
5.402235.9%3.8%(+2.06)#914.9%(+0.998)#5,504
6.402055.4%3.8%(+1.61)#1004.9%(+0.551)#6,412
7.402205.2%3.8%(+1.39)#1044.9%(+0.328)#6,943
8.402195.2%3.8%(+1.33)#1094.9%(+0.267)#7,065
9.402425.0%3.8%(+1.13)#1134.9%(+0.076)#7,519
10.402174.7%3.8%(+0.905)#1264.9%(-0.153)#8,150
11.402584.5%3.8%(+0.672)#1334.9%(-0.386)#8,847
12.402074.4%3.8%(+0.536)#1404.9%(-0.522)#9,285
13.402914.3%3.8%(+0.500)#1424.9%(-0.558)#9,410
14.402434.3%3.8%(+0.483)#1434.9%(-0.575)#9,479
15.402164.3%3.8%(+0.430)#1444.9%(-0.628)#9,640
16.402454.2%3.8%(+0.357)#1514.9%(-0.701)#9,861
17.402034.1%3.8%(+0.308)#1544.9%(-0.750)#10,007
18.402043.8%3.8%(-0.048)#1794.9%(-1.11)#11,233
19.402723.7%3.8%(-0.112)#1844.9%(-1.17)#11,455
20.402183.6%3.8%(-0.214)#1904.9%(-1.27)#11,809
21.402413.6%3.8%(-0.253)#1924.9%(-1.31)#11,958
22.402123.6%3.8%(-0.272)#1944.9%(-1.33)#12,046
23.402223.5%3.8%(-0.373)#1984.9%(-1.43)#12,428
24.402023.1%3.8%(-0.724)#2224.9%(-1.78)#13,687
25.402113.0%3.8%(-0.847)#2304.9%(-1.90)#14,125
26.402132.9%3.8%(-0.912)#2354.9%(-1.97)#14,348
27.402142.9%3.8%(-0.918)#2364.9%(-1.98)#14,366
28.402062.4%3.8%(-1.43)#2544.9%(-2.49)#16,257
29.402101.5%3.8%(-2.36)#2944.9%(-3.42)#19,208
30.402151.3%3.8%(-2.54)#3074.9%(-3.60)#19,739

Common Questions

What are the Top 10 Zip Codes with the Highest Percentage of Population with a Degree in Computers and Mathematics in Louisville, KY?
Top 10 Zip Codes with the Highest Percentage of Population with a Degree in Computers and Mathematics in Louisville, KY are:
#1
8.0%
#2
6.7%
#3
6.1%
#4
6.0%
#5
5.9%
#6
5.4%
#7
5.2%
#8
5.2%
#9
5.0%
#10
4.7%
What zip code has the Highest Percentage of Population with a Degree in Computers and Mathematics in Louisville, KY?
40228 has the Highest Percentage of Population with a Degree in Computers and Mathematics in Louisville, KY with 8.0%.
What is the Percentage of Population with a Degree in Computers and Mathematics in Louisville, KY?
Percentage of Population with a Degree in Computers and Mathematics in Louisville is 4.1%.
What is the Percentage of Population with a Degree in Computers and Mathematics in Kentucky?
Percentage of Population with a Degree in Computers and Mathematics in Kentucky is 3.8%.
What is the Percentage of Population with a Degree in Computers and Mathematics in the United States?
Percentage of Population with a Degree in Computers and Mathematics in the United States is 4.9%.